Business Plan Financial Model - 5-Year 3-Statement Forecast, Funding and Valuation (Excel)
Originally published: 09/10/2026 06:31
Publication number: ELQ-24673-1
View all versions & Certificate
certified

Business Plan Financial Model - 5-Year 3-Statement Forecast, Funding and Valuation (Excel)

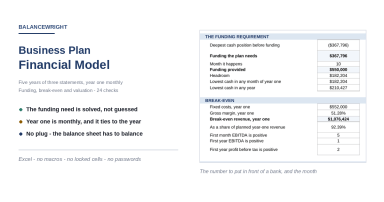
Five years of three statements, year one monthly, the funding the plan needs and the month it needs it, break-even, a valuation done two ways.

Description
Ask most business plan templates how much money the plan needs and they will point at the first-year loss. That is the wrong number, usually by a lot.

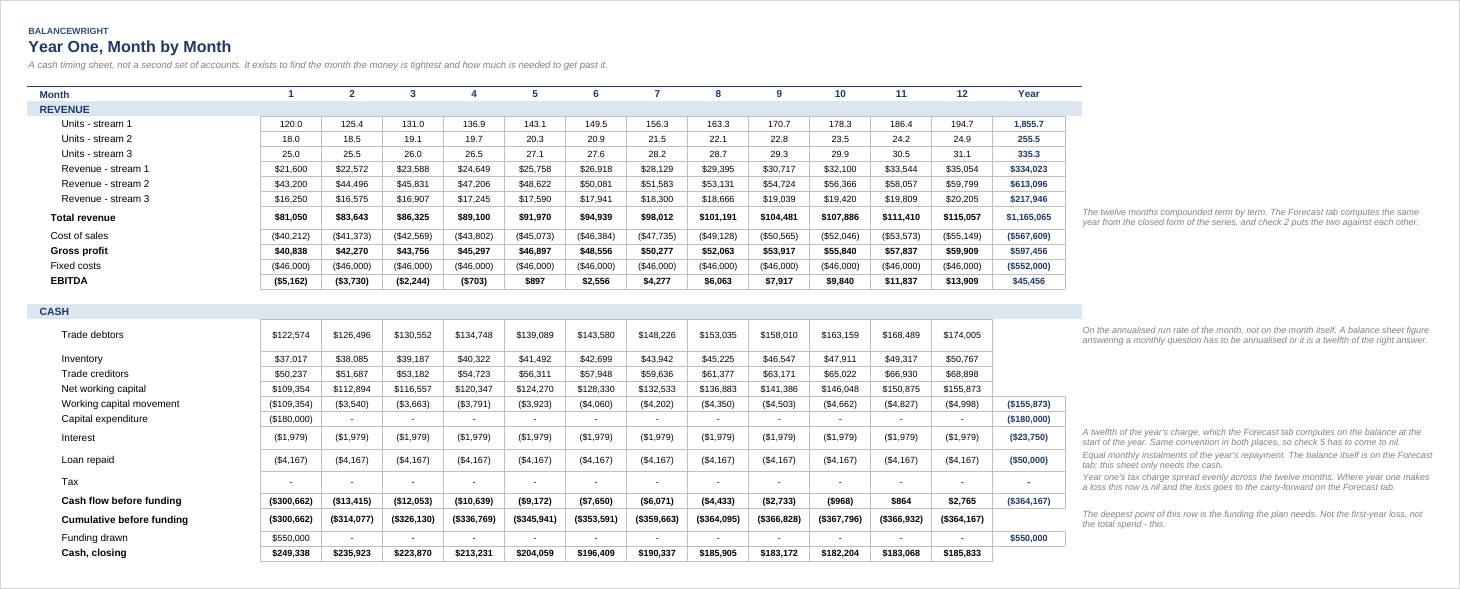
A plan needs whatever the cumulative cash position reaches at its worst point, after the capital expenditure, after the working capital the growth consumes, after the interest, and at the moment those actually happen rather than at the year end when they have netted off against each other.

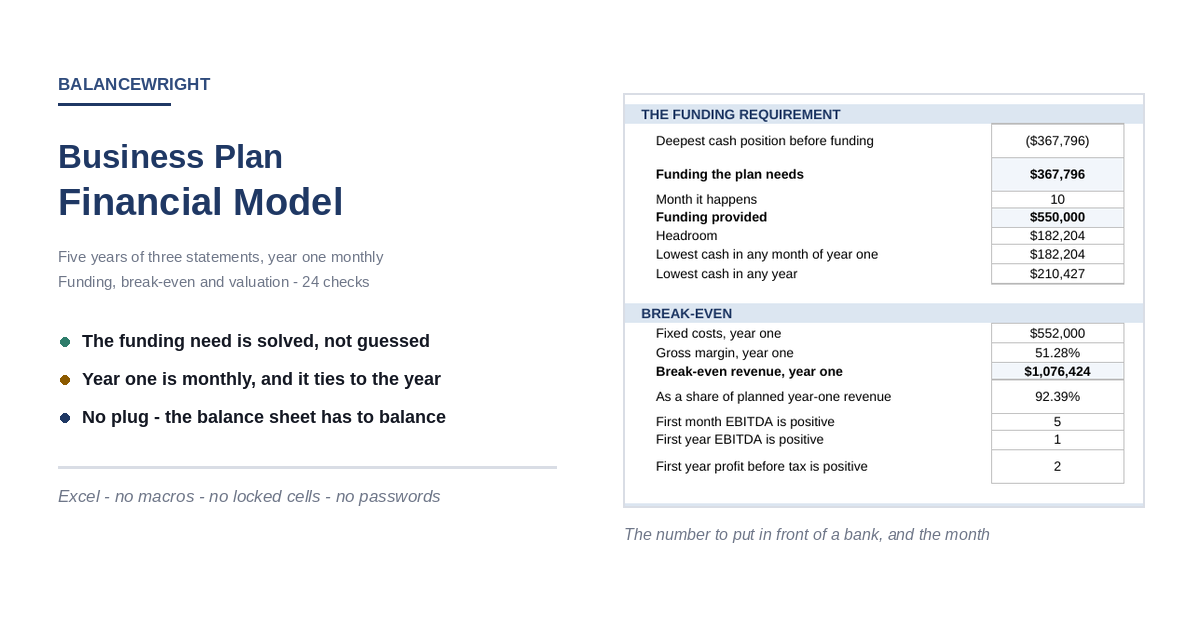
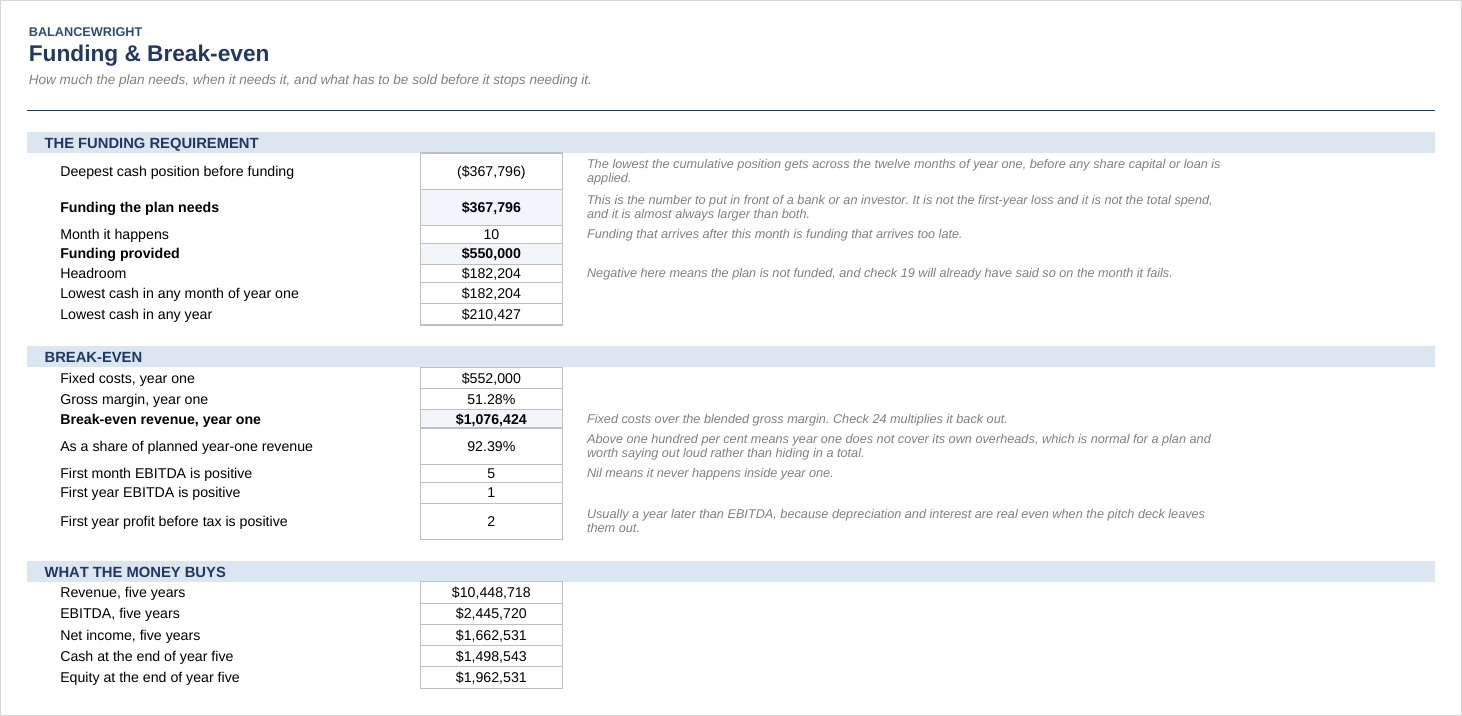
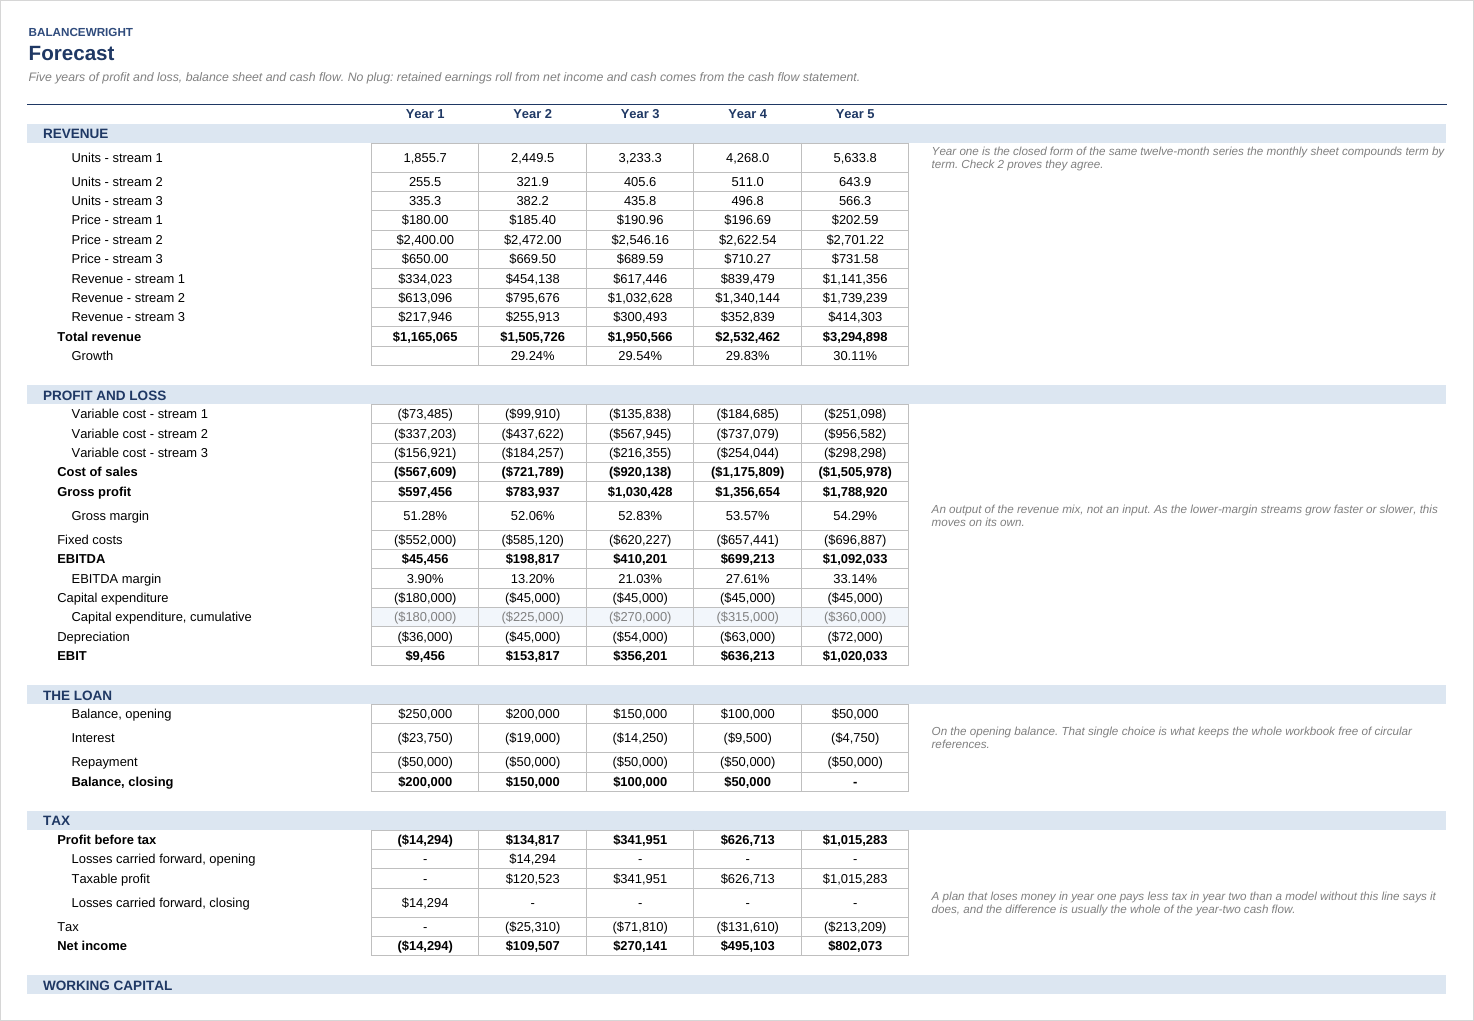
In the worked example the first-year loss is 14,294 dollars. The funding requirement is 367,796 dollars, and it is reached in month ten. A plan funded to the loss would run out of money in the third quarter of a year it was going to survive.

What it does
Three revenue streams built from units and price. A full profit and loss, balance sheet and cash flow for five years. Year one month by month. The funding requirement with the month it happens. Live break-even in money, as a share of the plan, and as the first month and first year each of EBITDA and pre-tax profit turn positive. A valuation done two ways. Seven tabs, 735 live formulas, twenty-four built-in checks.

The three things that make it different
1. The funding requirement is solved, not guessed. The monthly sheet tracks the cash position before any funding is applied, finds the deepest point and names the month. Funding that arrives after that month is funding that arrives too late. Put in less than the requirement and check 19 fails, on the month it fails.
2. Year one is monthly, and it ties. Most templates have an annual model and a separate monthly sheet that quietly disagree, because nobody ever checks. Here the two are built from the same assumptions by different arithmetic. The monthly sheet compounds the growth rate twelve times, the annual one uses the closed form of that same series, and checks 2 to 5 put revenue, cost of sales, EBITDA, interest and loan repayment against each other to the cent.
3. There is no plug. Retained earnings roll from net income. Cash comes from the cash flow statement. Property and equipment rolls from capital expenditure less depreciation. Nothing in the file is made to absorb a difference. When the balance sheet balances, which is check 1, it balances because the arithmetic is right.

Things most business plan templates get wrong, and this one does not
  • The blended gross margin is an output of the revenue mix, not an input. When the lower-margin stream grows faster the margin falls on its own.
  • Tax is charged on taxable profit after losses carried forward. The difference is often the whole of the year-two cash flow.
  • Working capital consumes cash before growth produces any, month by month, on the run rate of the month rather than a twelfth of an annual figure.
  • Interest is charged on the opening balance, so there is no circular reference and iterative calculation stays off.
  • Pre-tax break-even is shown as well as EBITDA break-even, usually a year later, because depreciation and interest are real even when the pitch deck leaves them out.
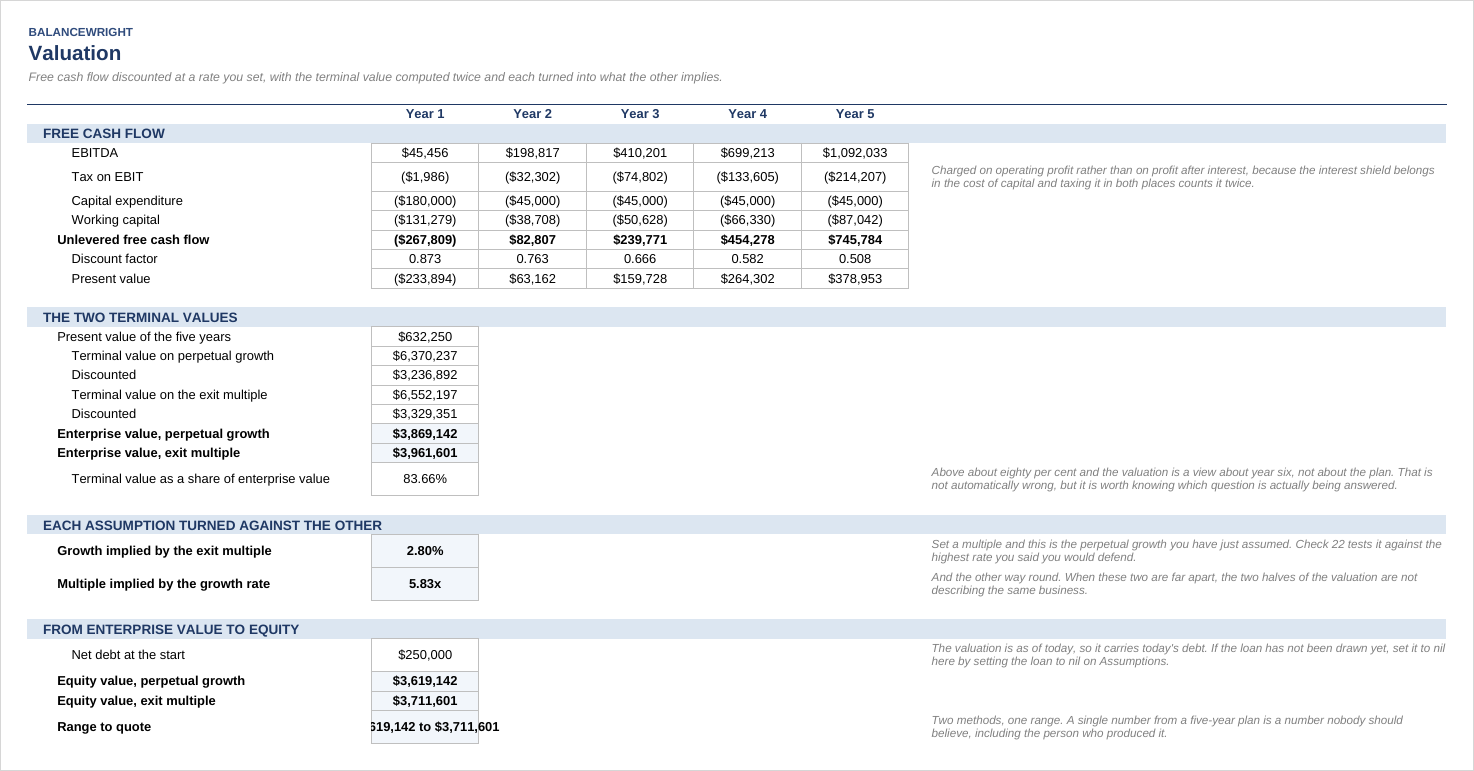
  • The terminal value share of enterprise value is on the face of the valuation tab. In the worked example it is 84 per cent, which means the valuation is mostly a view about year six rather than about the plan.

What is in the file
  • Read Me: what it is, who it is for, and the conventions it uses.
  • Assumptions: every input in the workbook. Three streams with units, growth, price, variable cost and annual growth; four fixed cost lines; capital expenditure and depreciation life; debtor, inventory and creditor days; share capital, loan, rate, term, tax rate; cost of capital, terminal growth and exit multiple.
  • Year One: twelve months of revenue, costs, EBITDA, working capital, capital expenditure, interest and tax, and the cumulative cash position before funding whose lowest point is the whole answer.
  • Forecast: five years of profit and loss, the loan, tax with losses carried forward, working capital, cash flow and balance sheet, in that order on one tab.
  • Funding: the requirement, the month, what is provided, the headroom, and break-even.
  • Valuation: unlevered free cash flow discounted at your rate, terminal value computed twice, and each assumption turned into what the other implies.
  • Checks: twenty-four tests.

The checks
Every subtotal recomputed from its components. The balance sheet balancing in every year. Retained earnings moving by exactly net income. Property and equipment rolling by capital expenditure less depreciation. Five years of cash flow lines adding to the closing balance. Interest on the opening loan balance. The loan clear at the end of its term. Tax at the rate on taxable profit after losses carried forward. Cash never negative in any month of year one or in any year. Every cost line an outflow. The growth implied by the exit multiple inside the band you declared. And break-even revenue multiplied back out against fixed costs, because a break-even number that does not reverse is a number somebody typed.
All twenty-four were independently re-derived in 126 separate comparisons against a second, from-scratch implementation of the whole plan: the monthly series, the annual series, the loan, the loss carry-forward, the working capital, the balance sheet, the funding trough and the valuation, with the implied terminal growth reversed back into the terminal value it came from as a final cross-check.

The worked example
Tidebank Systems. Three streams: subscriptions at 180 dollars a month on a 78 per cent margin, professional services at 2,400 dollars on 45 per cent, hardware resale at 650 dollars on 28 per cent.
Year one: 1.17m of revenue, a 51.3 per cent blended margin, 552,000 of fixed costs, EBITDA of 45,456 and a pre-tax loss of 14,294. Funding needed 367,796 in month ten; 550,000 provided as 300,000 of share capital and a 250,000 five-year loan at 9.5 per cent; headroom 182,204. Break-even revenue 1,076,424, which is 92 per cent of the year-one plan. EBITDA turns positive in month five; pre-tax profit not until year two.
Five years: 10.4m of revenue, 2.4m of EBITDA, 1.7m of net income, 1.5m of cash and 2.0m of equity at the end of year five. Equity value 3.62m to 3.71m across the two valuation methods.

What it is not
It is not a cap table: one class of share capital, no options, no dilution. It does not model a revolver or an overdraft; one term loan, drawn at the start and amortised. It has no monthly balance sheet, by design. It does not handle multiple entities, currencies or VAT. And it is not a substitute for the plan: the numbers are only as good as the units, prices and growth rates typed into them, and the job of the file is to make sure those assumptions produce a coherent set of statements, not to make them true.

Format
One Microsoft Excel workbook (.xlsx). Opens in Excel 2016 and later, Microsoft 365, LibreOffice Calc, Apple Numbers and Google Sheets. No macros, no add-ins, no external links, no password protection, no locked cells, iterative calculation off. Blue on pale yellow is an input; nothing else in the file should be typed into. A nine-page guide and preview PDF is included.
Building this from scratch takes a competent financial modeller two to four days.

This Best Practice includes
Seven tabs: Read Me, Assumptions, Year One (12 monthly columns), Forecast (5-year P&L, balance sheet and cash flow), Funding, Valuation, Checks. 735 live formulas, 24 built-in tests, one xlsx plus a 9-page guide PDF.

Acquire business license for $29.00

Add to cart

Add to bookmarks

Discuss

Further information

Work out how much money the plan actually needs, and in which month it needs it
Build a five-year profit and loss, balance sheet and cash flow that tie to each other
See year one month by month, with the monthly and annual views reconciled to the cent
Know the revenue at which the plan breaks even, before and after depreciation and interest
Value the business two ways and see how much of the answer is terminal value

You are writing a business plan or an investor pack and need the numbers behind it
You need to name a funding requirement and defend it
You want a three-statement model you can audit rather than a black box
You are reviewing somebody else's plan and want to test whether it hangs together

You need a cap table with option pools and dilution
You need a revolving credit facility, an overdraft or multiple debt tranches
You need a monthly balance sheet, multiple entities, currencies or VAT
You want a model that makes optimistic assumptions look true


0.0 / 5 (0 votes)

please wait...