
Originally published: 02/08/2016 09:01
Publication number: ELQ-86769-1
View all versions & Certificate
Publication number: ELQ-86769-1
View all versions & Certificate

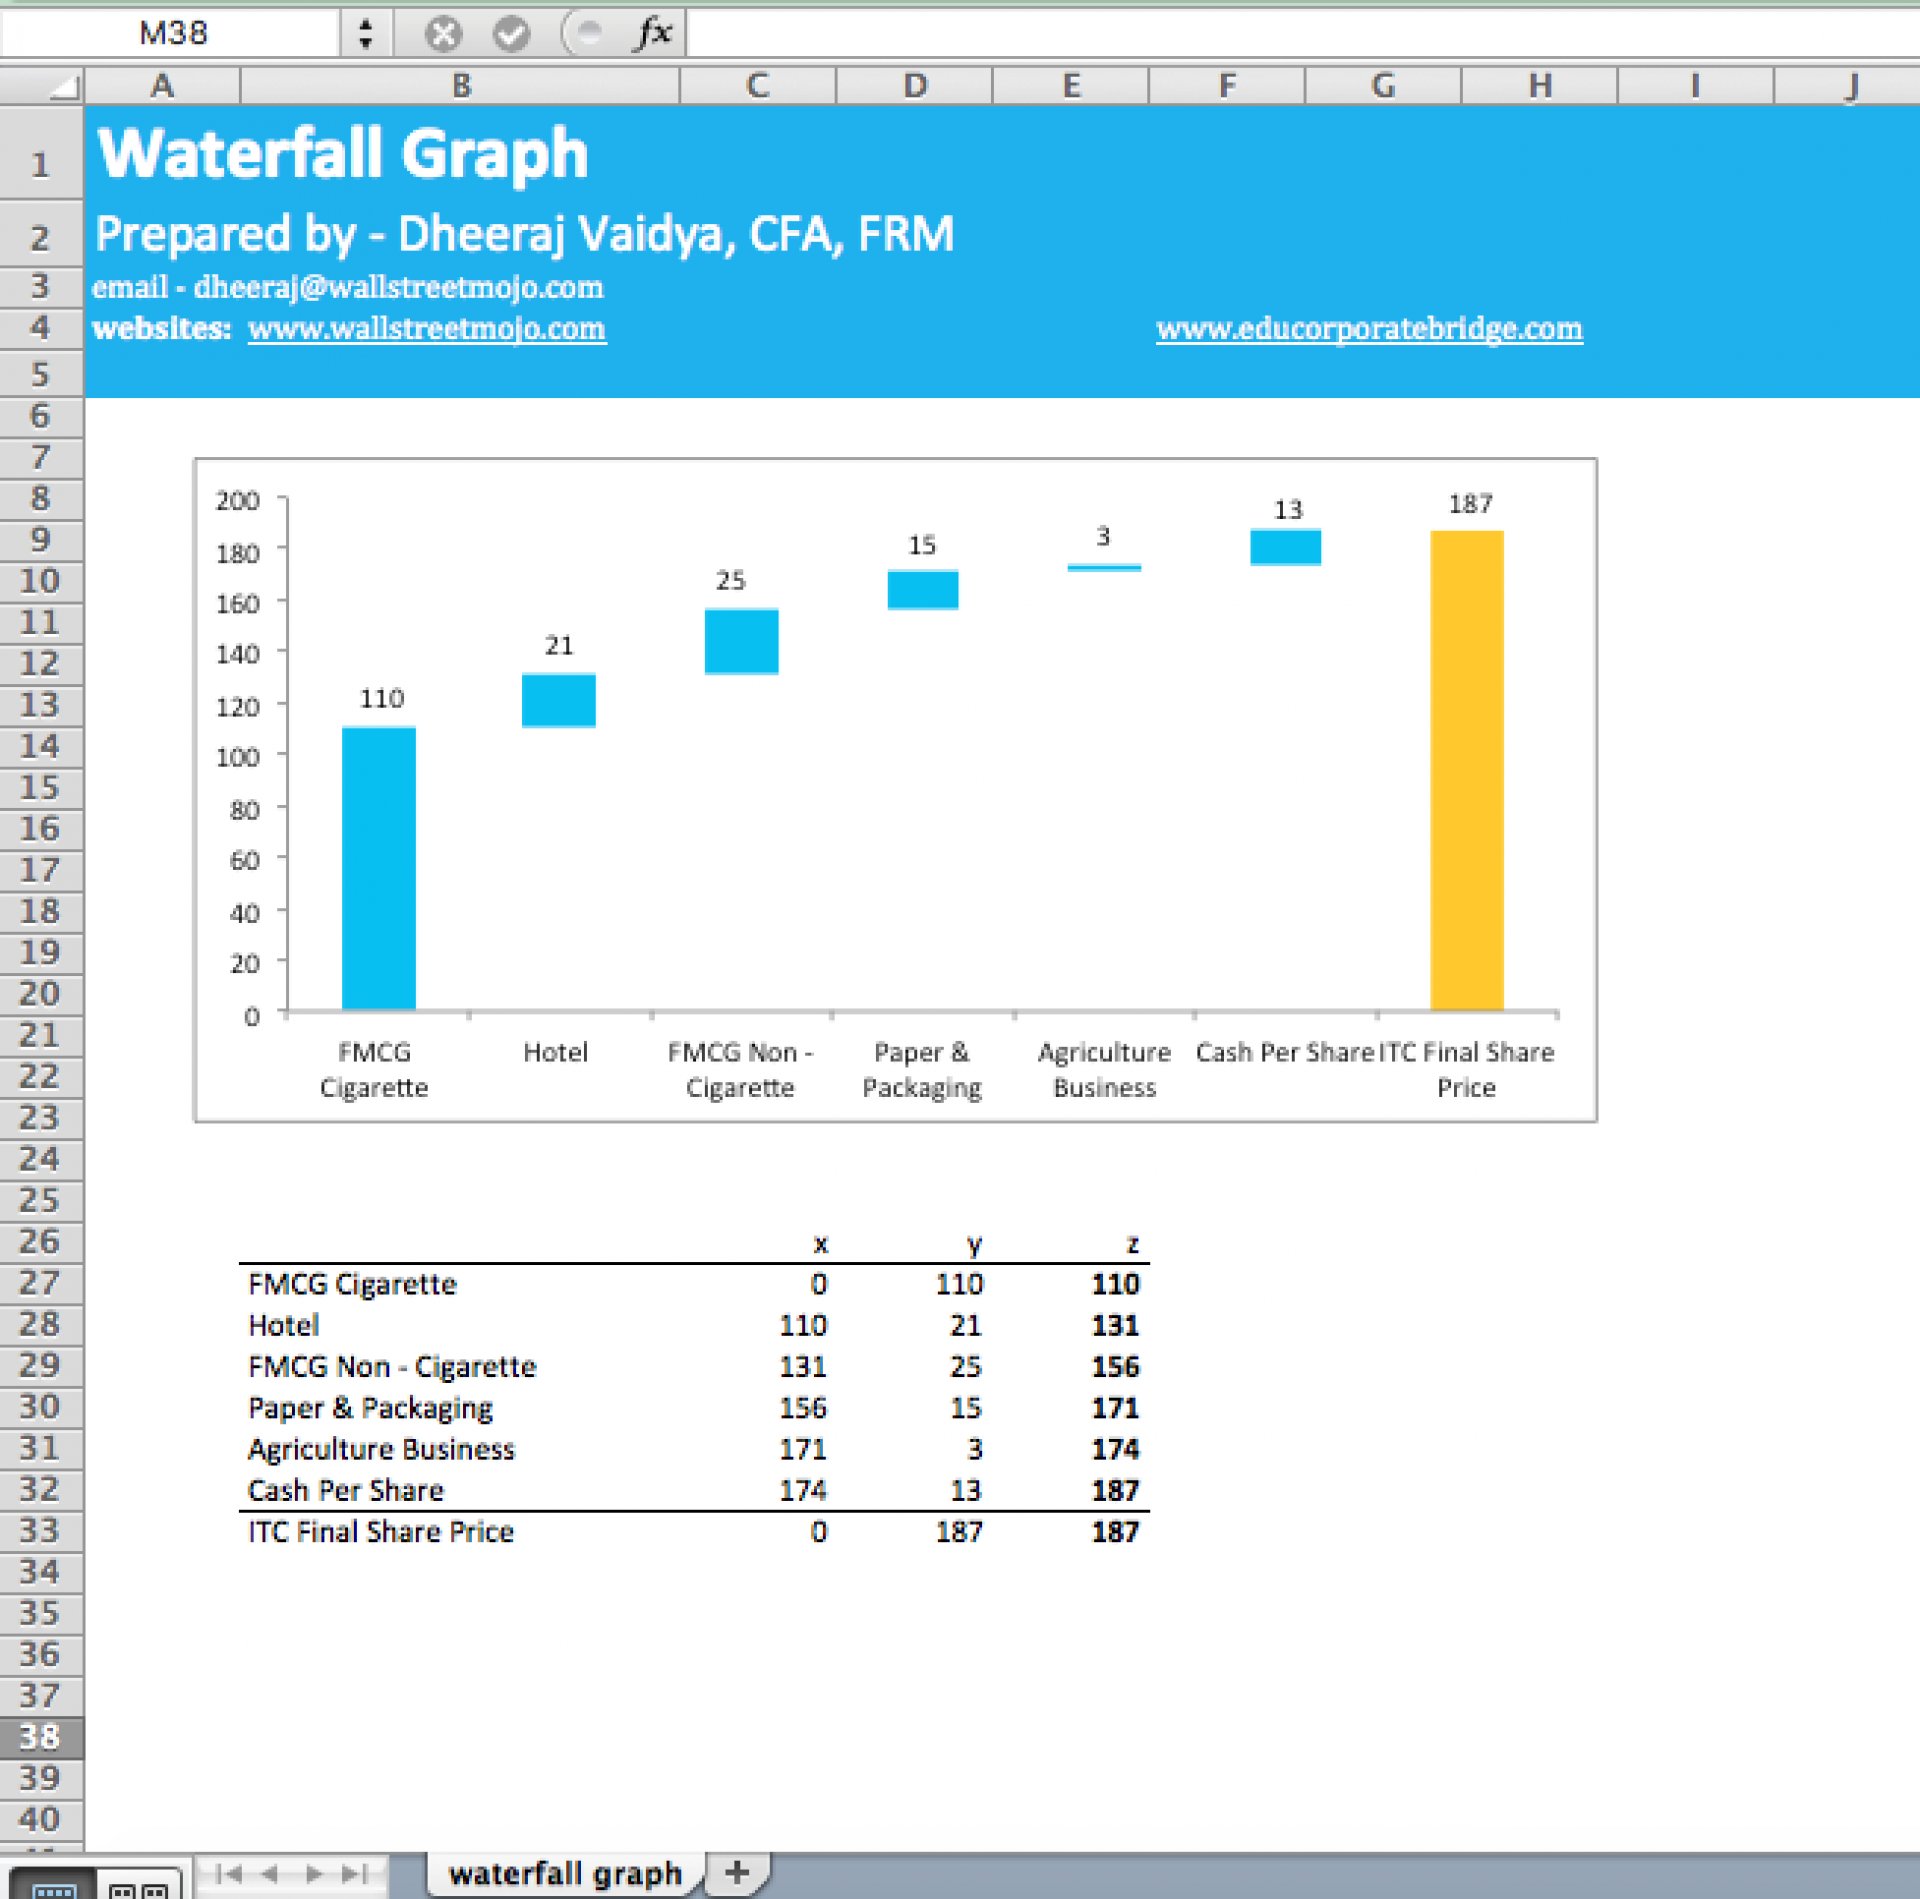
Valuation Waterfall Graph
Show your audience how the share price of a target company can be broken up in its sub-components
Dheeraj Vaidya CFA FRM offers you this Best Practice for free!
download for free
Add to bookmarks
