

Originally published: 05/04/2022 10:30
Last version published: 13/11/2023 09:51
Publication number: ELQ-66329-4
View all versions & Certificate
Last version published: 13/11/2023 09:51
Publication number: ELQ-66329-4
View all versions & Certificate

Fund Distribution Waterfall Model with Carried Interest Calculation
Excel model for calculating the distribution of funds between the Limited Partner (‘LP’) and General Partner (‘GP’) for a PE fund
private equitygeneral partnerlimited partnerwaterfallfund distributioncatch uphurdle rateirrcarried interestexcel
Description
PURPOSE OF MODEL
User-friendly Excel model for calculating the distribution of funds between the Limited Partner (‘LP’) and General Partner (‘GP’) for a private equity investment or fund.
The model is flexible allowing the user to input up to 10 different underlying portfolio company investments within the fund with their individual capital contributions and distributions across a 10 year quarterly timeline with 3 scenarios. The cash flow and waterfall assumptions include equity contribution splits, LP hurdle rates, GP catch up provisions, GP carried interest, GP management fee and fund operating expenses.
The model follows best practice financial modelling principles and includes instructions, checks and input validations.
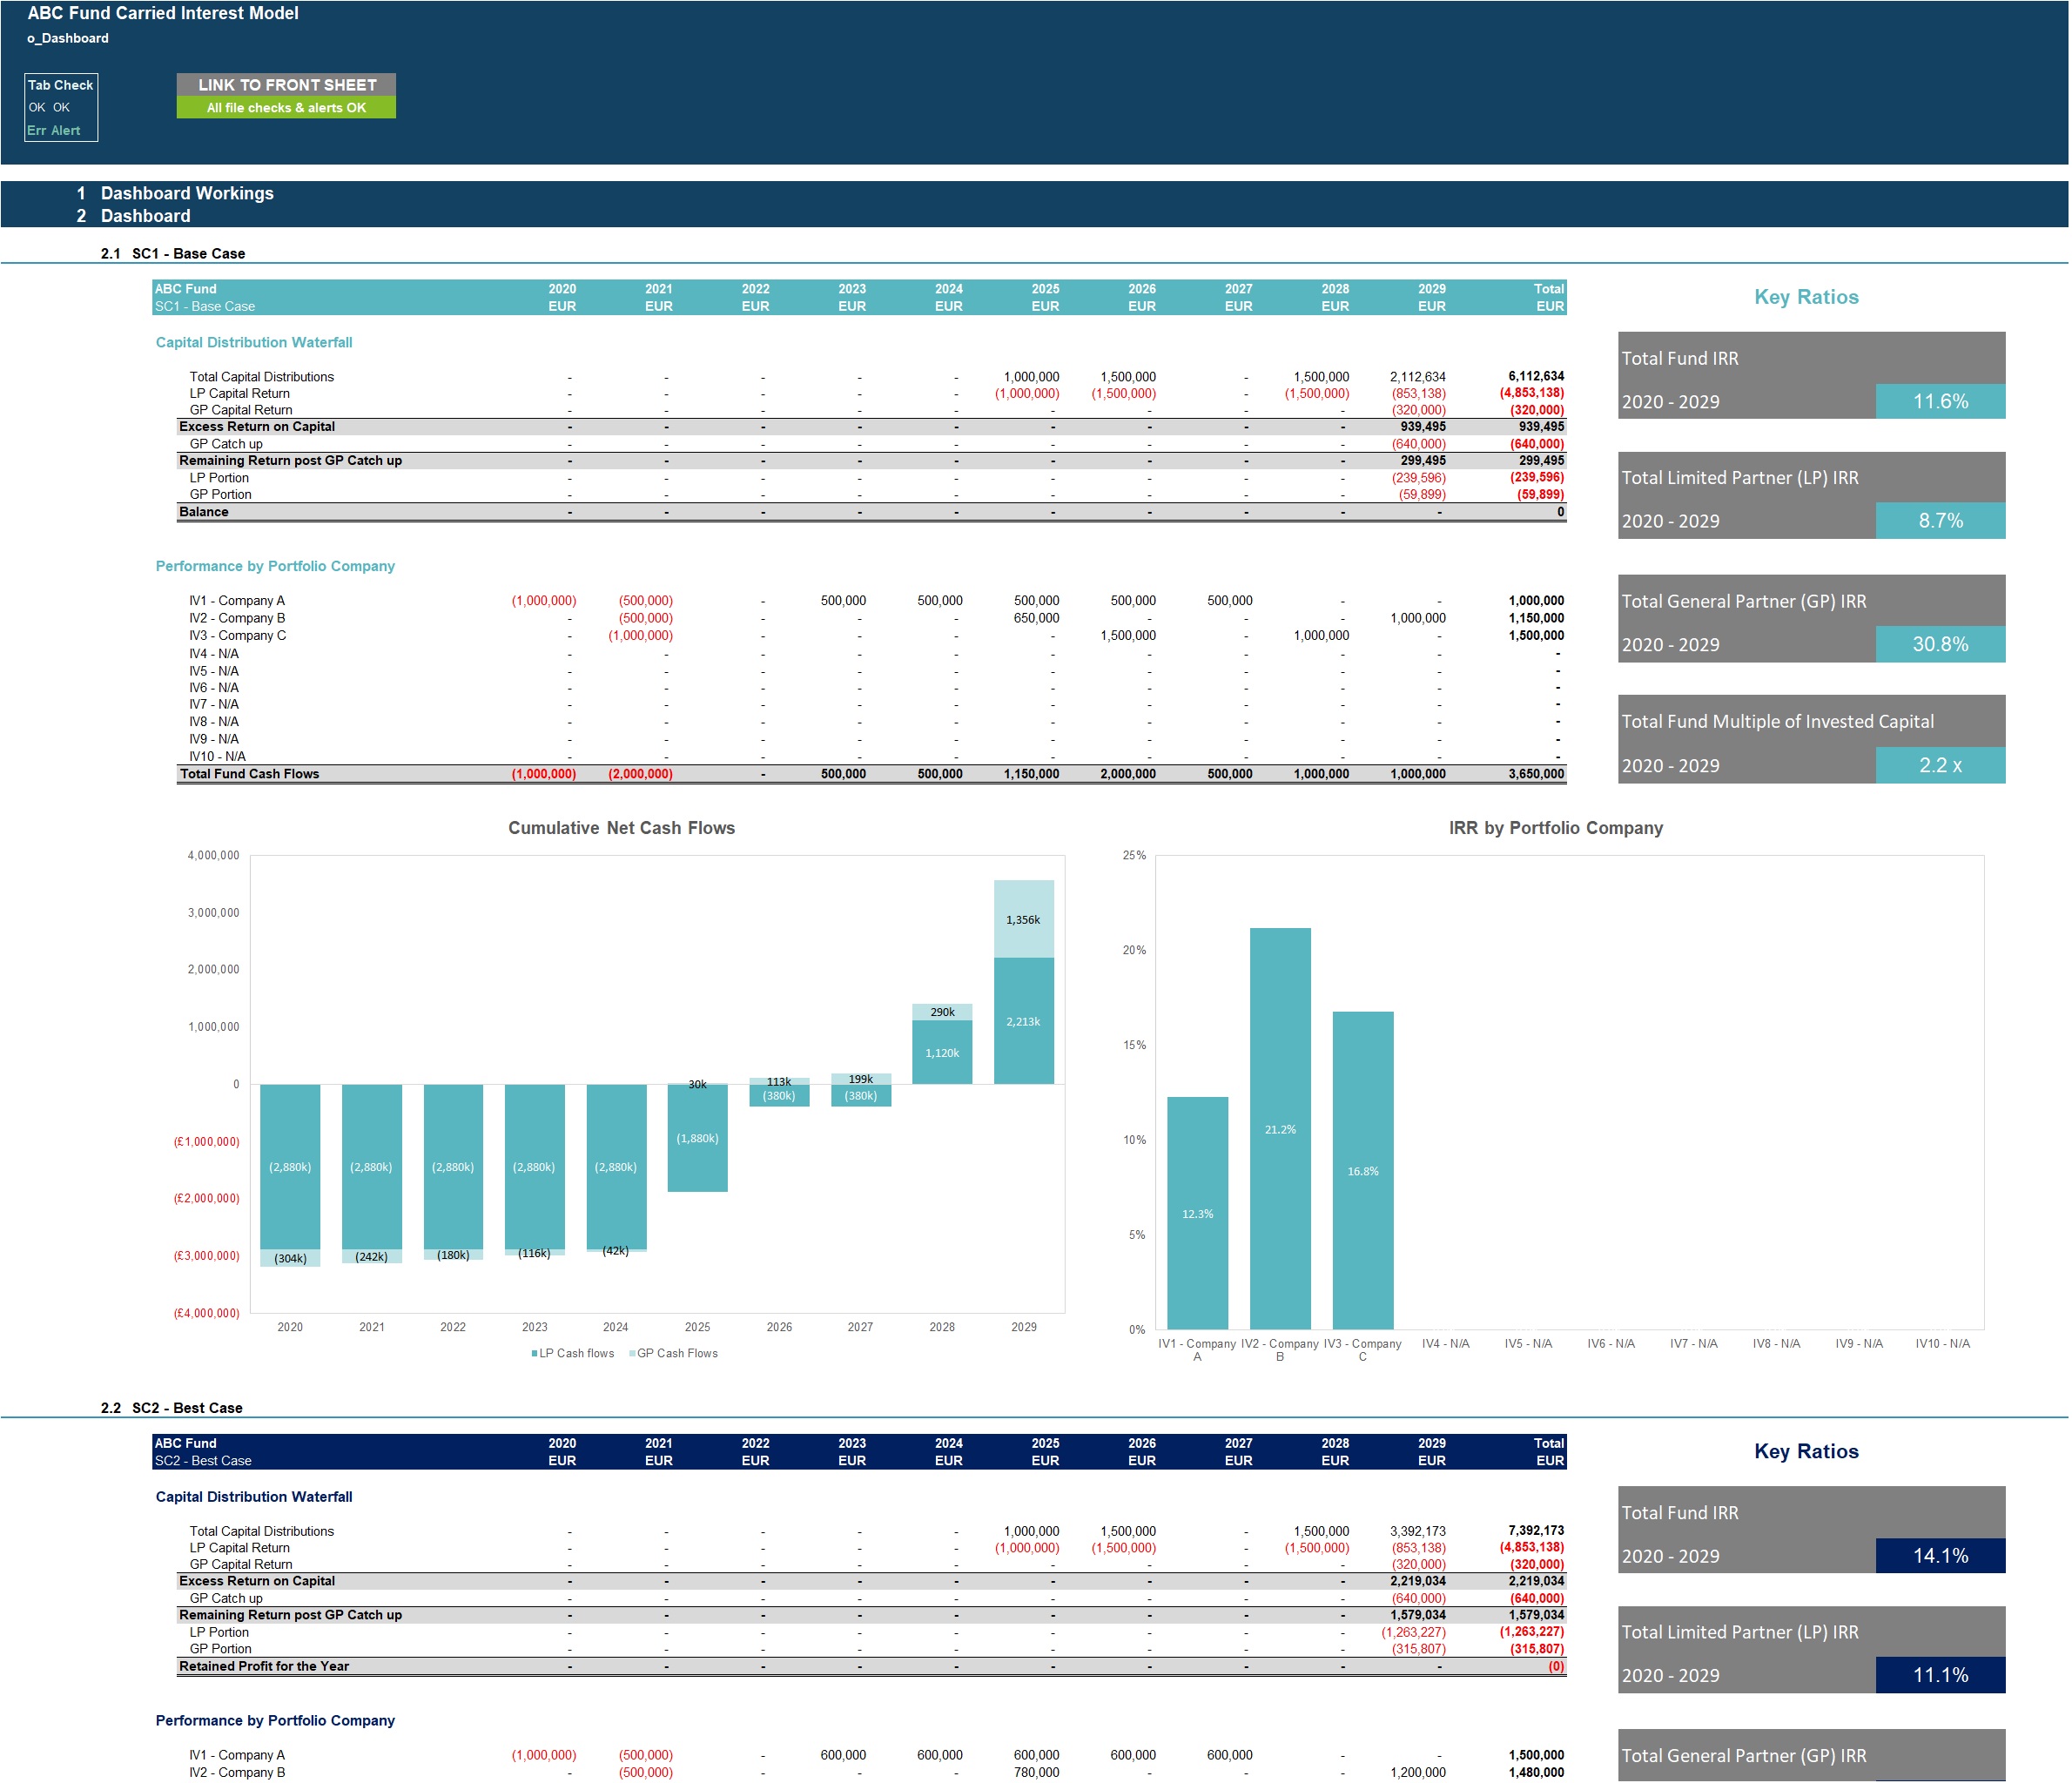
KEY OUTPUTS
The model is generic and not industry-specific. The key outputs presented in both table and chart format include:
- Waterfall of fund distributions
- IRR on total fund basis and for GP and LP
- IRR and net cash flows by portfolio company
- Multiples of invested capital
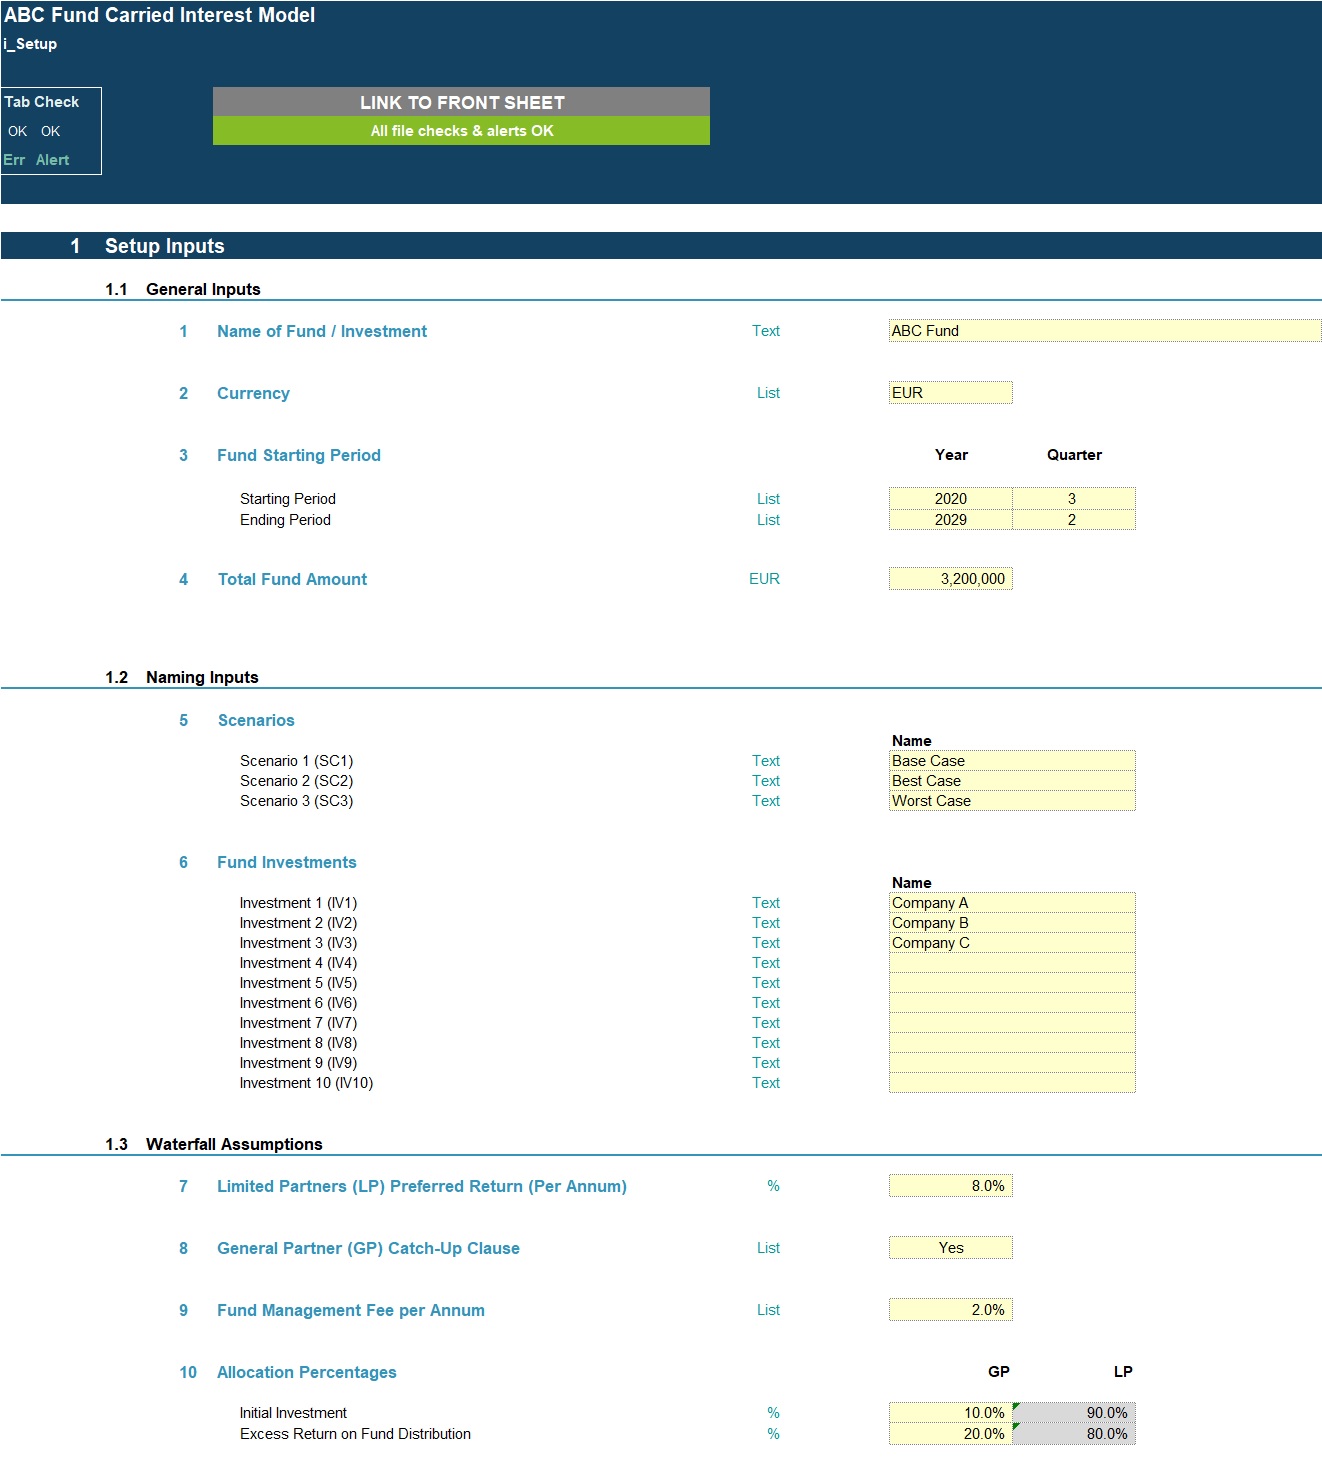
KEY INPUTS
Inputs are split into setup inputs and cash flow inputs. All inputs include user-friendly input validations to help users populate correctly.
Setup inputs include:
- Fund name
- Names of underlying investments
- Fund starting and ending quarter
- Total fund amount
- Currency
- Waterfall assumptions including LP hurdle rate, equity contribution percentages, GP carried interest, GP catch up clause, GP management fee, Fund operating expenses
- Scenario naming
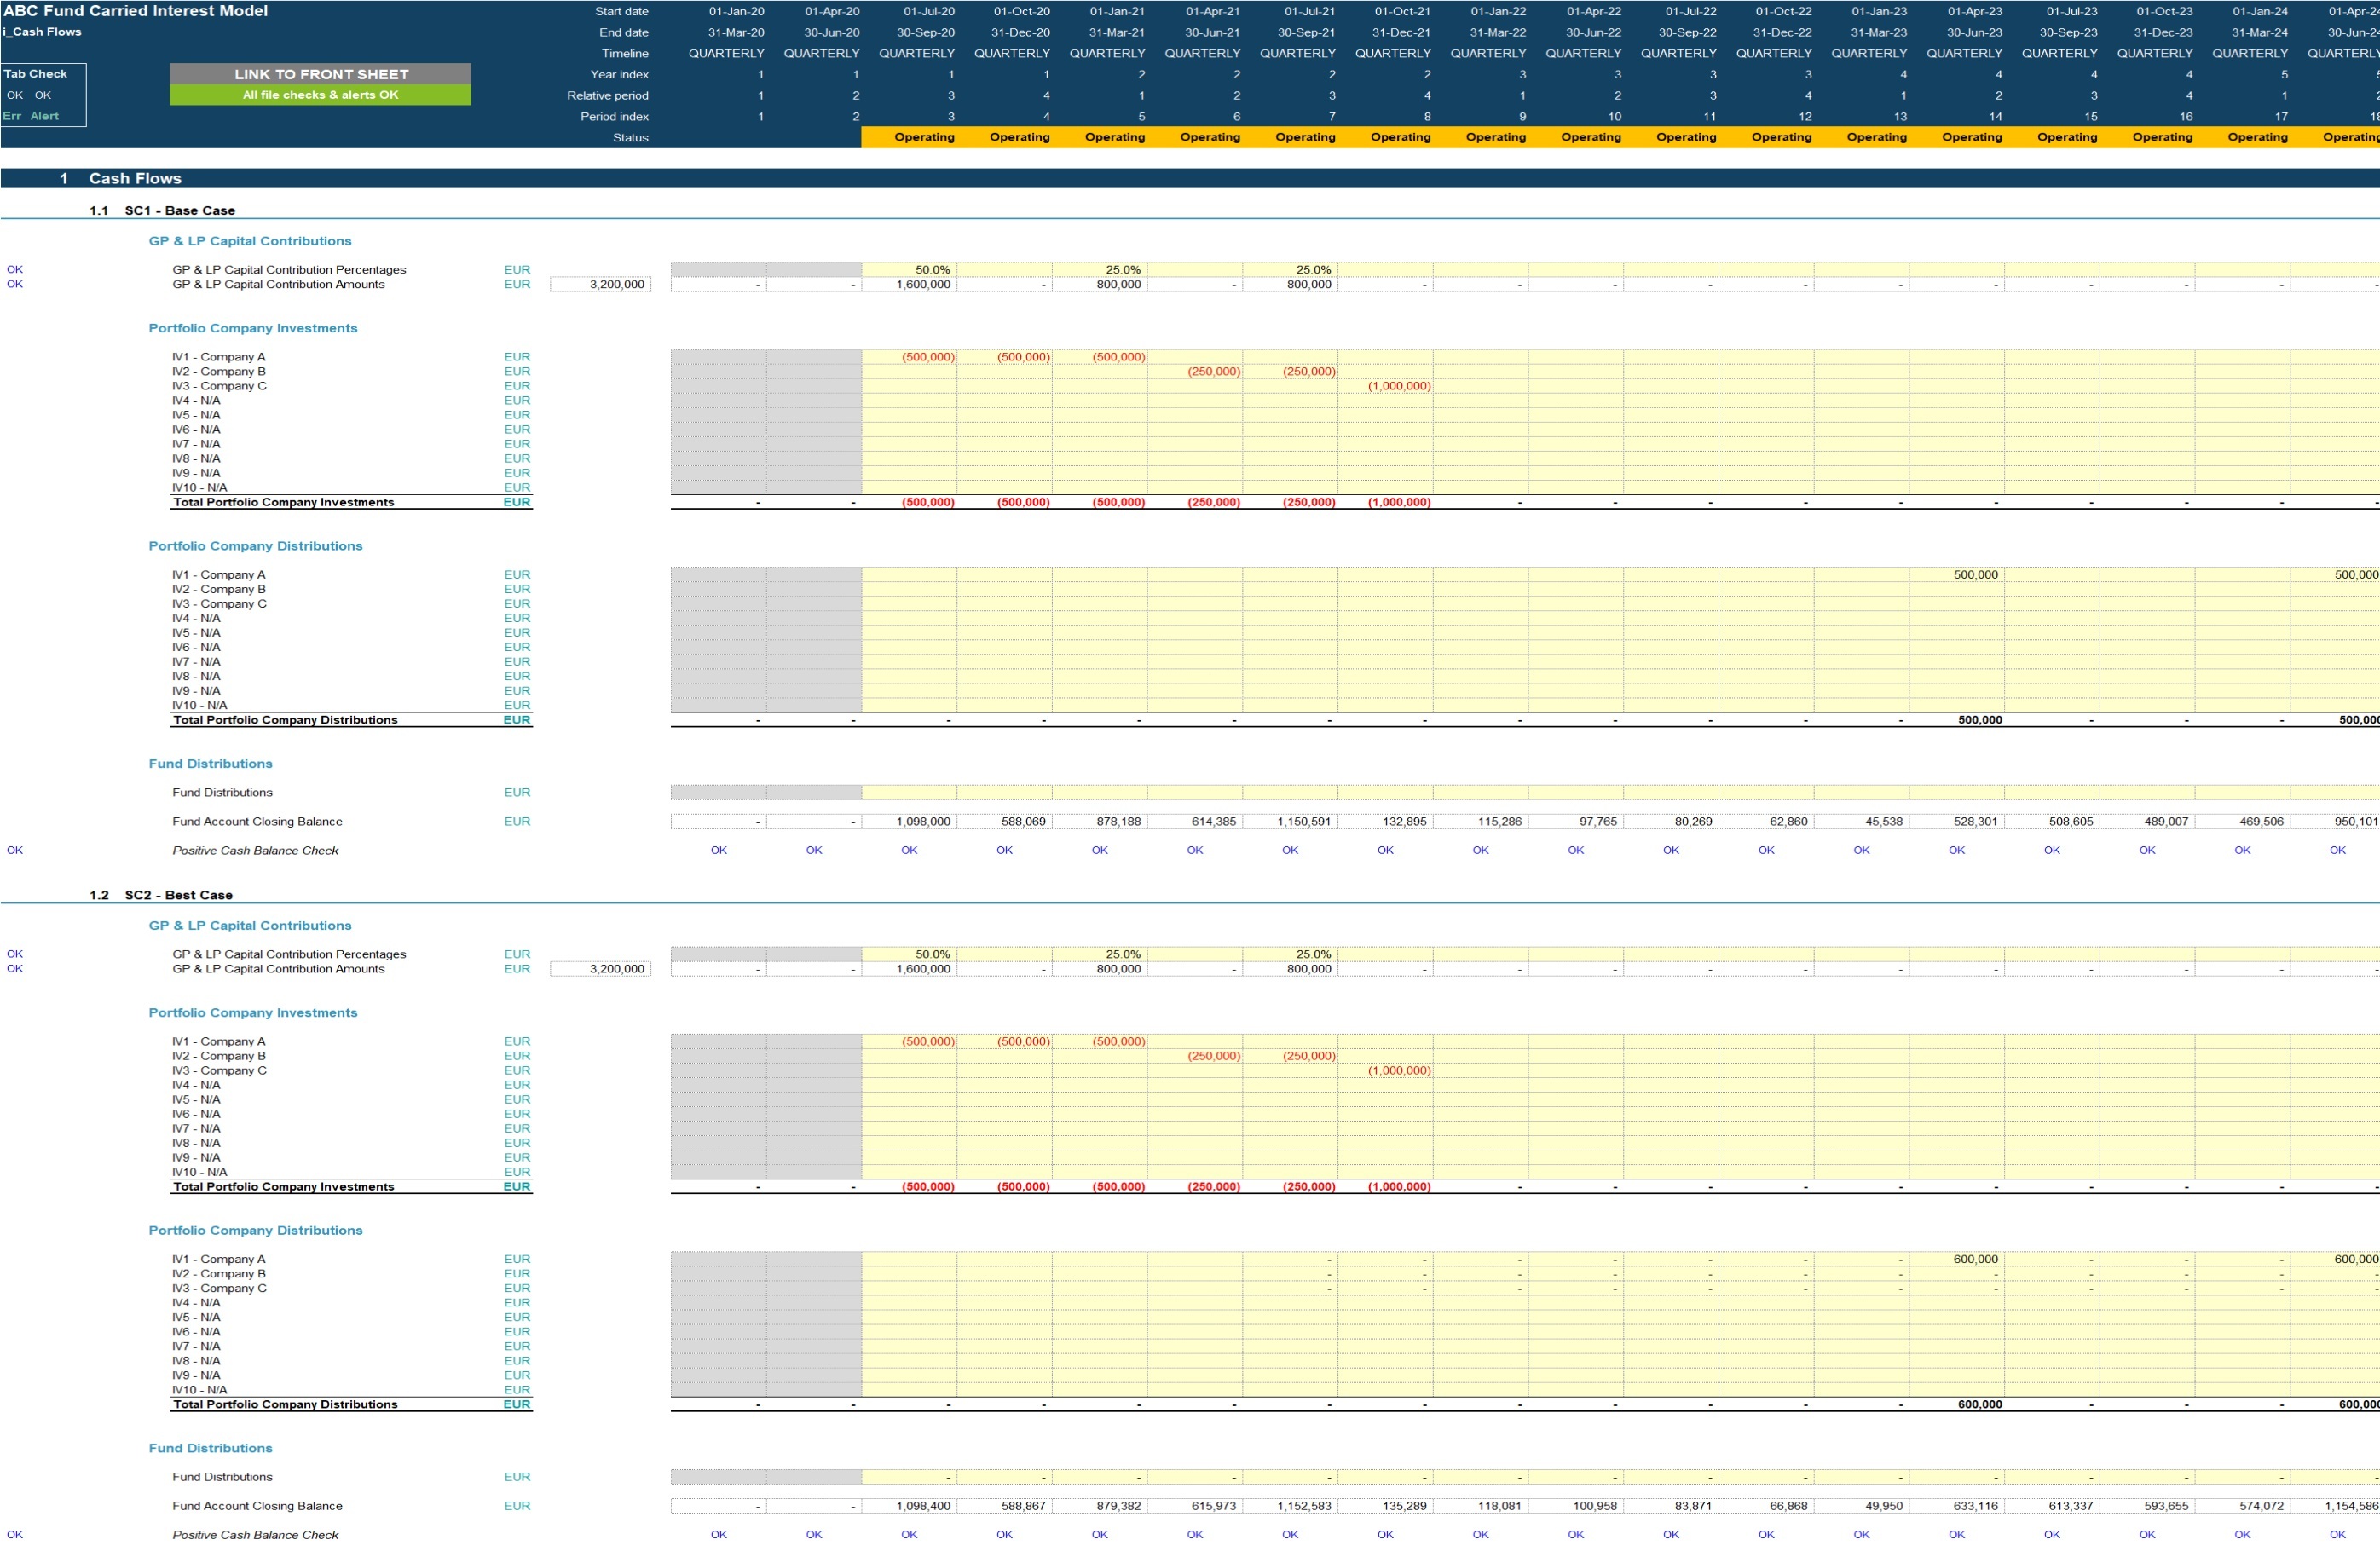
Cash Flow inputs include:
- Fund Capital contribution deployment percentage by period.- Investment amounts by underlying portfolio company and scenario
- Distribution amounts by underlying portfolio company and scenario
- Fund distributions by scenario
- Fund operating expense cash flows
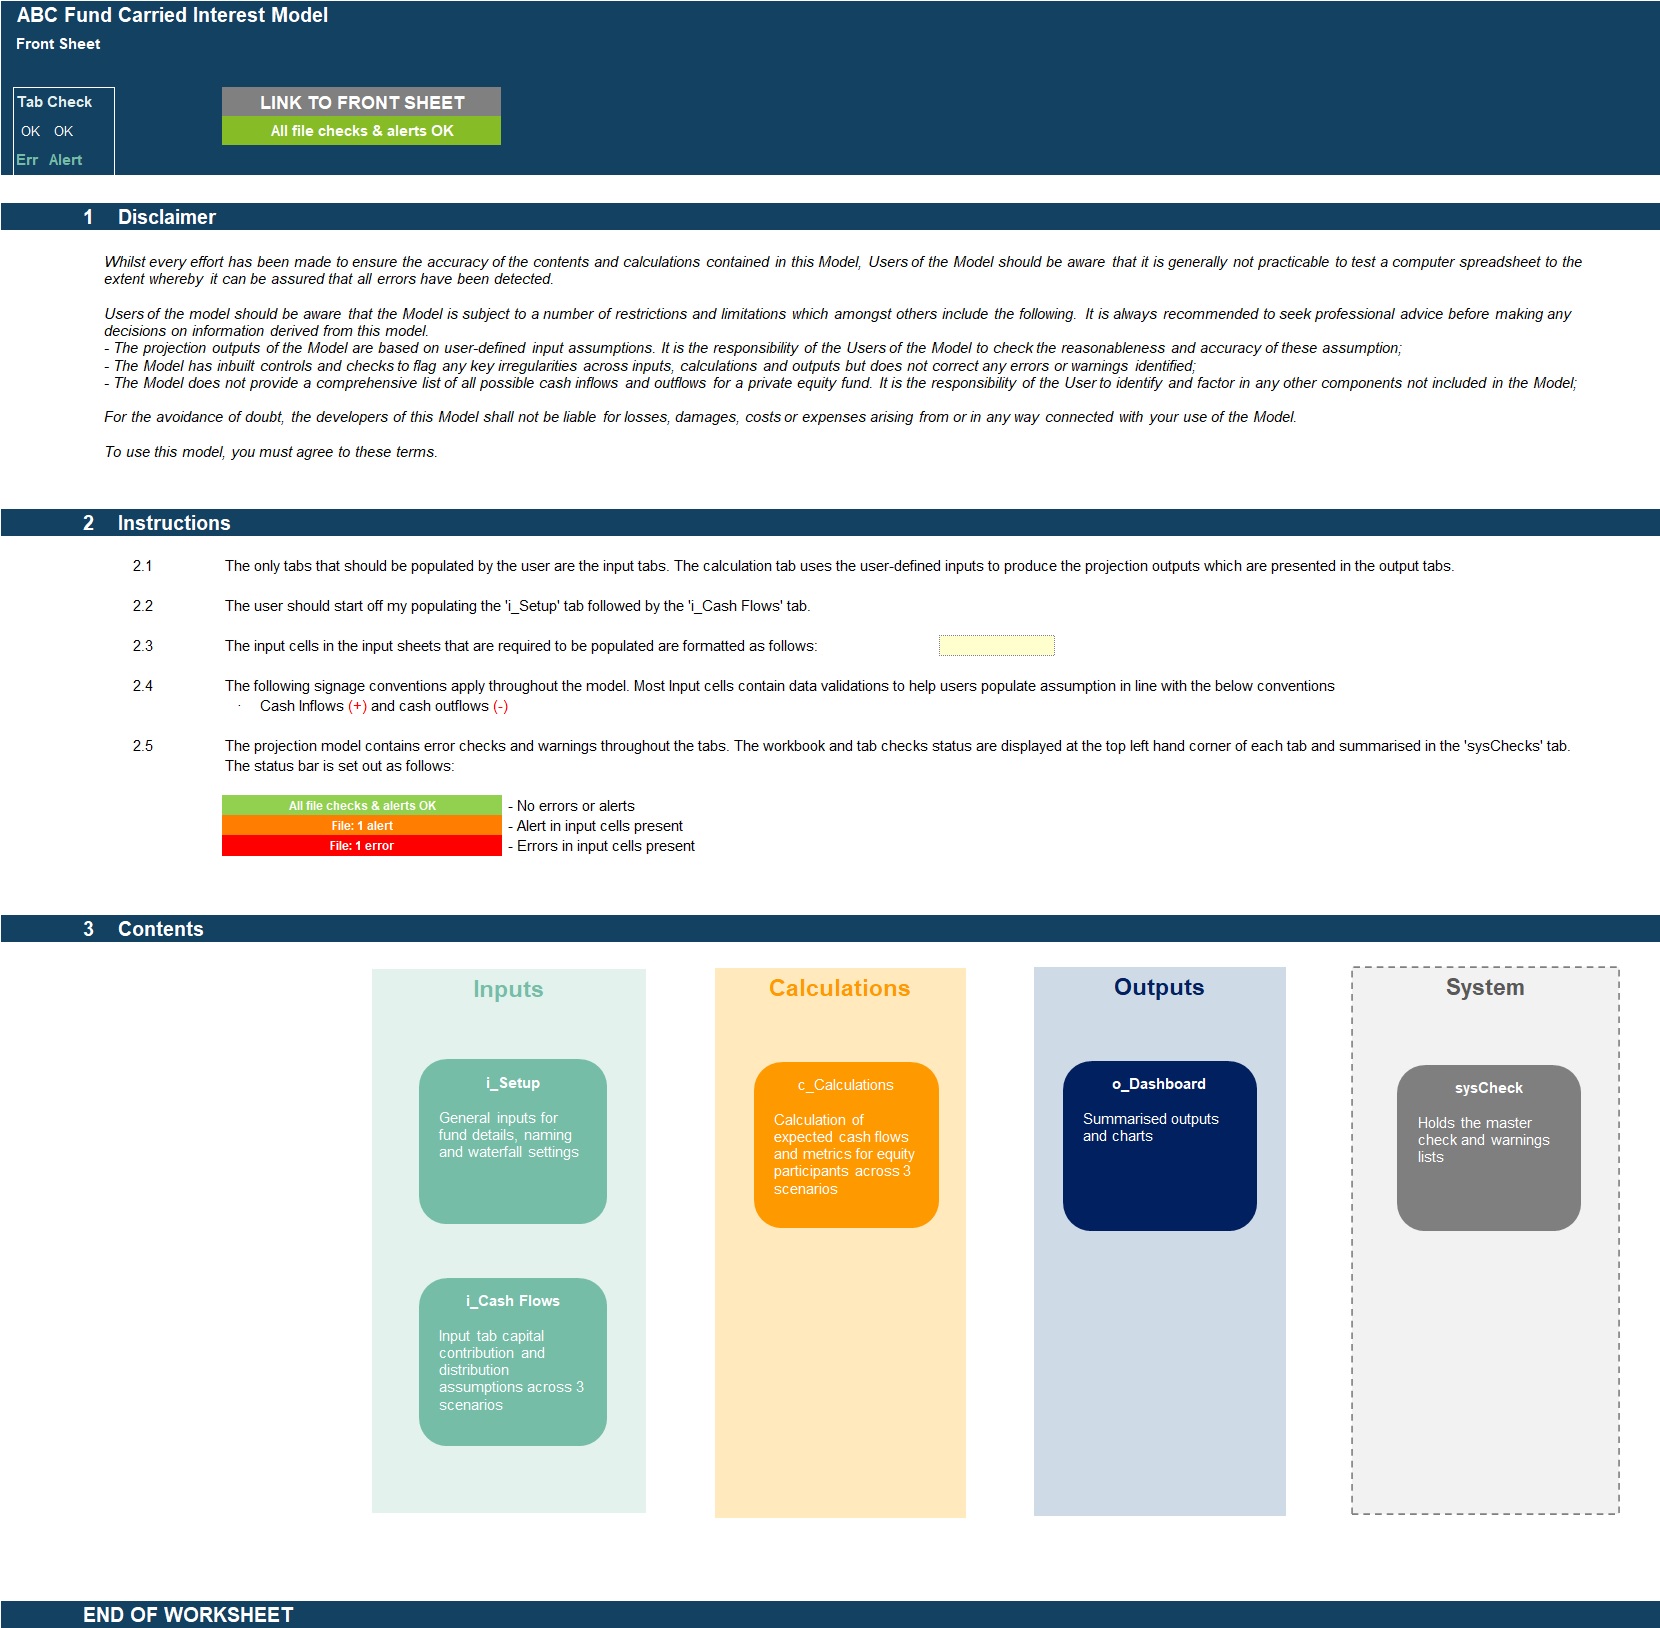
MODEL STRUCTURE
The model contains, 6 tabs split into input ('i_'), calculation ('c_'), output ('o_’) and system tabs. The tabs to be populated by the user are the input tabs ('i_Setup' and 'i_Cash flows'). The calculation tab uses the user-defined inputs to calculate and produce the cap table outputs which are presented in ‘o_Dashboard’
System tabs include:
- A 'Front Sheet' containing a disclaimer, instructions and contents;
- A Checks dashboard containing a summary of checks by tab.
KEY FEATURES
Other key features of this model include the following:
- The model follows best practice financial modelling guidelines and includes instructions, checks and input validations;
- The model is not password protected and can be modified as required following download;
- The model is screened using specialised model audit software to help ensure formula consistency and significantly reduce risk of errors;
- The model allows for the following number of underlying categories for each line item (these can be easily expanded if required):
o Scenarios – 3 scenarios;
o Underlying portfolio company investments – 10 companies
- Fund Name and currency are fully customisable
- The model includes instructions, checks and input validations to help ensure input fields are populated accurately
- The model includes a checks dashboard which summarises all the checks included in the various tabs making it easier to identify any errors.
MODIFICATIONS
If you require any be-spoke modifications to the tool, we are more than happy to assist with this. Please send us a private message
ABOUT PROJECTIFY
We are a small team of financial modelling professionals with experience working in big 4 business modelling teams and strong experience supporting businesses with their financial planning and decision support needs. Our aim is to provide robust and easy-to-use tools that follow good practice financial modelling guidelines and assist individuals and businesses with common financial planning and analysis processes.
We are keen to ensure our customers are satisfied with any tools / models purchased and happy to assist with any questions or support required following or in advance of purchase.
We are keen to receive feedback so please do let us know what you think of our models by sending us a message or submitting a review.
PURPOSE OF MODEL
User-friendly Excel model for calculating the distribution of funds between the Limited Partner (‘LP’) and General Partner (‘GP’) for a private equity investment or fund.
The model is flexible allowing the user to input up to 10 different underlying portfolio company investments within the fund with their individual capital contributions and distributions across a 10 year quarterly timeline with 3 scenarios. The cash flow and waterfall assumptions include equity contribution splits, LP hurdle rates, GP catch up provisions, GP carried interest, GP management fee and fund operating expenses.
The model follows best practice financial modelling principles and includes instructions, checks and input validations.
KEY OUTPUTS
The model is generic and not industry-specific. The key outputs presented in both table and chart format include:
- Waterfall of fund distributions
- IRR on total fund basis and for GP and LP
- IRR and net cash flows by portfolio company
- Multiples of invested capital
KEY INPUTS
Inputs are split into setup inputs and cash flow inputs. All inputs include user-friendly input validations to help users populate correctly.
Setup inputs include:
- Fund name
- Names of underlying investments
- Fund starting and ending quarter
- Total fund amount
- Currency
- Waterfall assumptions including LP hurdle rate, equity contribution percentages, GP carried interest, GP catch up clause, GP management fee, Fund operating expenses
- Scenario naming
Cash Flow inputs include:
- Fund Capital contribution deployment percentage by period.- Investment amounts by underlying portfolio company and scenario
- Distribution amounts by underlying portfolio company and scenario
- Fund distributions by scenario
- Fund operating expense cash flows
MODEL STRUCTURE
The model contains, 6 tabs split into input ('i_'), calculation ('c_'), output ('o_’) and system tabs. The tabs to be populated by the user are the input tabs ('i_Setup' and 'i_Cash flows'). The calculation tab uses the user-defined inputs to calculate and produce the cap table outputs which are presented in ‘o_Dashboard’
System tabs include:
- A 'Front Sheet' containing a disclaimer, instructions and contents;
- A Checks dashboard containing a summary of checks by tab.
KEY FEATURES
Other key features of this model include the following:
- The model follows best practice financial modelling guidelines and includes instructions, checks and input validations;
- The model is not password protected and can be modified as required following download;
- The model is screened using specialised model audit software to help ensure formula consistency and significantly reduce risk of errors;
- The model allows for the following number of underlying categories for each line item (these can be easily expanded if required):
o Scenarios – 3 scenarios;
o Underlying portfolio company investments – 10 companies
- Fund Name and currency are fully customisable
- The model includes instructions, checks and input validations to help ensure input fields are populated accurately
- The model includes a checks dashboard which summarises all the checks included in the various tabs making it easier to identify any errors.
MODIFICATIONS
If you require any be-spoke modifications to the tool, we are more than happy to assist with this. Please send us a private message
ABOUT PROJECTIFY
We are a small team of financial modelling professionals with experience working in big 4 business modelling teams and strong experience supporting businesses with their financial planning and decision support needs. Our aim is to provide robust and easy-to-use tools that follow good practice financial modelling guidelines and assist individuals and businesses with common financial planning and analysis processes.
We are keen to ensure our customers are satisfied with any tools / models purchased and happy to assist with any questions or support required following or in advance of purchase.
We are keen to receive feedback so please do let us know what you think of our models by sending us a message or submitting a review.
This Best Practice includes
1 Blank Excel Model and 1 Excel Model with Populated Example
Further information
Excel model for calculating the distribution of funds between the Limited Partner (‘LP’) and General Partner (‘GP’) for a PE fund
