Originally published: 12/06/2020 06:46
Publication number: ELQ-40810-1
View all versions & Certificate
Publication number: ELQ-40810-1
View all versions & Certificate

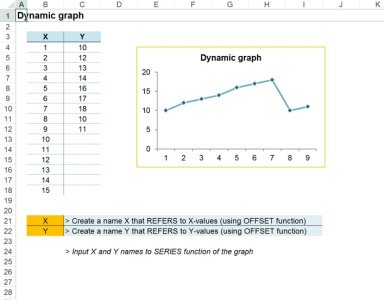
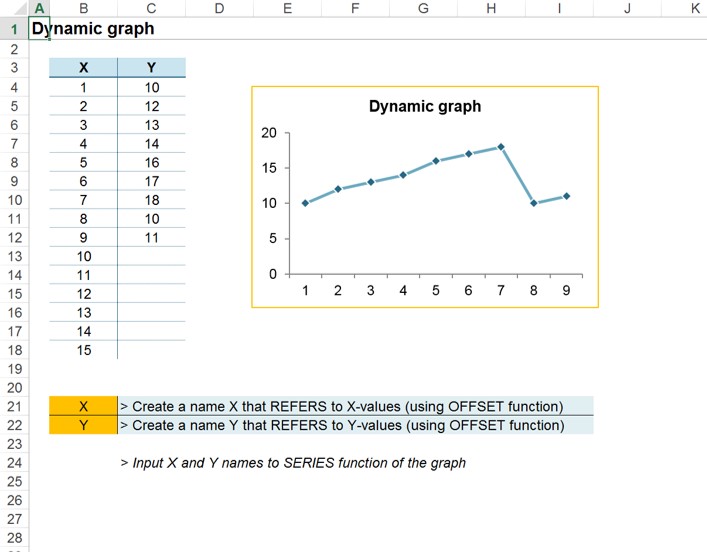
Dynamic Excel Chart example
This is a simple example of a dynamic graph for excel
Useful, clever and interesting excel tools, templates and models particularly catered for management consultantsFollow
