
Originally published: 31/03/2025 07:12
Publication number: ELQ-11367-1
View all versions & Certificate
Publication number: ELQ-11367-1
View all versions & Certificate

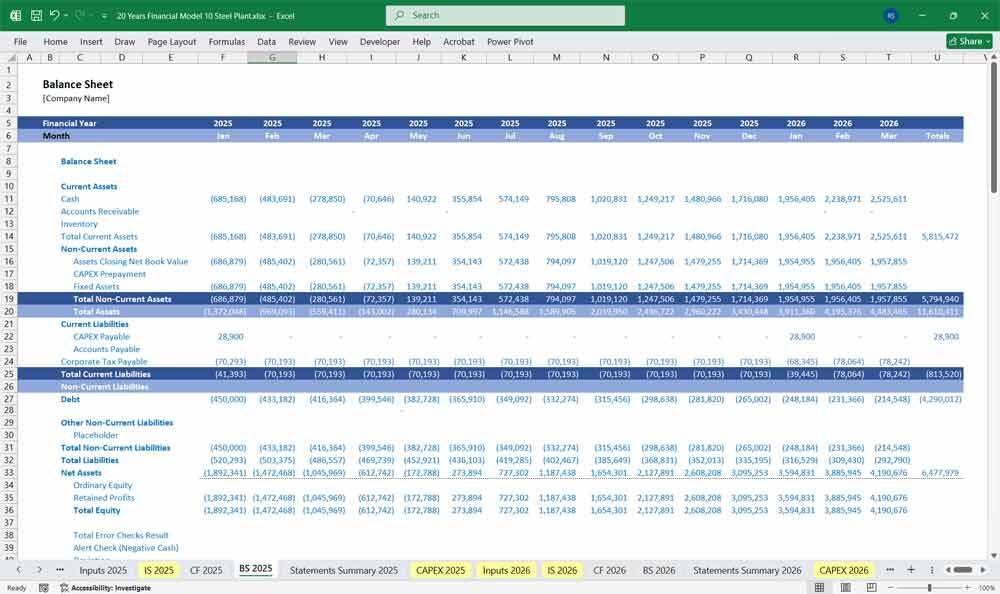
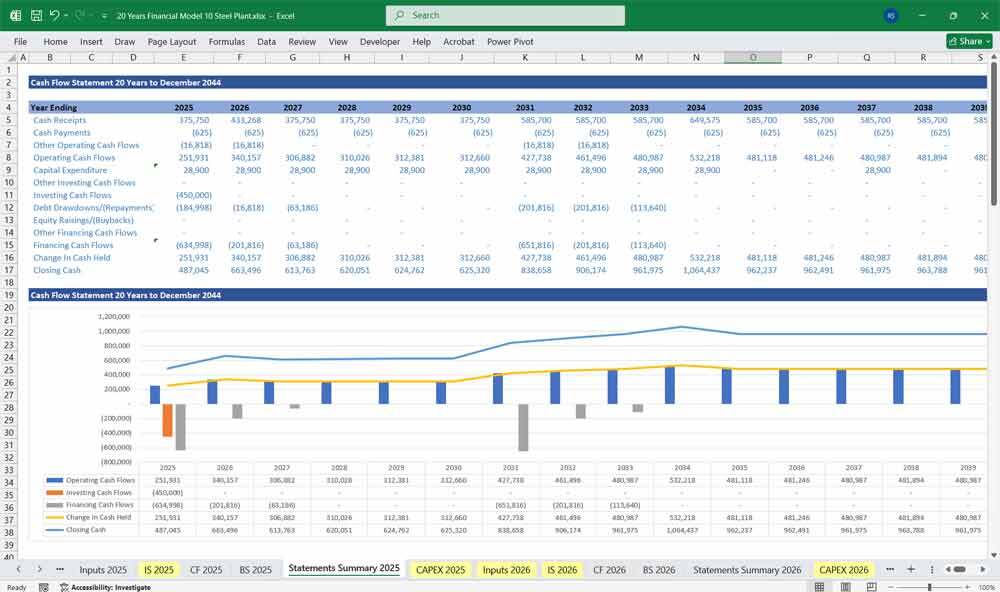
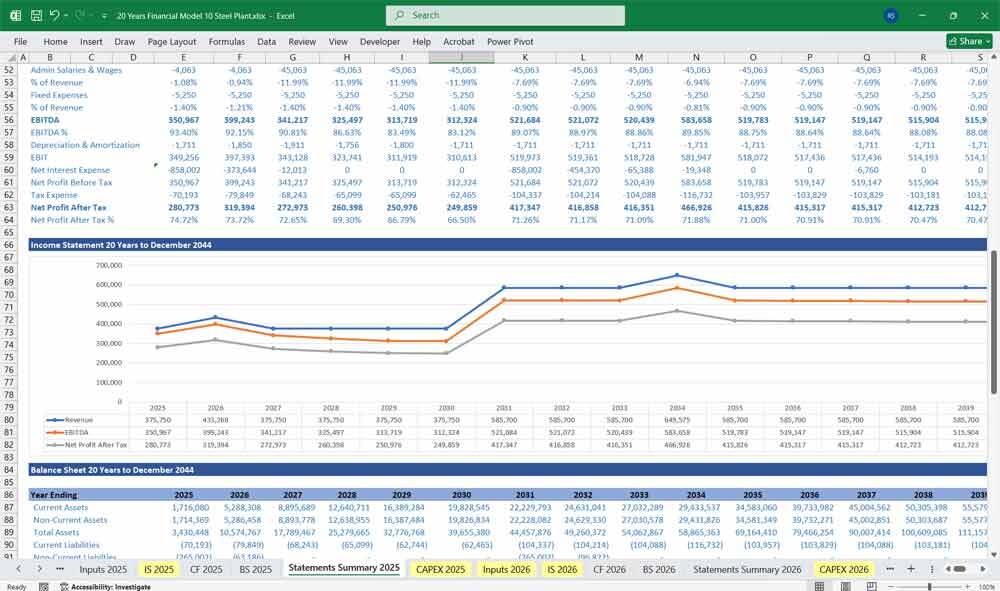
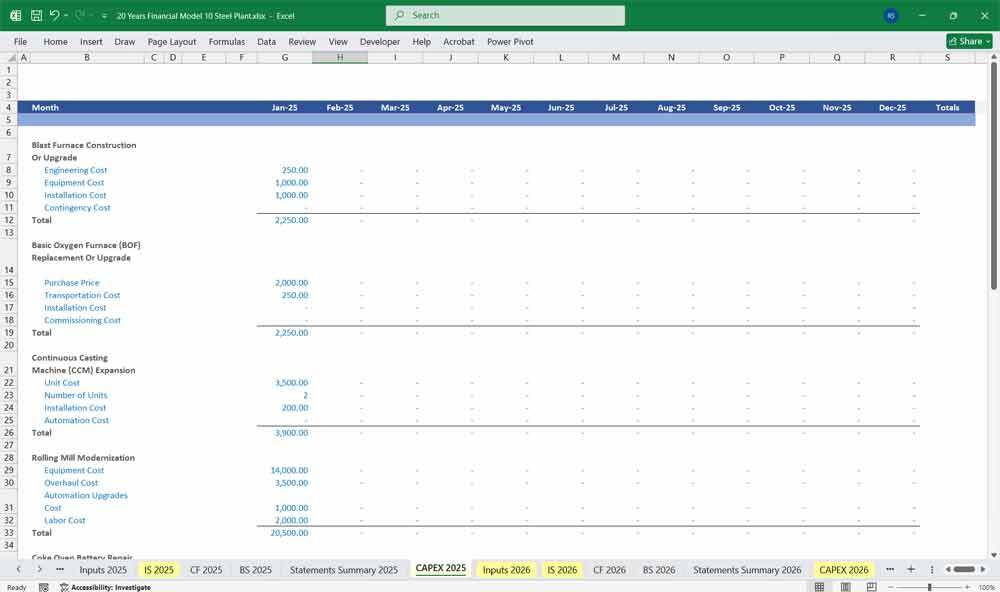
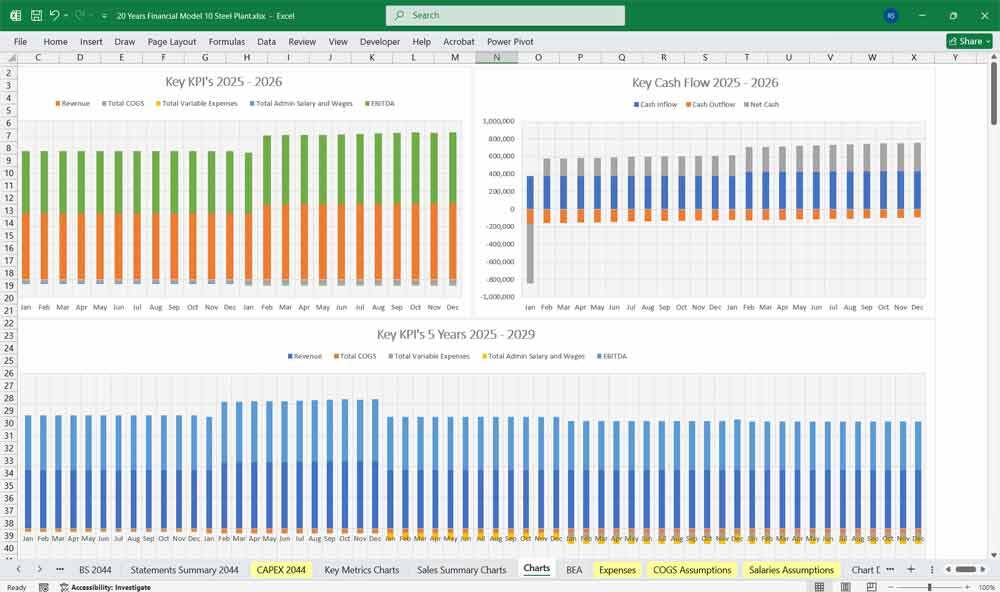
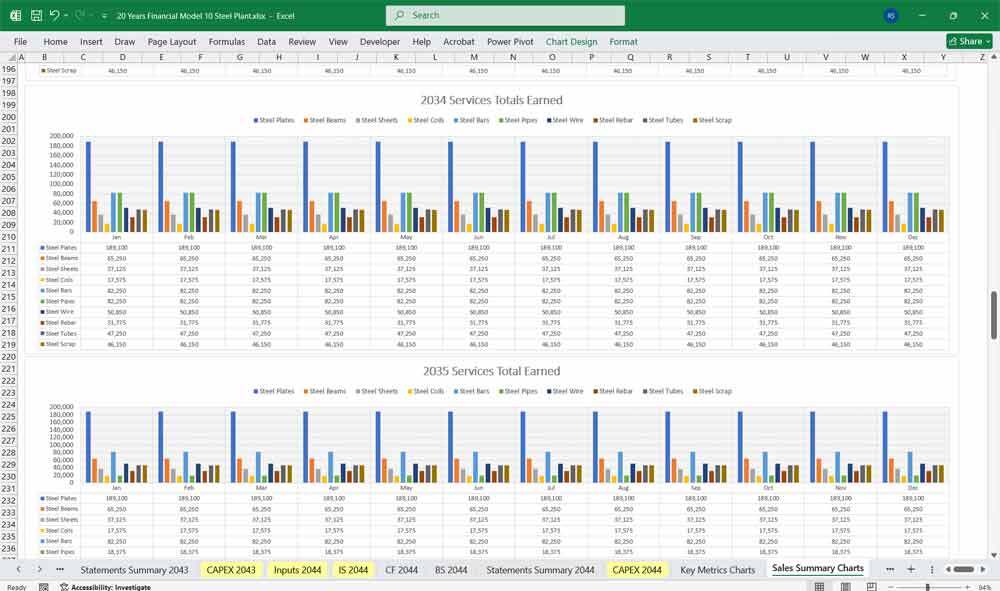
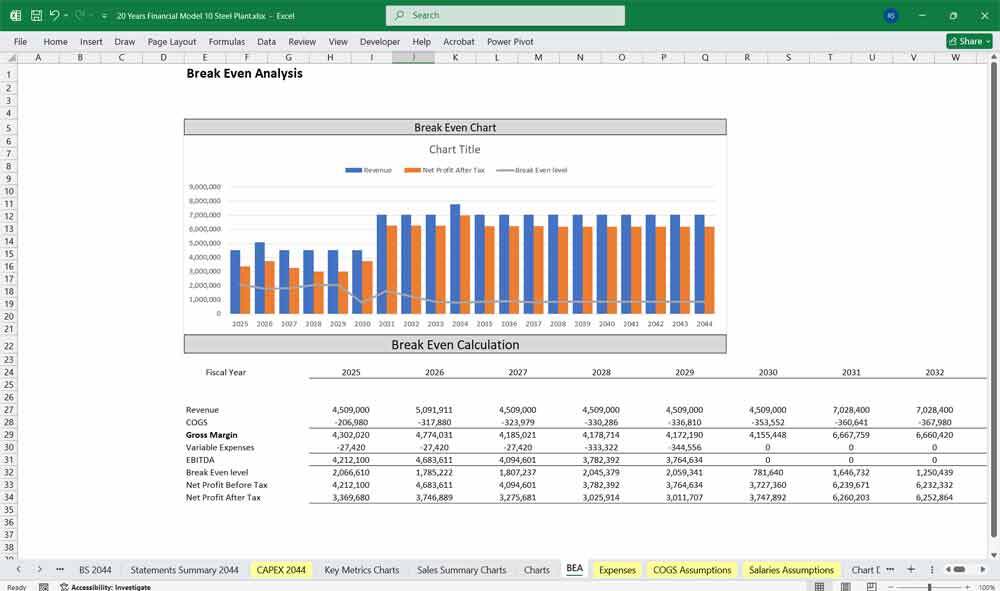
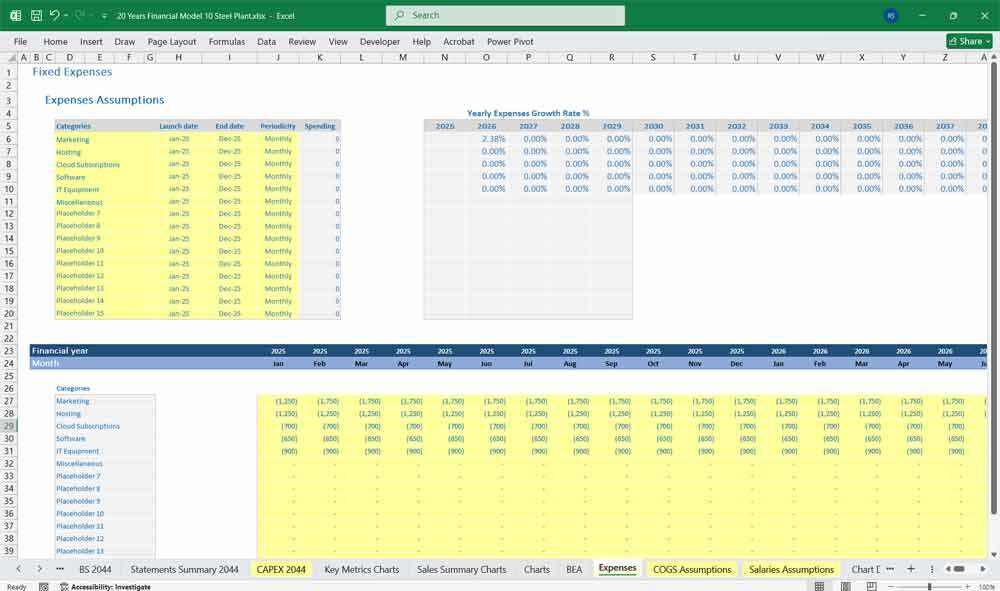
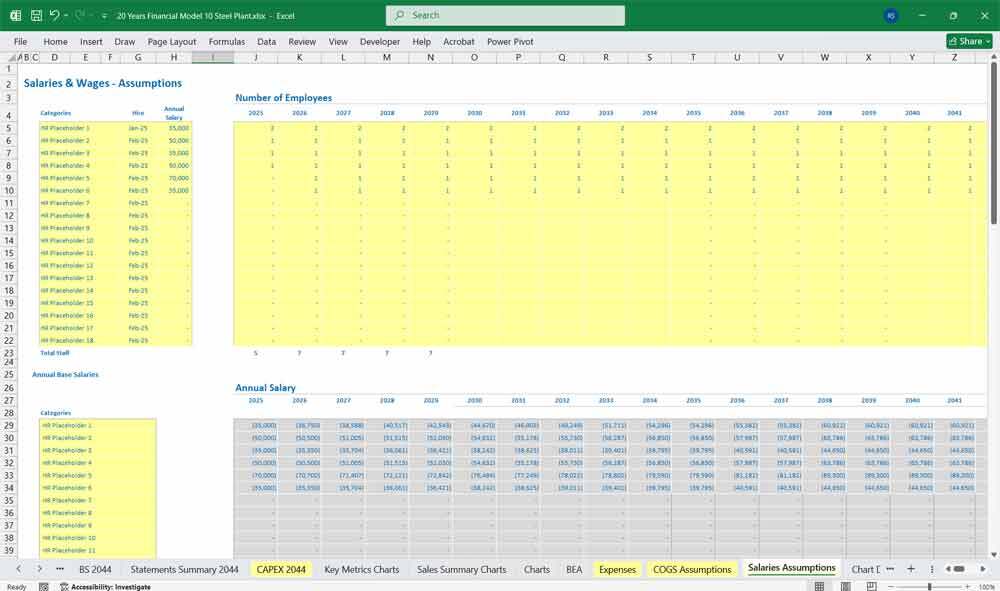
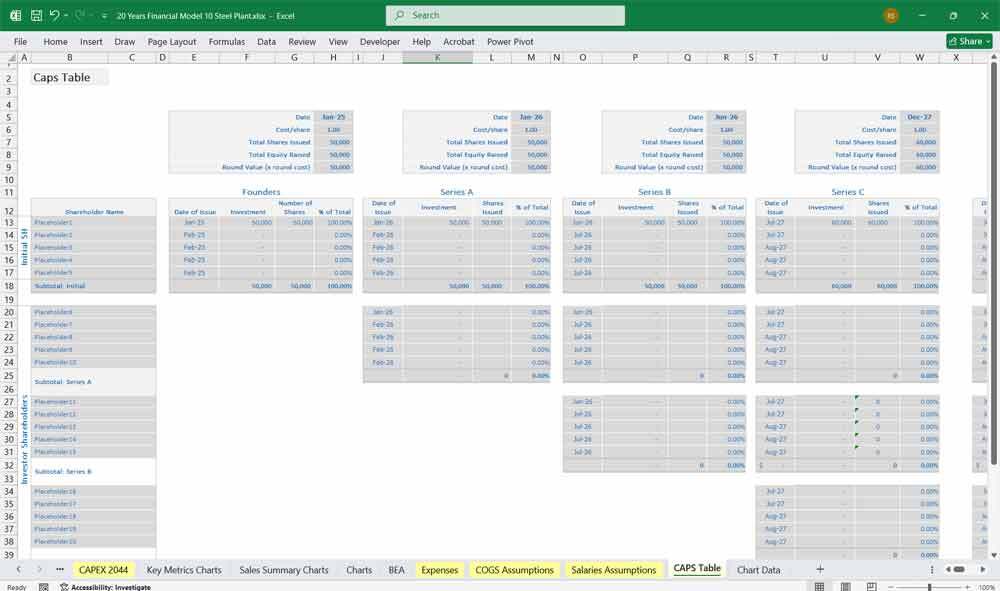
Steel Plant Financial Model 20 Year 3 Statement
Very comprehensive 20-year 3 statement model for a steel manufacturer

At Wilcox PMO we also provide CFO Services, planning and analysis to help companies in interpreting financial statements.Follow
steelsteel plantsteel plant manufacturerfinancialfinancial modelfinancial templatesteel productionexcelsteel manufacturerexcel template
Description
Revenue ProjectionsA. Production & Sales
CAPEX: Blast Furnace Upgrade or Construction, Basic Oxygen Furnace replacement, Casting Machine Expansion, Roll Mill Modernization, detailed monthly financial tracking.
Income Statement
Cash Flow Statement
Operating Activities
Balance Sheet
Assets
Sensitivity & Scenario Analysis
Revenue ProjectionsA. Production & Sales
- Annual Production Capacity: Estimated in metric tons.
- Utilization Rate: Expected plant efficiency.
- Sales Price per Ton: Based on market trends.
- Total Revenue Calculation:
- Additional Revenue Streams:
- By-products (slag, gases, etc.)
- Scrap metal sales
- Export incentives & subsidies (if applicable)
- By-products (slag, gases, etc.)
- Raw Material Costs
- Iron Ore
- Coal
- Scrap Metal
- Gas
- Iron Ore
- Energy Costs
- Electricity
- Gas & Fuel
CAPEX: Blast Furnace Upgrade or Construction, Basic Oxygen Furnace replacement, Casting Machine Expansion, Roll Mill Modernization, detailed monthly financial tracking.
Income Statement
- Revenue
- (-) Cost of Goods Sold
- Gross Profit
- (-) Operating Expenses
- EBITDA (Earnings Before Interest, Taxes, Depreciation, and Amortization)
- (-) Depreciation & Amortization
- EBIT (Operating Profit)
- (-) Interest Expense
- EBT (Earnings Before Tax)
- (-) Tax Expense
- Net Profit
- Gross Margin (%) = (Gross Profit / Revenue) * 100
- EBITDA Margin (%) = (EBITDA / Revenue) * 100
- Net Profit Margin (%) = (Net Profit / Revenue) * 100
Cash Flow Statement
Operating Activities
- Net Profit
- Add: Non-Cash Items (Depreciation, Amortization)
- Add: Changes in Working Capital
- Inventory Changes
- Accounts Receivable/Payable Fluctuations
- Inventory Changes
- Capital Expenditures (CapEx)
- Investments in R&D, Joint Ventures
- Debt Financing (Loans, Bond Issuance)
- Equity Financing (Investor Funding, Share Issuance)
- Repayment of Debt & Interest
- Dividend Payments
- Free Cash Flow (FCF) = Operating Cash Flow - CapEx
- Debt Service Coverage Ratio (DSCR) = EBITDA / (Interest + Debt Repayment)
Balance Sheet
Assets
- Fixed Assets (PPE - Property, Plant, Equipment)
- (-) Accumulated Depreciation
- Net Fixed Assets
- Current Assets
- Inventory
- Accounts Receivable
- Cash & Equivalents
- Inventory
- Equity
- Share Capital
- Retained Earnings
- Share Capital
- Debt (Long-Term & Short-Term)
- Current Liabilities
- Accounts Payable
- Short-Term Loans
- Accounts Payable
- Current Ratio = Current Assets / Current Liabilities
- Debt-to-Equity Ratio = Total Debt / Total Equity
- Return on Assets (ROA) = Net Profit / Total Assets
Sensitivity & Scenario Analysis
- Impact of Raw Material Price Fluctuations
- Steel Price Variability & Market Demand
- Interest Rate Changes on Debt Servicing
- Impact of ESG Regulations & Carbon Credits
This Best Practice includes
1 Excel Financial Model
Further information
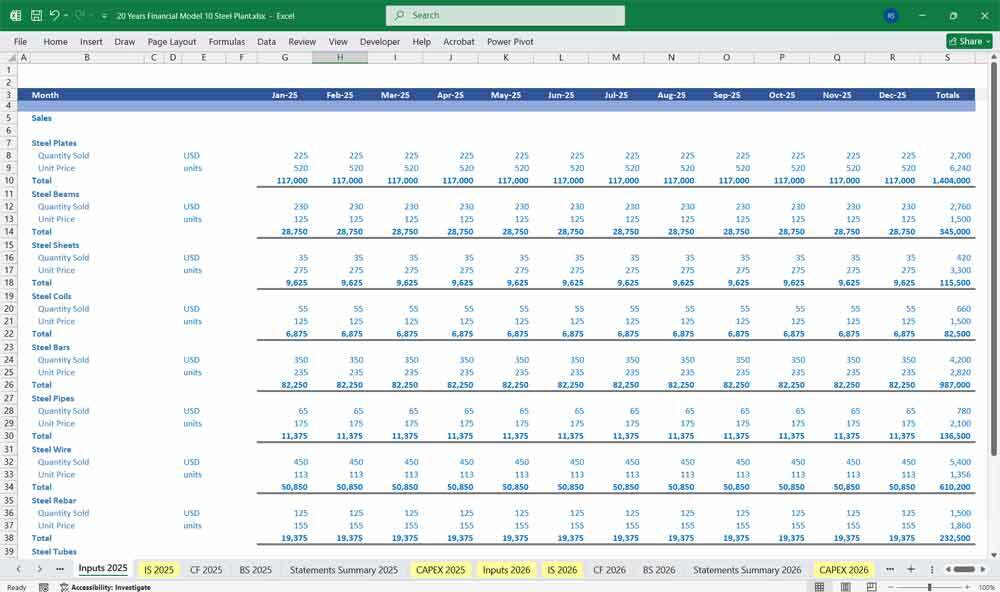
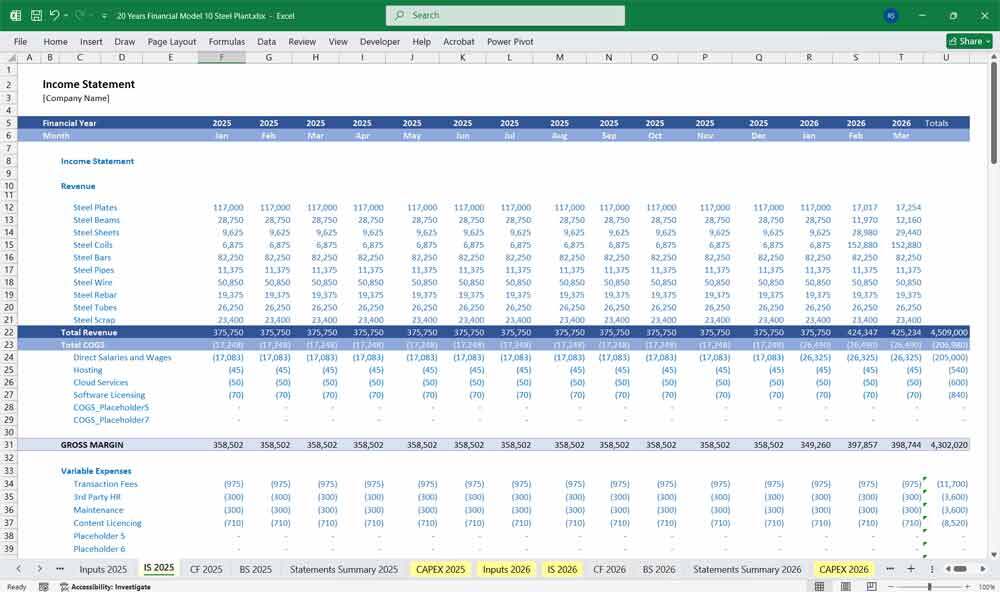
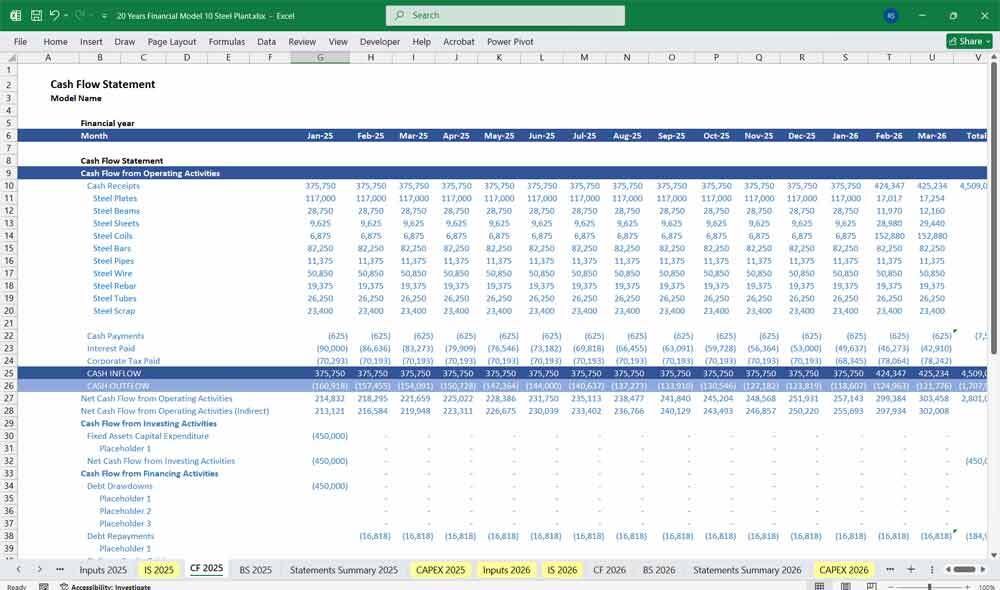
Provides thorough oversight, tracking, and reporting of a Steel Plant's finances, including updates on budget utilisation and projections.