






Loan Securitization Model: A Template for Multi-Tranche Structures, Coverage Metrics, and Sensitivity Analysis
Originally published: 10/03/2025 09:04
Last version published: 09/10/2025 08:00
Publication number: ELQ-84080-2
View all versions & Certificate
certified

Loan Securitization Model: A Template for Multi-Tranche Structures, Coverage Metrics, and Sensitivity Analysis

A tool used to analyze loan securitization offerings from the view of the notes, Special Purpose Vehicle (SPV), and equity leg if applicable.

Description
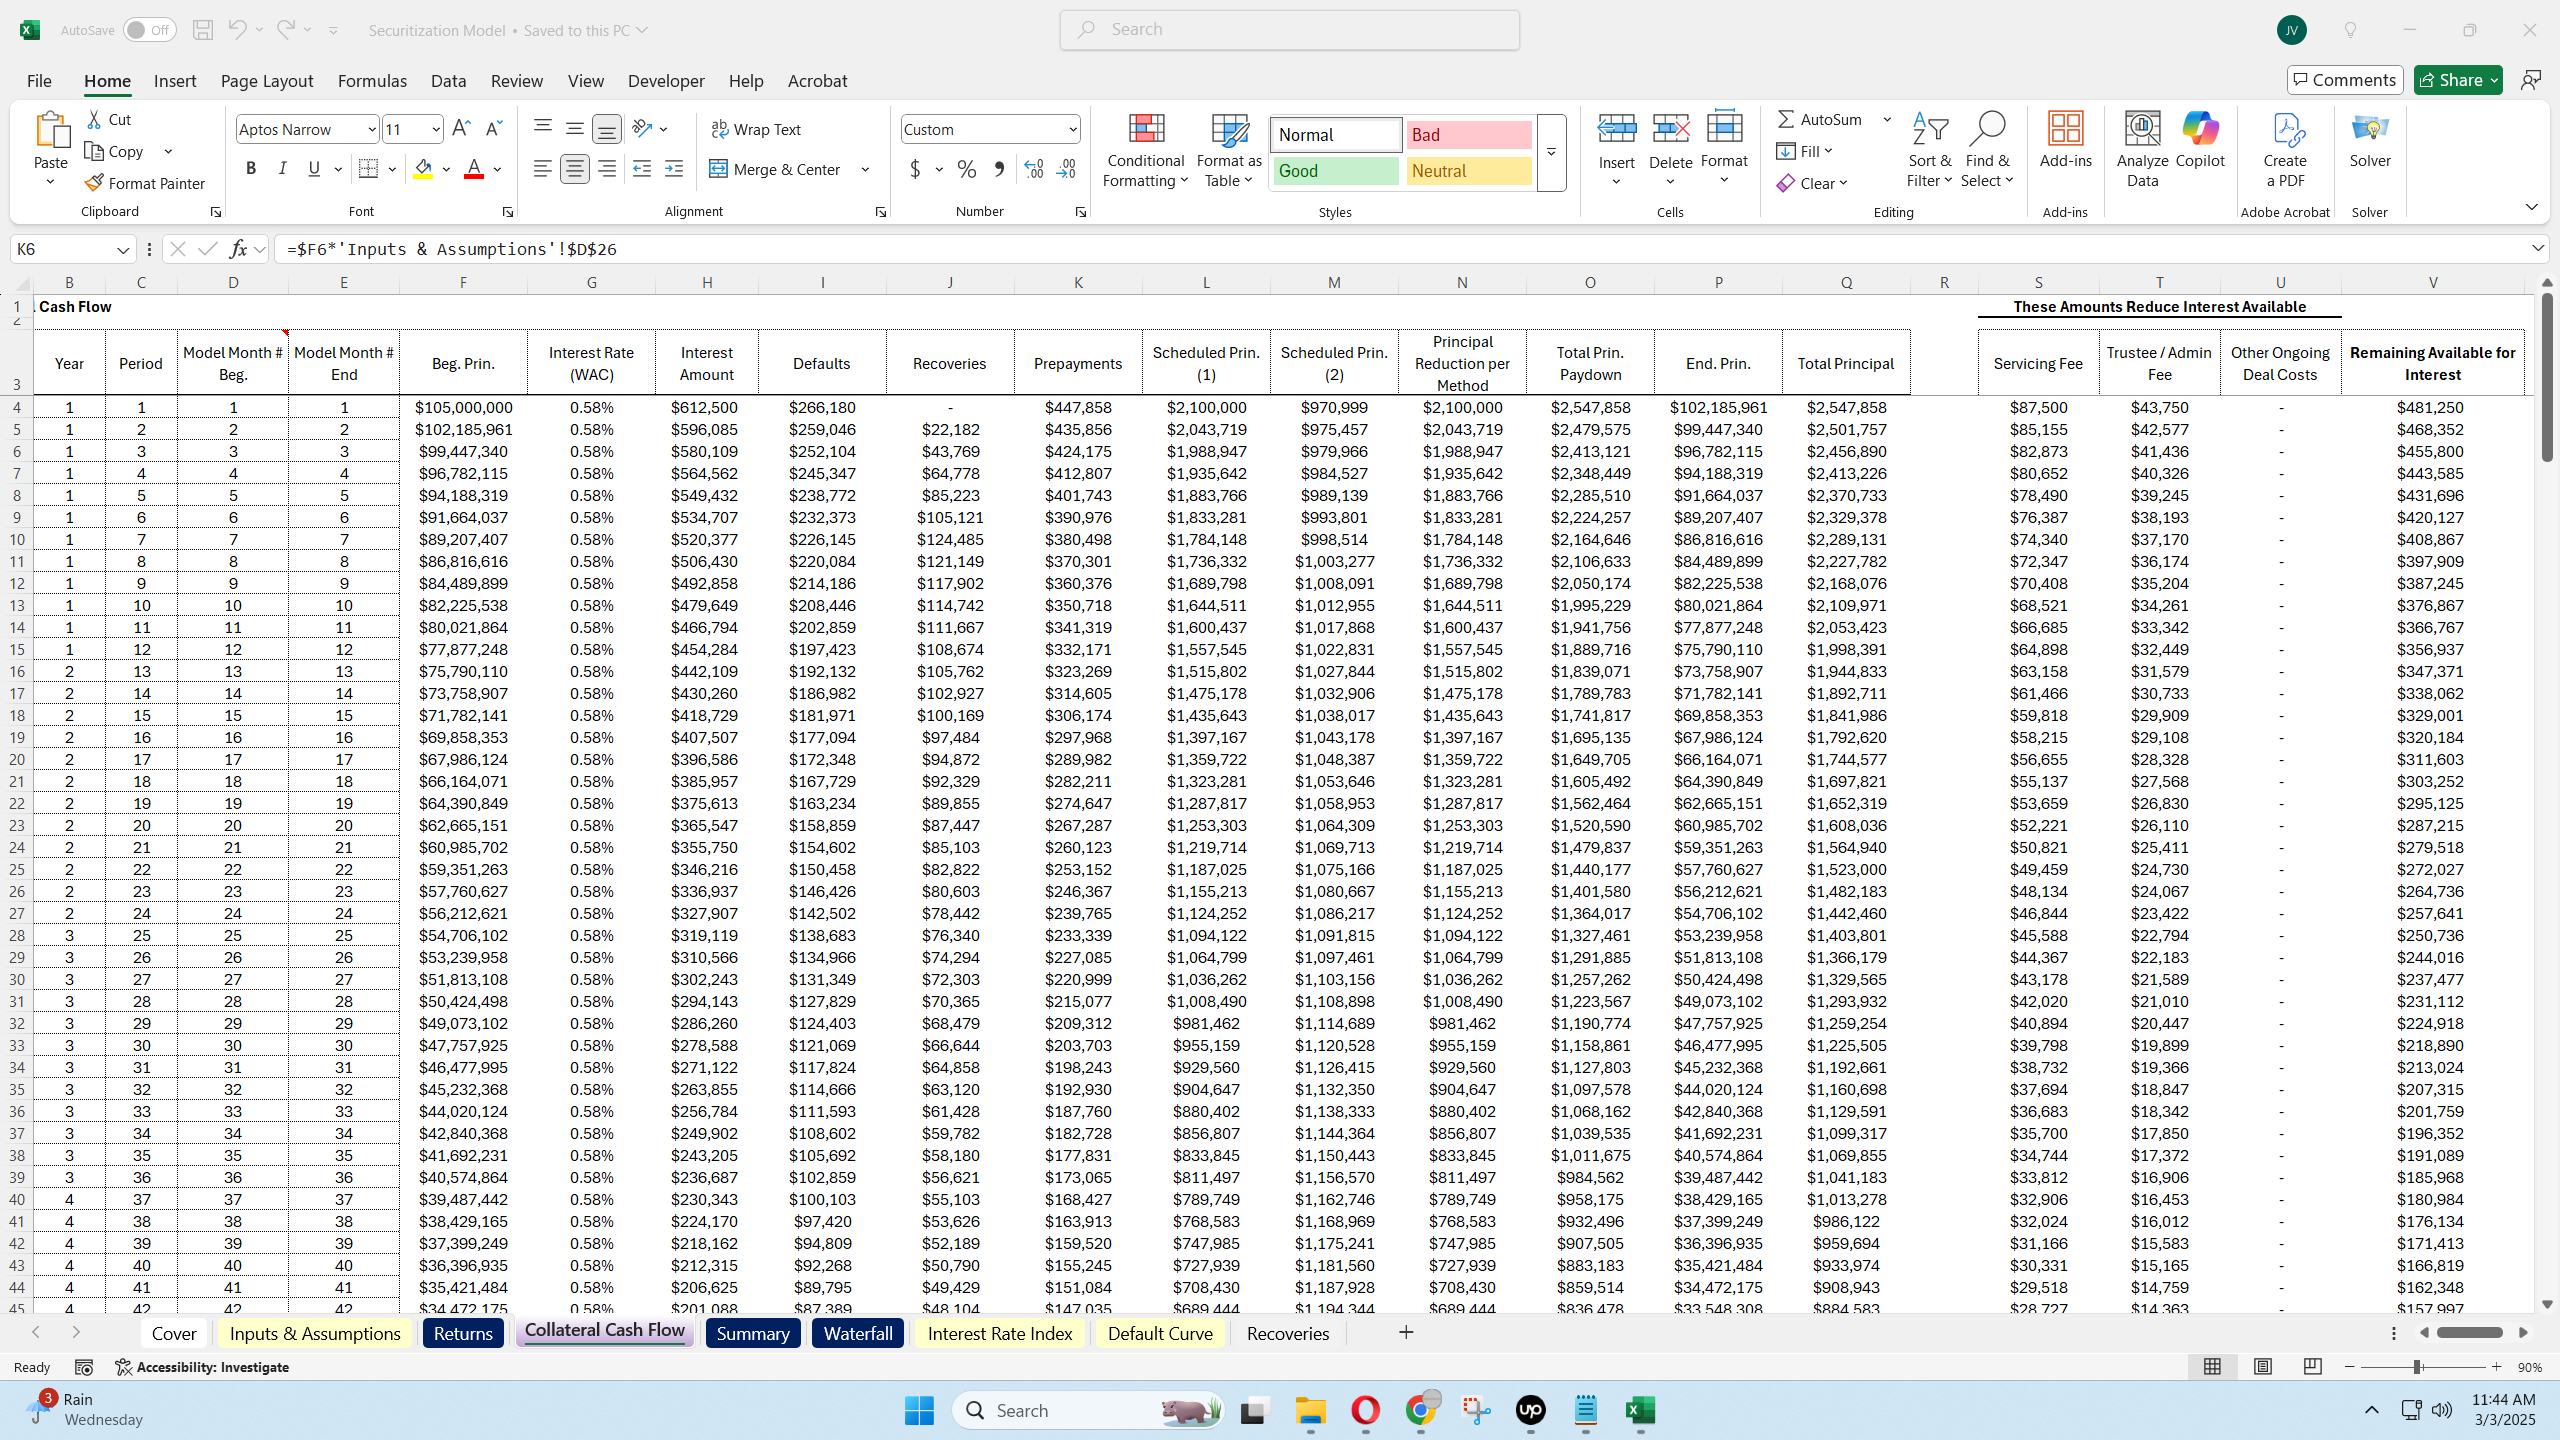
Flexible Default & Principal Schedules

  • Annualized or periodic default assumptions

  • Choice of proportional principal payment or Excel PPMT-based repayment

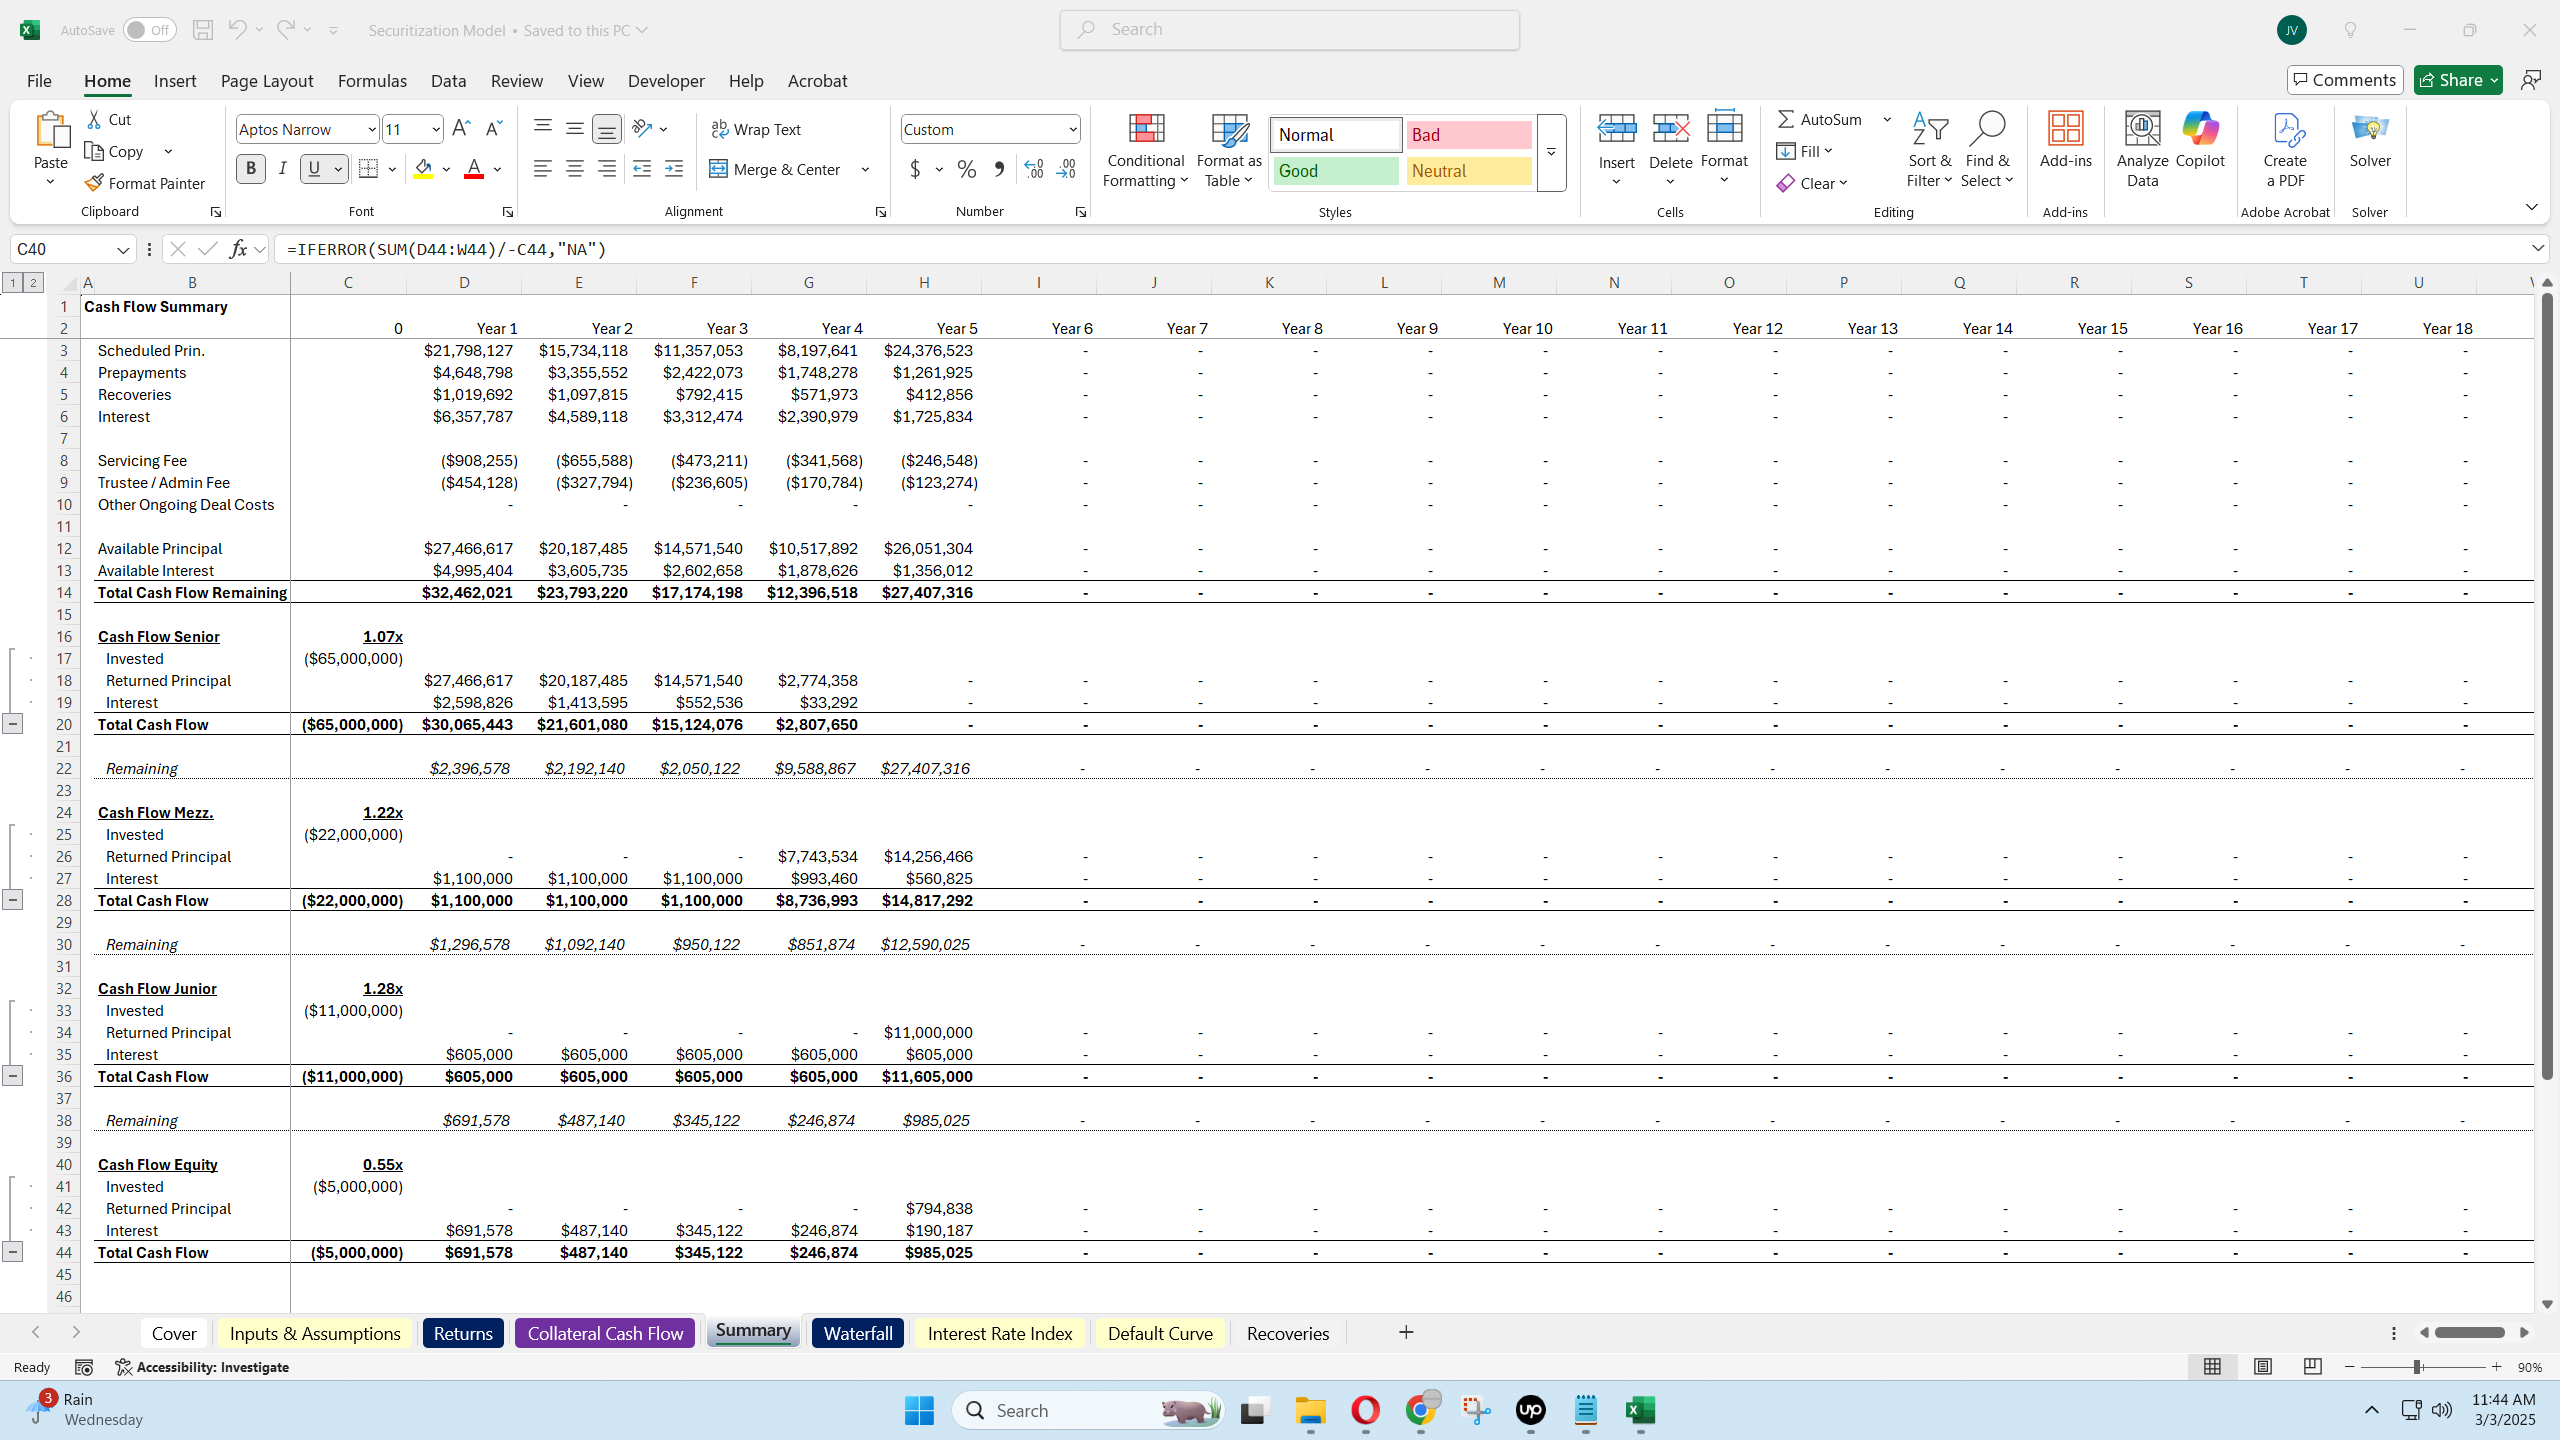
Up to Three Loan Offerings + Equity Tranche

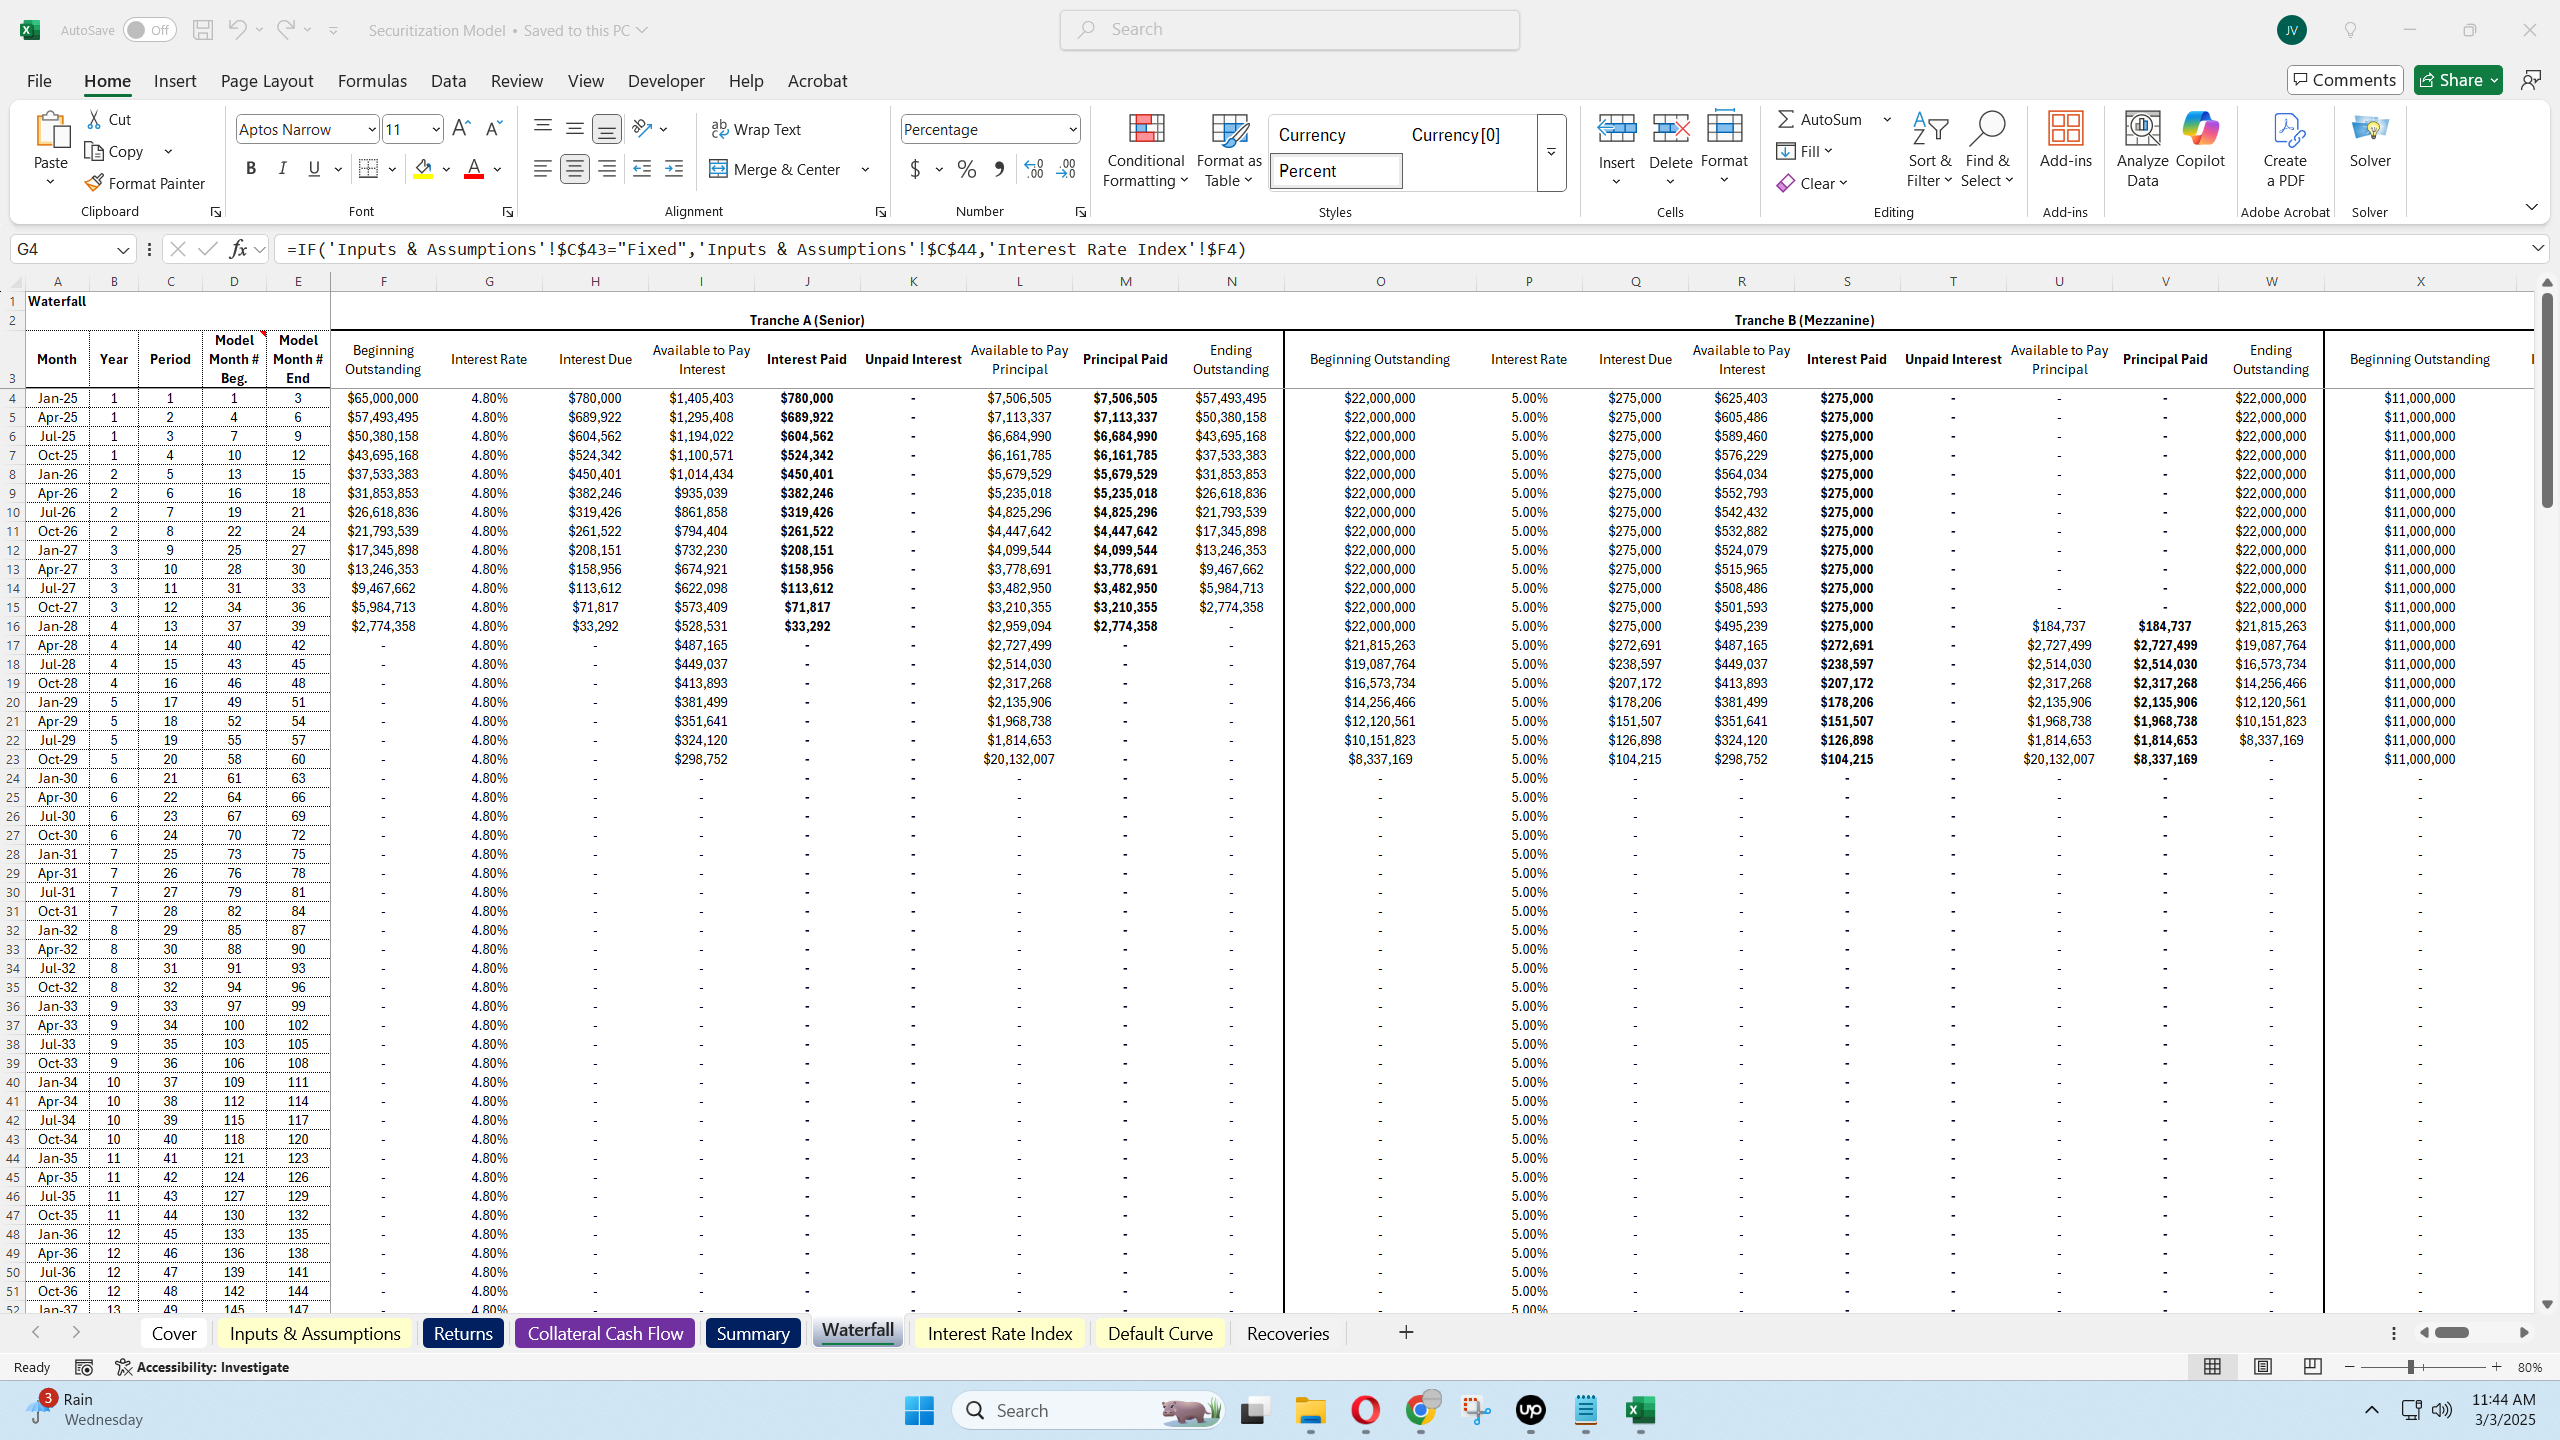
  • Senior, Mezzanine, and Junior notes

  • Equity tranche receives residual cash flows

Long-Term Modeling

  • Supports time horizons up to 240 months

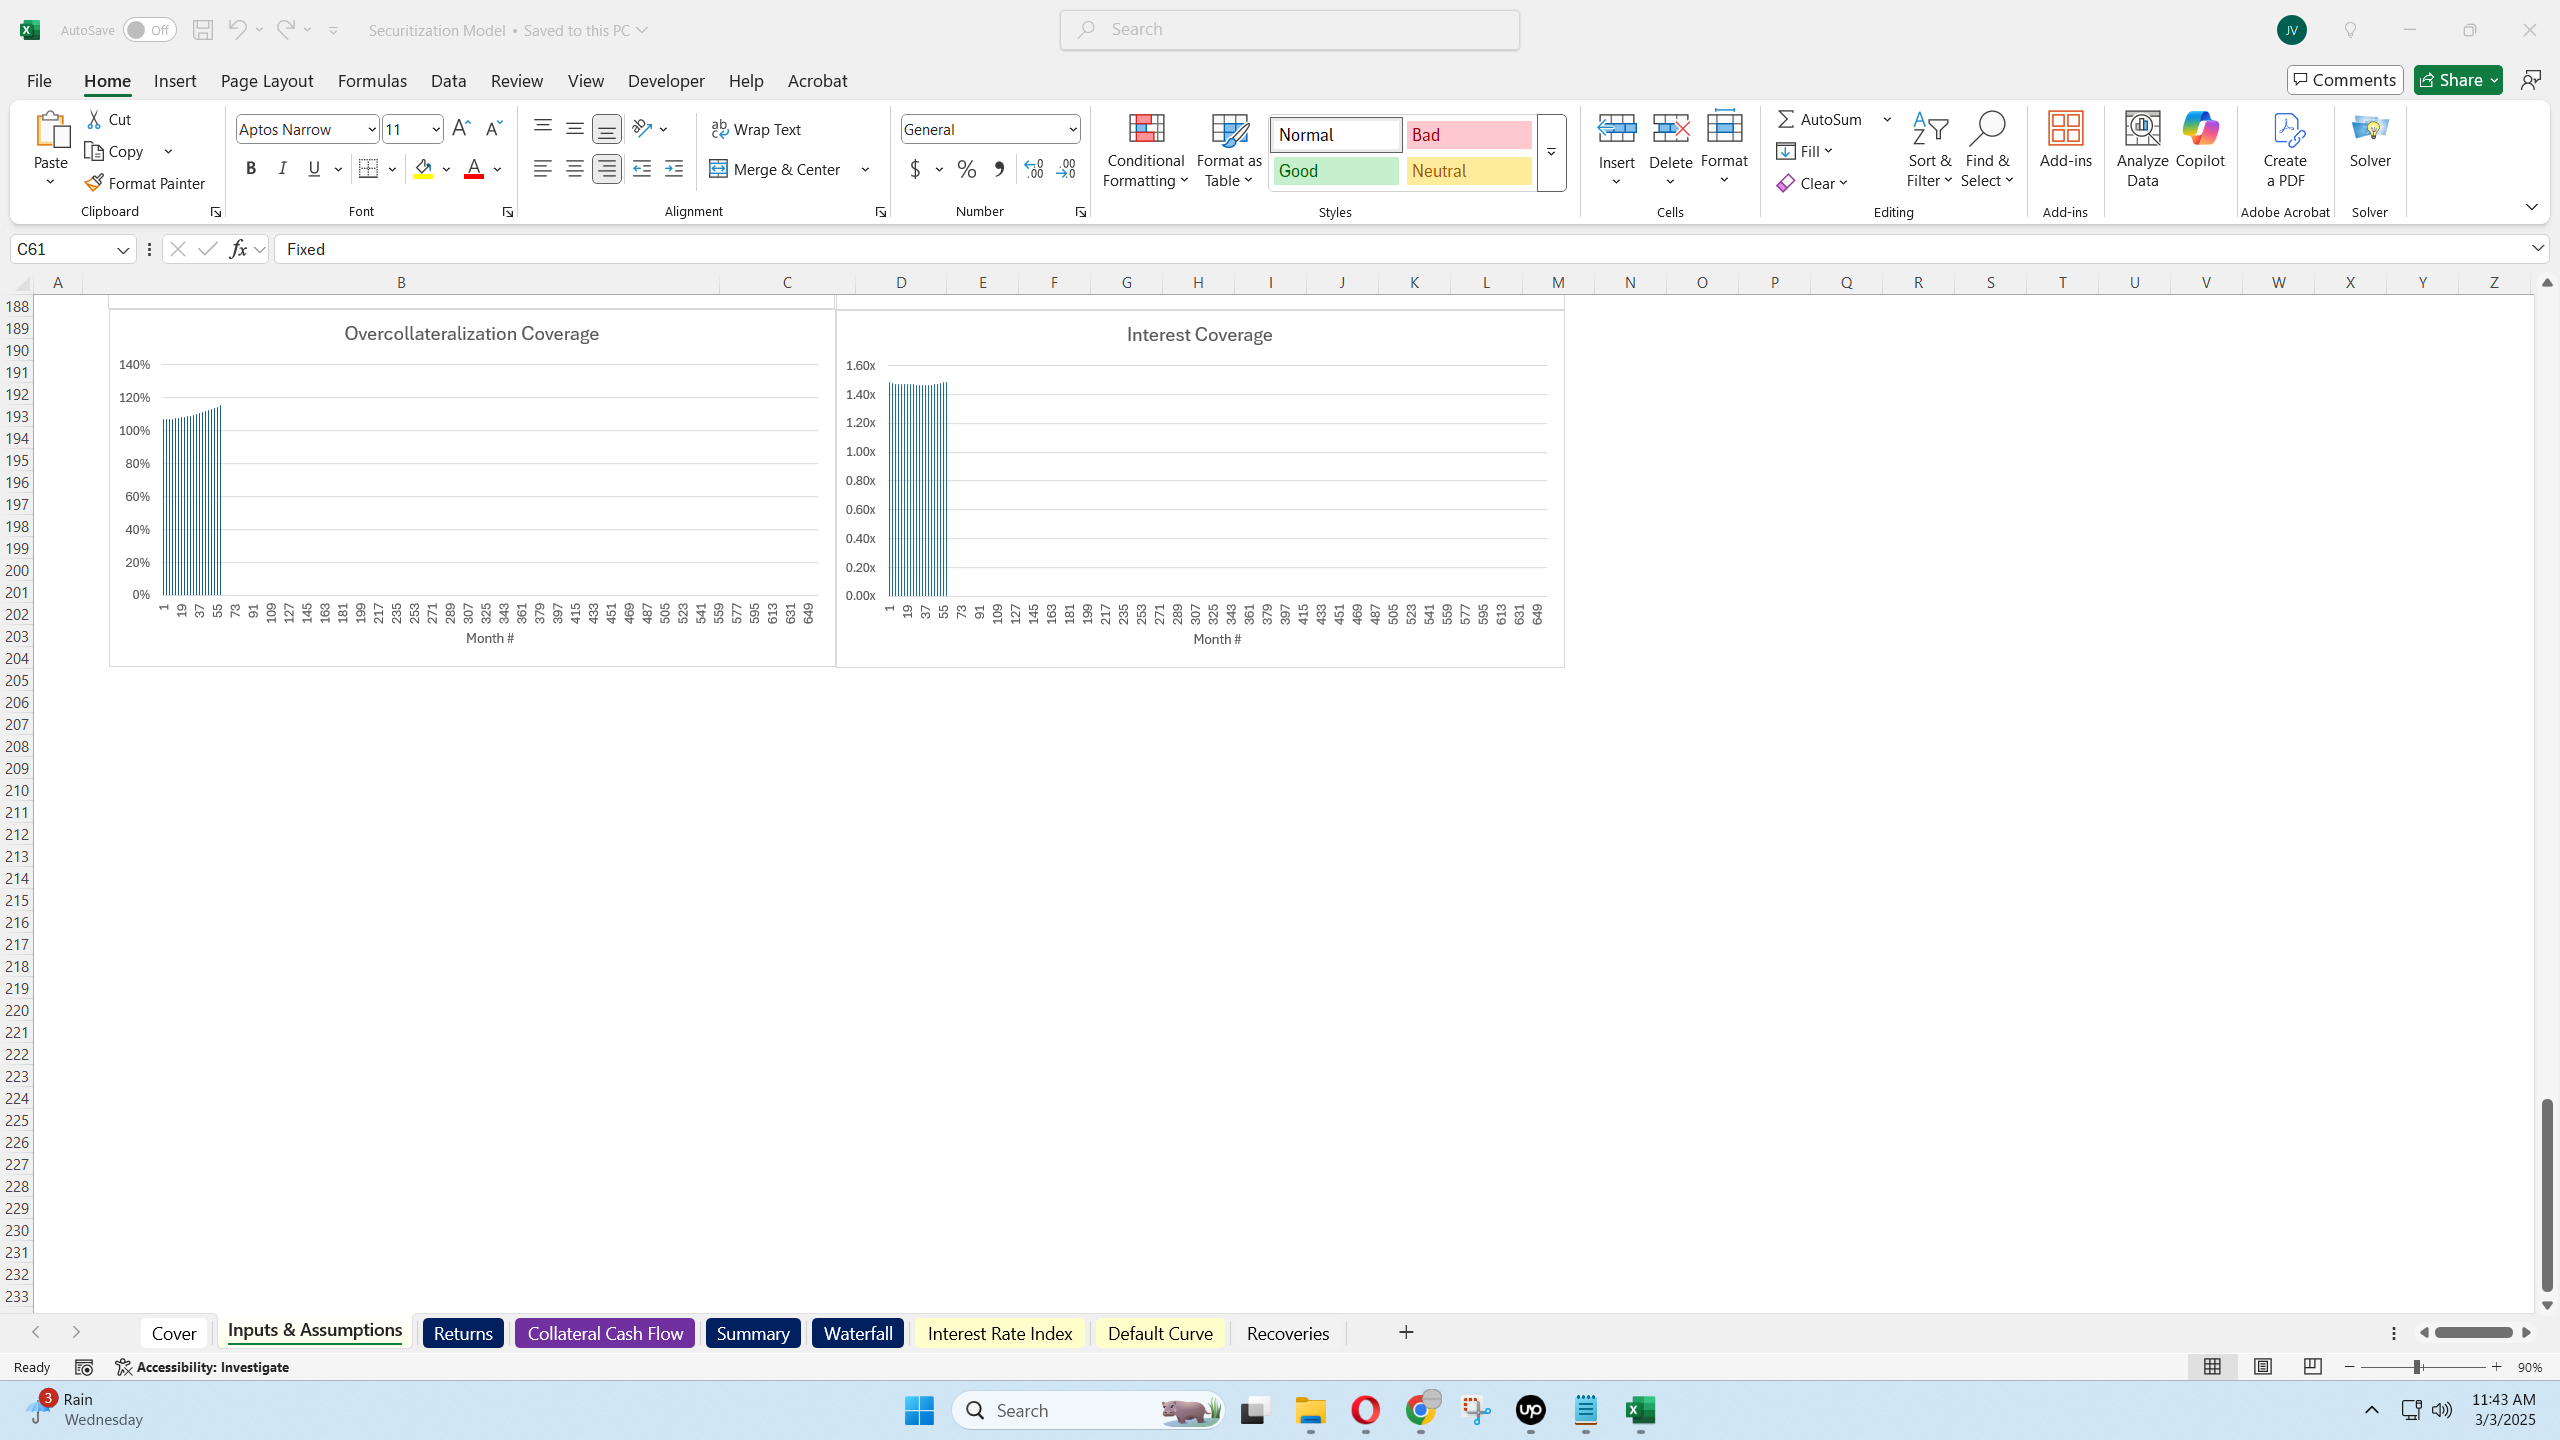
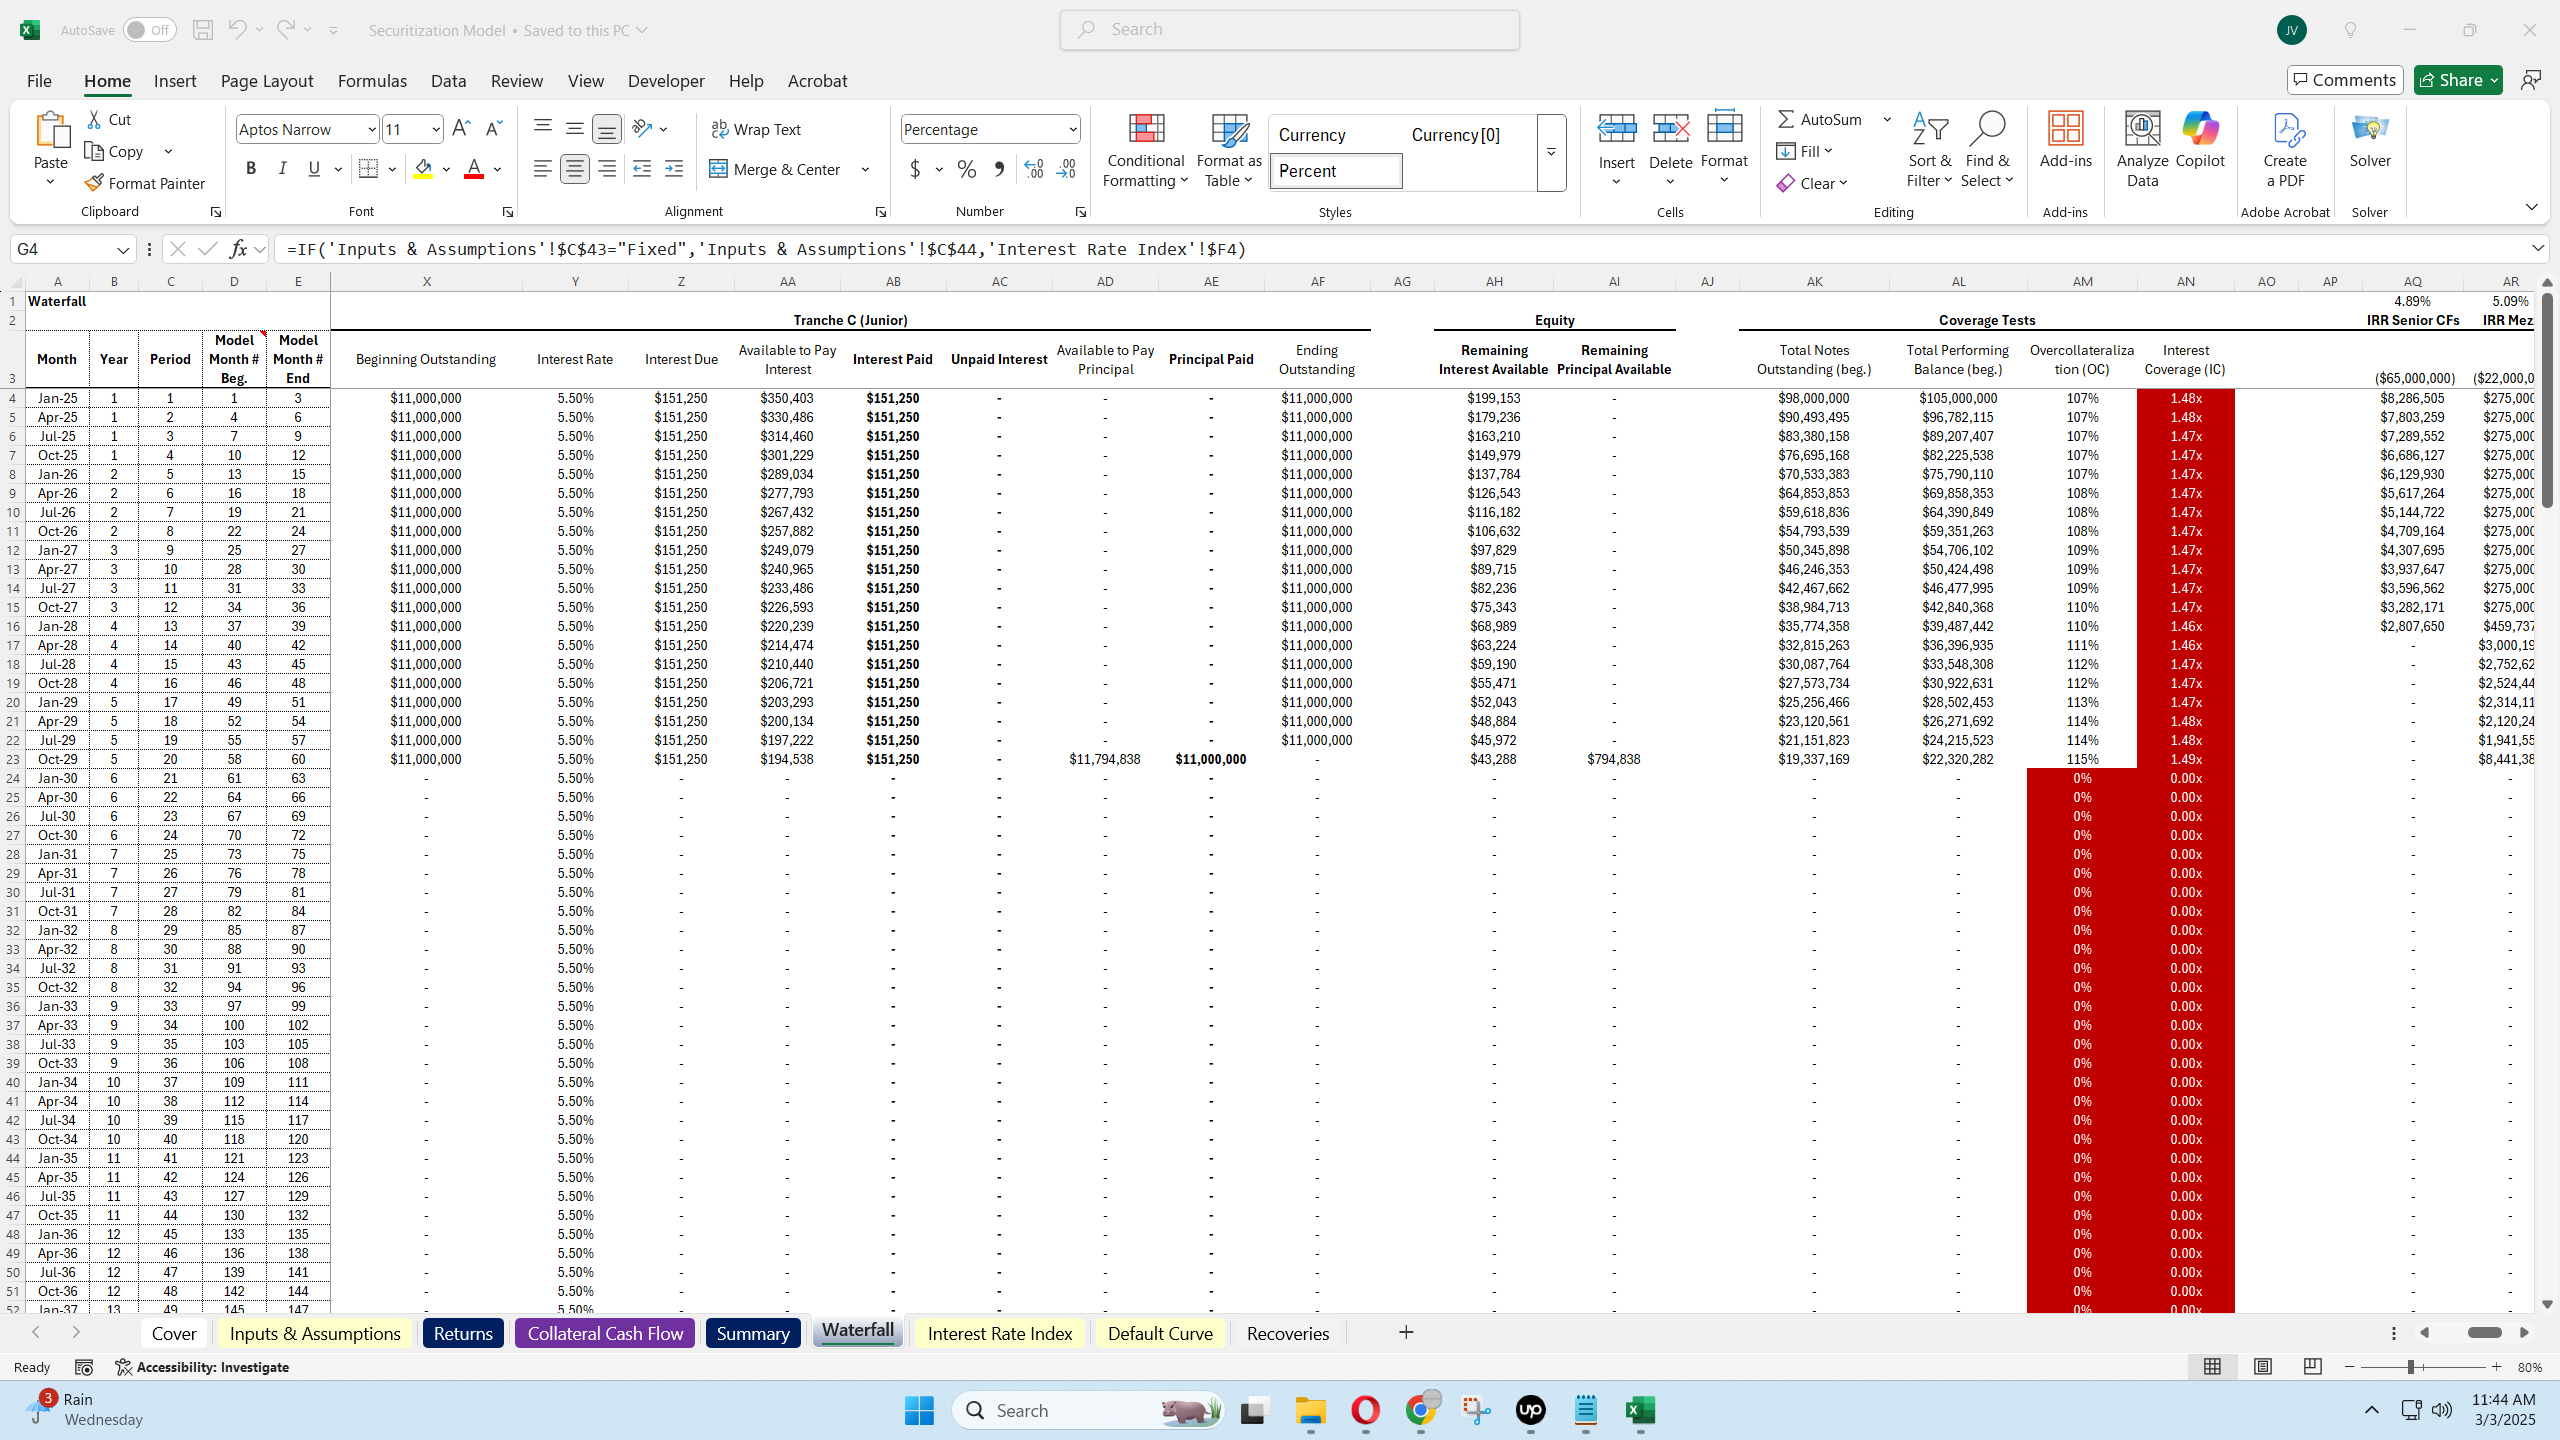
Coverage Metrics

  • Overcollateralization coverage (loan pool balance vs. note balance)

  • Interest coverage (portfolio interest vs. note interest)

  • Automatic red-flag highlighting when thresholds are breached

Final Returns

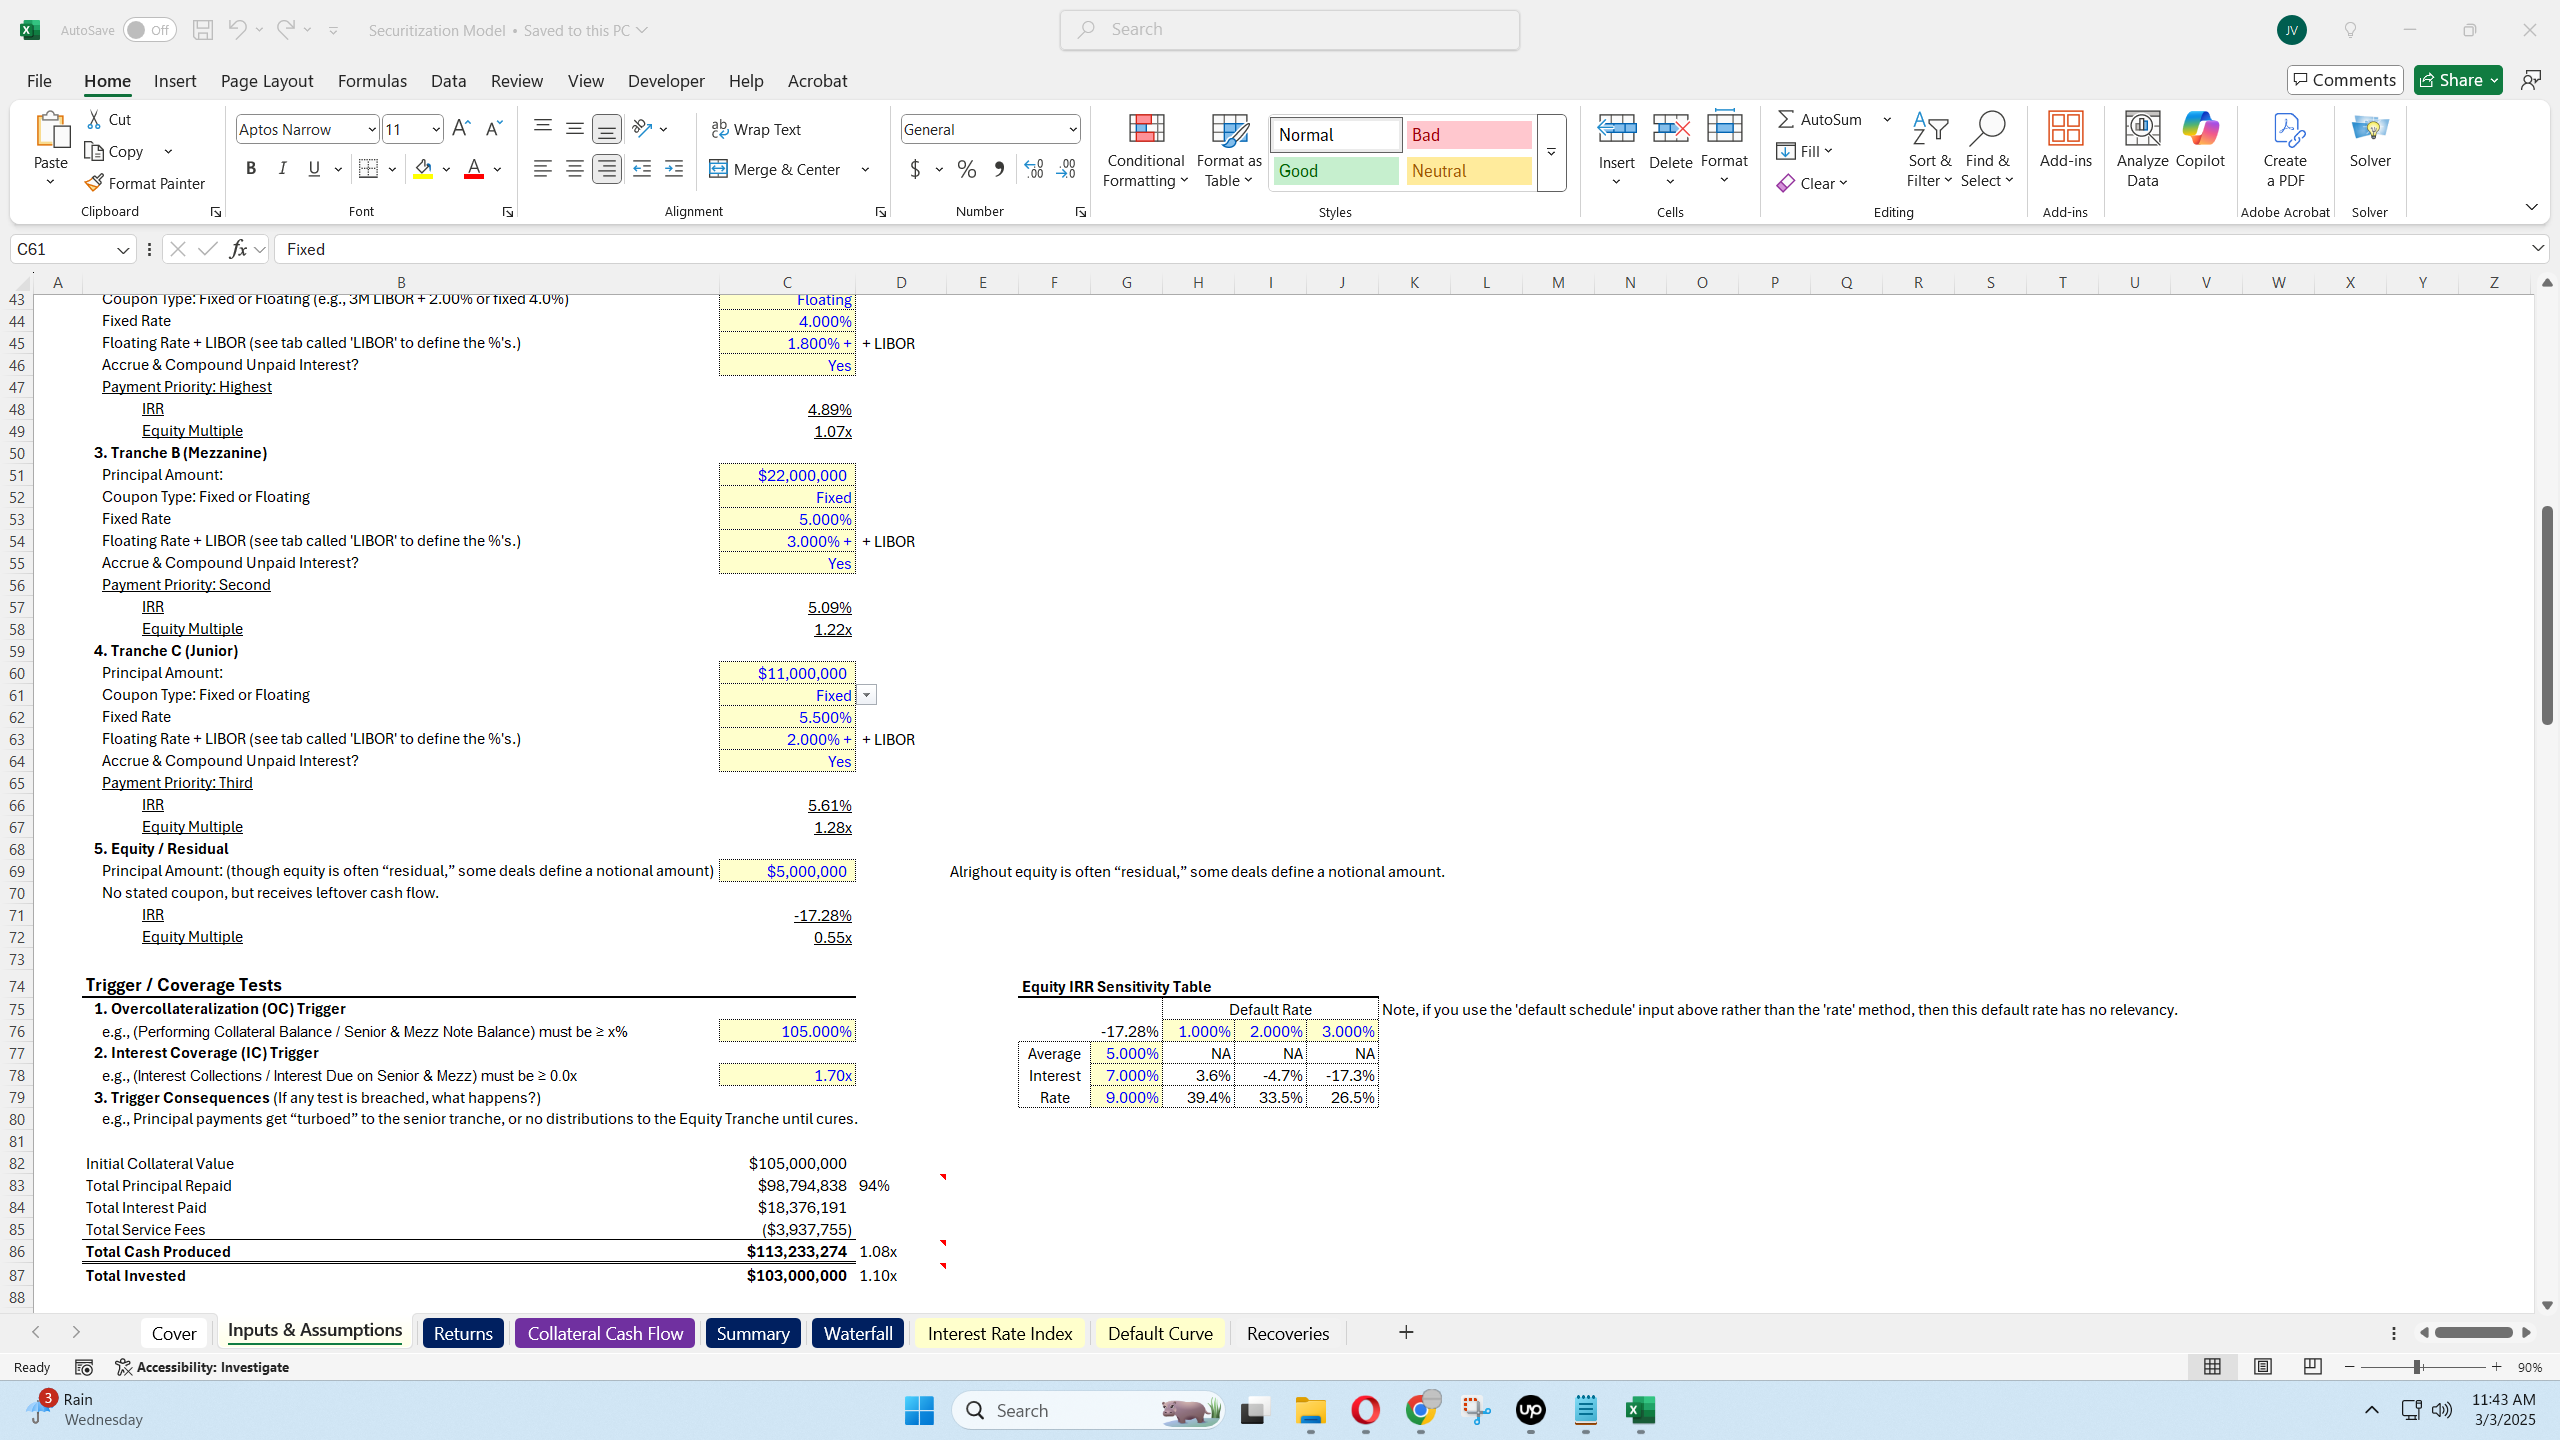
  • Shows IRRs and equity multiples for each note tranche and the equity piece

  • User-defined distribution frequency (monthly, quarterly, or annually)

Visualizations

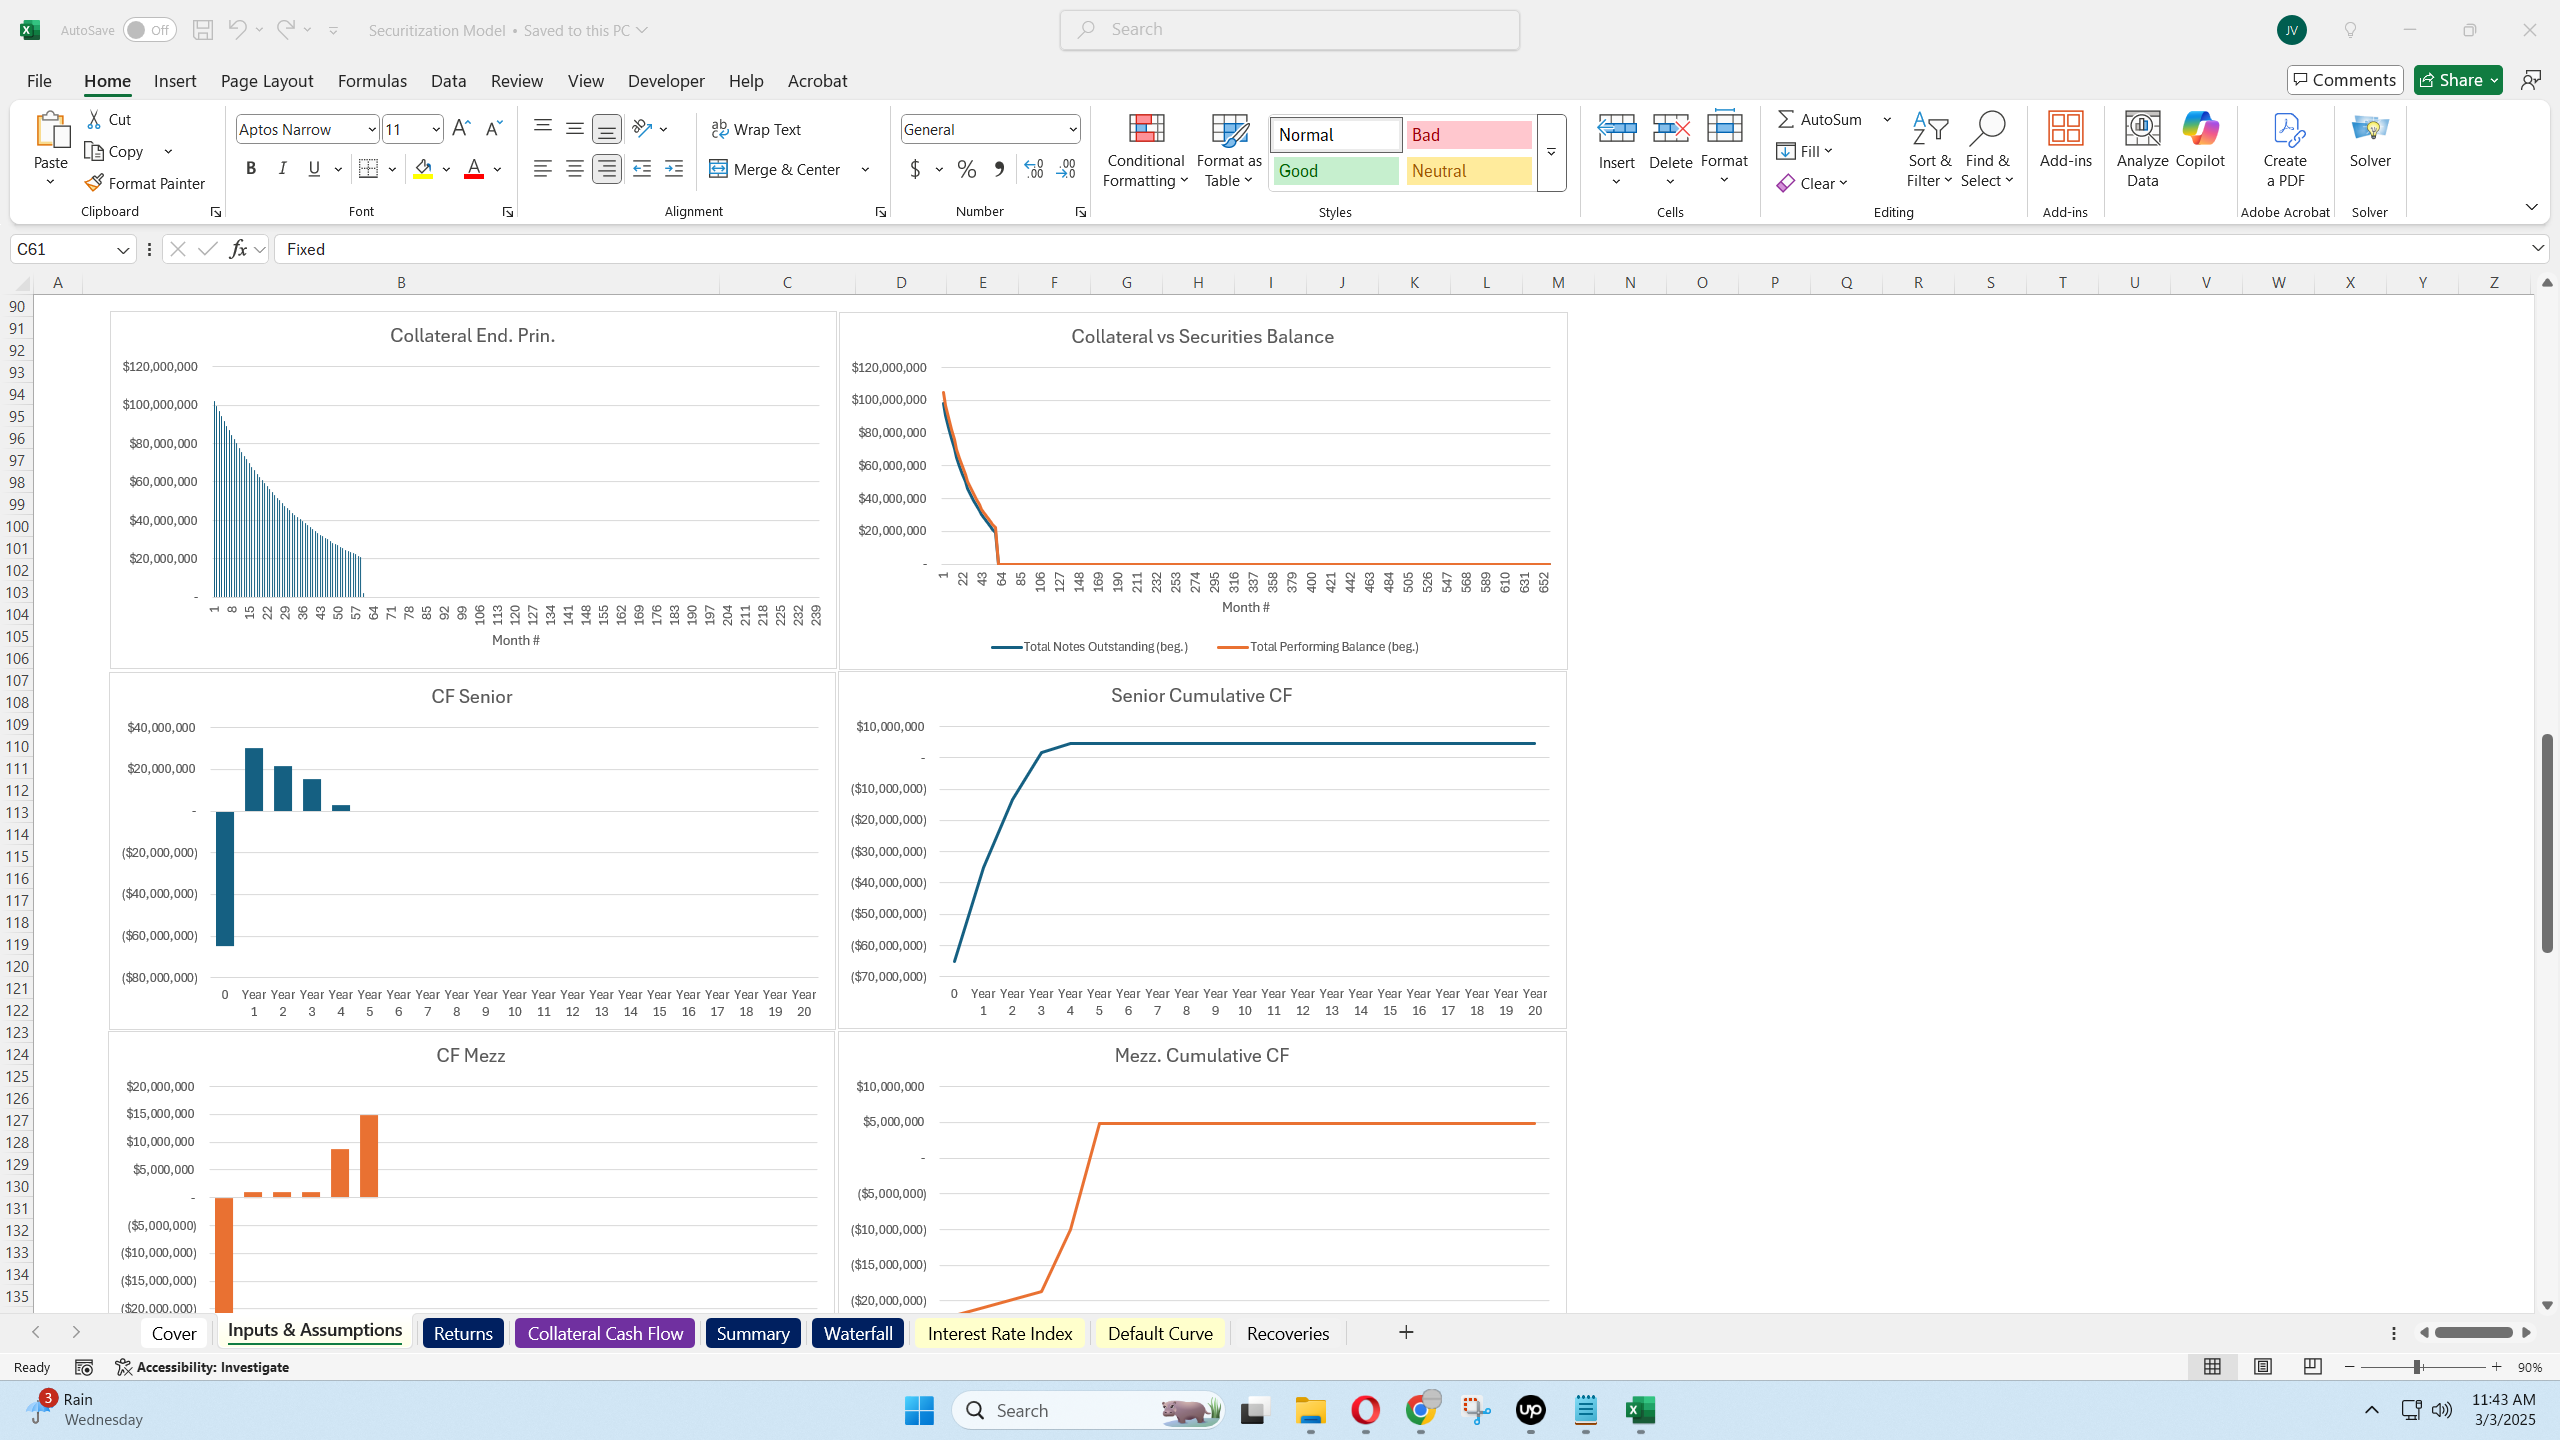
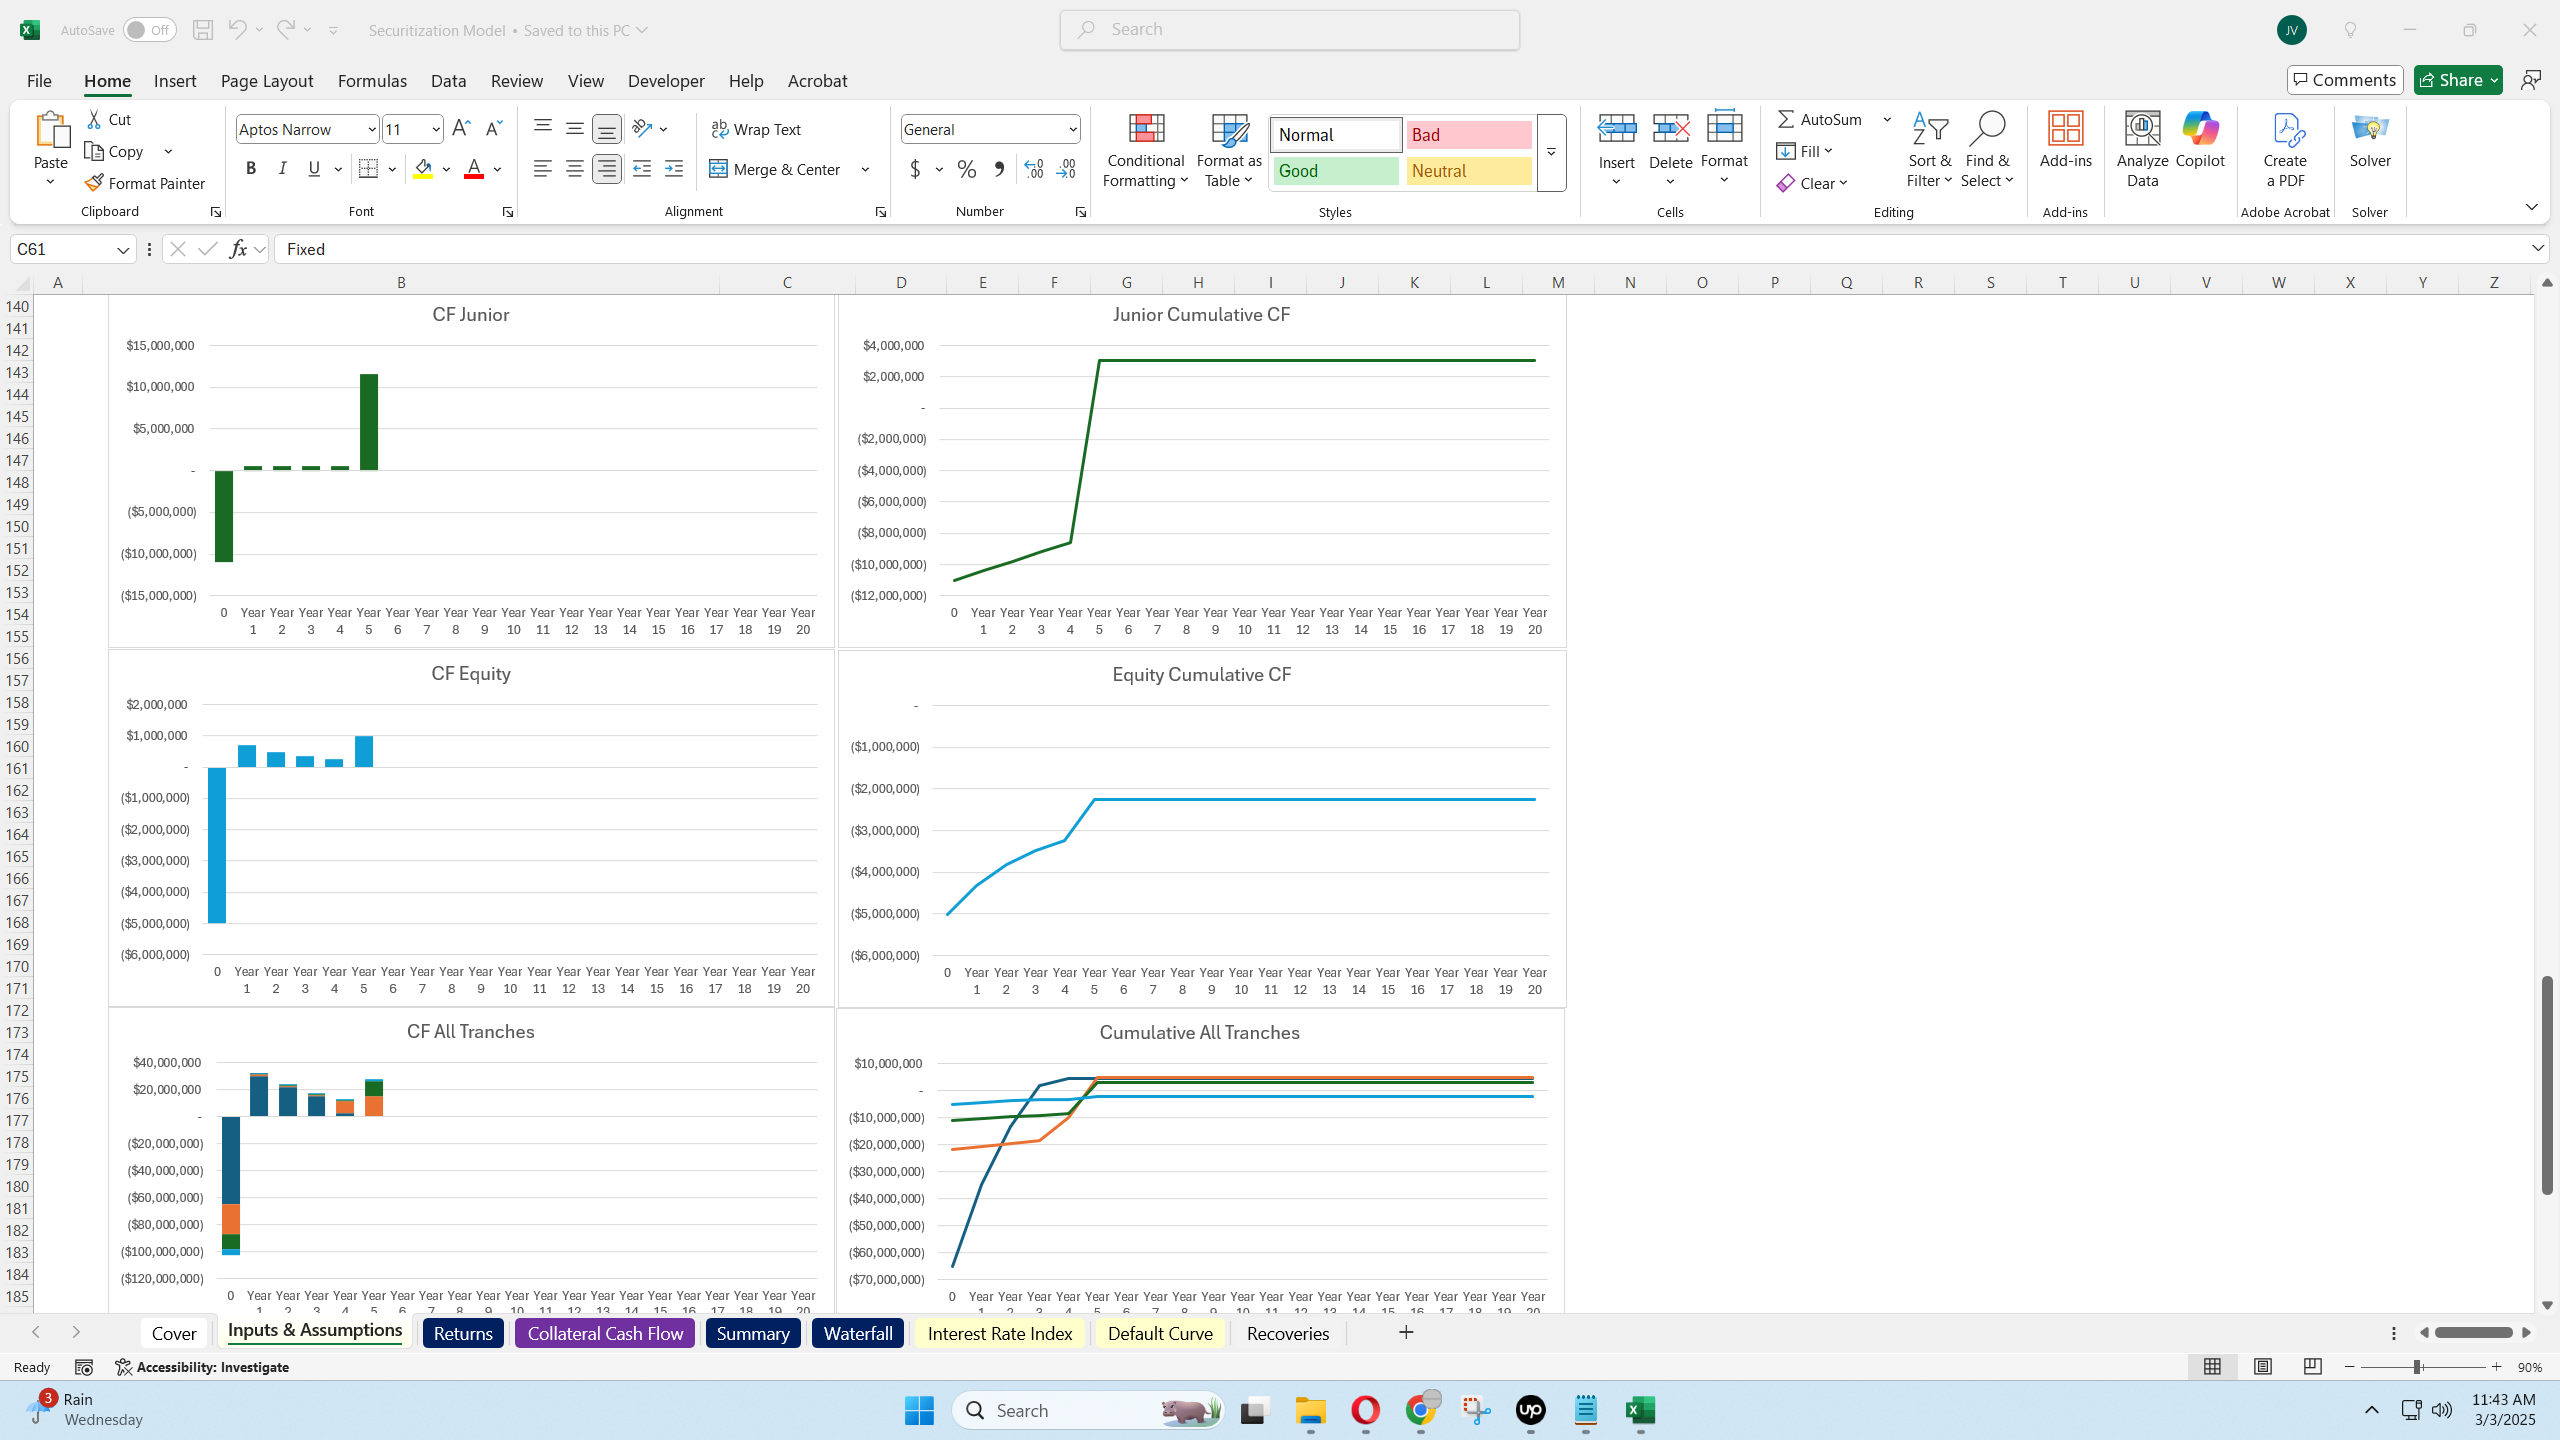
  • Graphs for loan portfolio balance, cash flows, and coverage metrics

Aggregated Loan Pool Inputs

  • Weighted average interest rate (pool-level yield)

  • Weighted average remaining term (WAM)

  • Total remaining loan balance

  • Prepayment defined via annual percentage (converted to monthly)

  • Defaults defined as annual rates or total annual pool default percentages

  • Recoveries determined by a percentage and a recovery lag in months

Servicing Fees

  • Fixed periodic amount or percentage of the initial principal balance

Security Offering Inputs (Notes)

  • Define up to three tranches (Senior, Mezz, Junior) with fixed or floating rates

  • LIBOR curve entry for floating-rate notes

  • Option for unpaid interest to compound

  • Waterfall prioritizes principal repayment: Senior → Mezz → Junior → Equity

  • Collateral interest nets out servicing fees, then pays note interest; excess goes to equity

Coverage Metrics & Waterfall Highlights

  • Waterfall tab with overcollateralization coverage and interest coverage by period

  • Highlights periods in red if coverage thresholds are not met

Sensitivity Table

  • Built-in 3×3 matrix to see how default rate and weighted average interest rate changes affect equity IRR

  • Can be removed to improve model speed if desired

Outputs & Visual Aids

  • Time-series graphs of portfolio balance and note amortization

  • Coverage metric charts (overcollateralization and interest coverage)

  • Return summaries (IRRs and equity multiples) for each tranche and equity

Key Benefits

  • Offers a powerful, user-friendly platform for modeling loan securitizations without loan-level detail

  • Enables quick scenario testing and granular coverage analysis for professional securitization assessments

This Best Practice includes
1 Excel model and 1 Tutorial Video

Acquire business license for $70.00

Add to cart

Add to bookmarks

Discuss

Further information

Analyze the performance of a basket of loans against notes, based on varying assumptions.

This works best when the loan pool is for loans with fairly similar attributes, but weighted averages can be used.


0.0 / 5 (0 votes)

please wait...