

Originally published: 17/05/2022 14:18
Last version published: 14/06/2024 10:32
Publication number: ELQ-89029-3
View all versions & Certificate
Last version published: 14/06/2024 10:32
Publication number: ELQ-89029-3
View all versions & Certificate

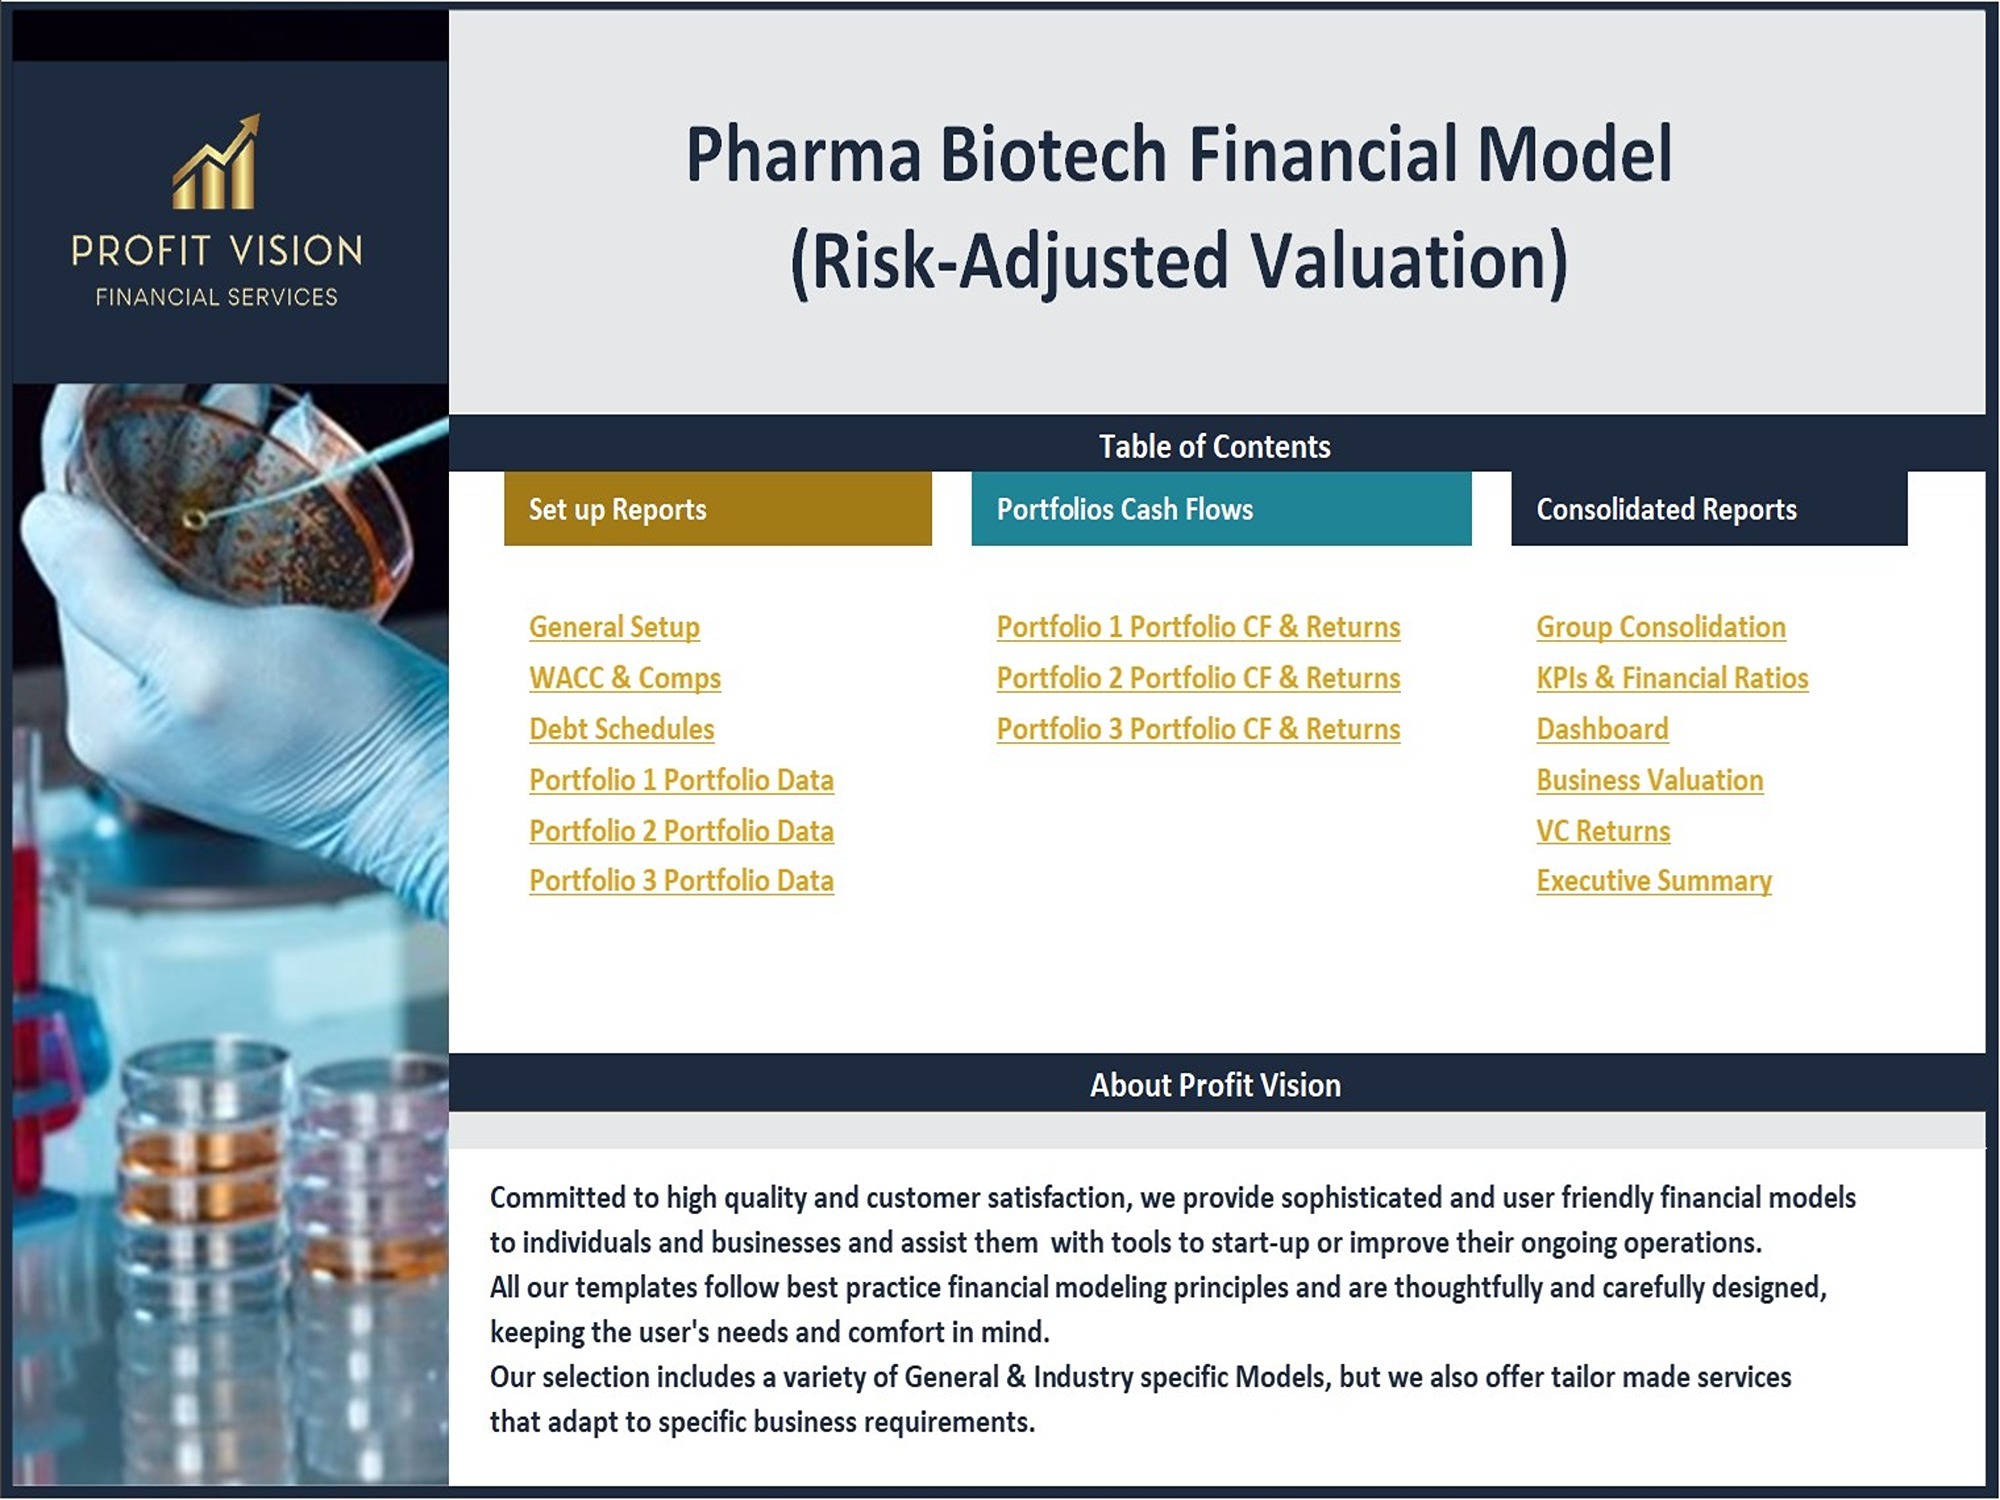
Pharma Biotech Financial Model incl. Risk-Adjusted DCF and VC Valuation
Financial Model analyzing a Biopharmaceutical Company using a Risk-Adjusted NPV Valuation Methodology.
pharmaceuticalbiotechbiotech valuationrisk adjusted npvhealthmedicinesdrug developmentventure capitalfundraisinginvestors returns
Description
New Versions Features:
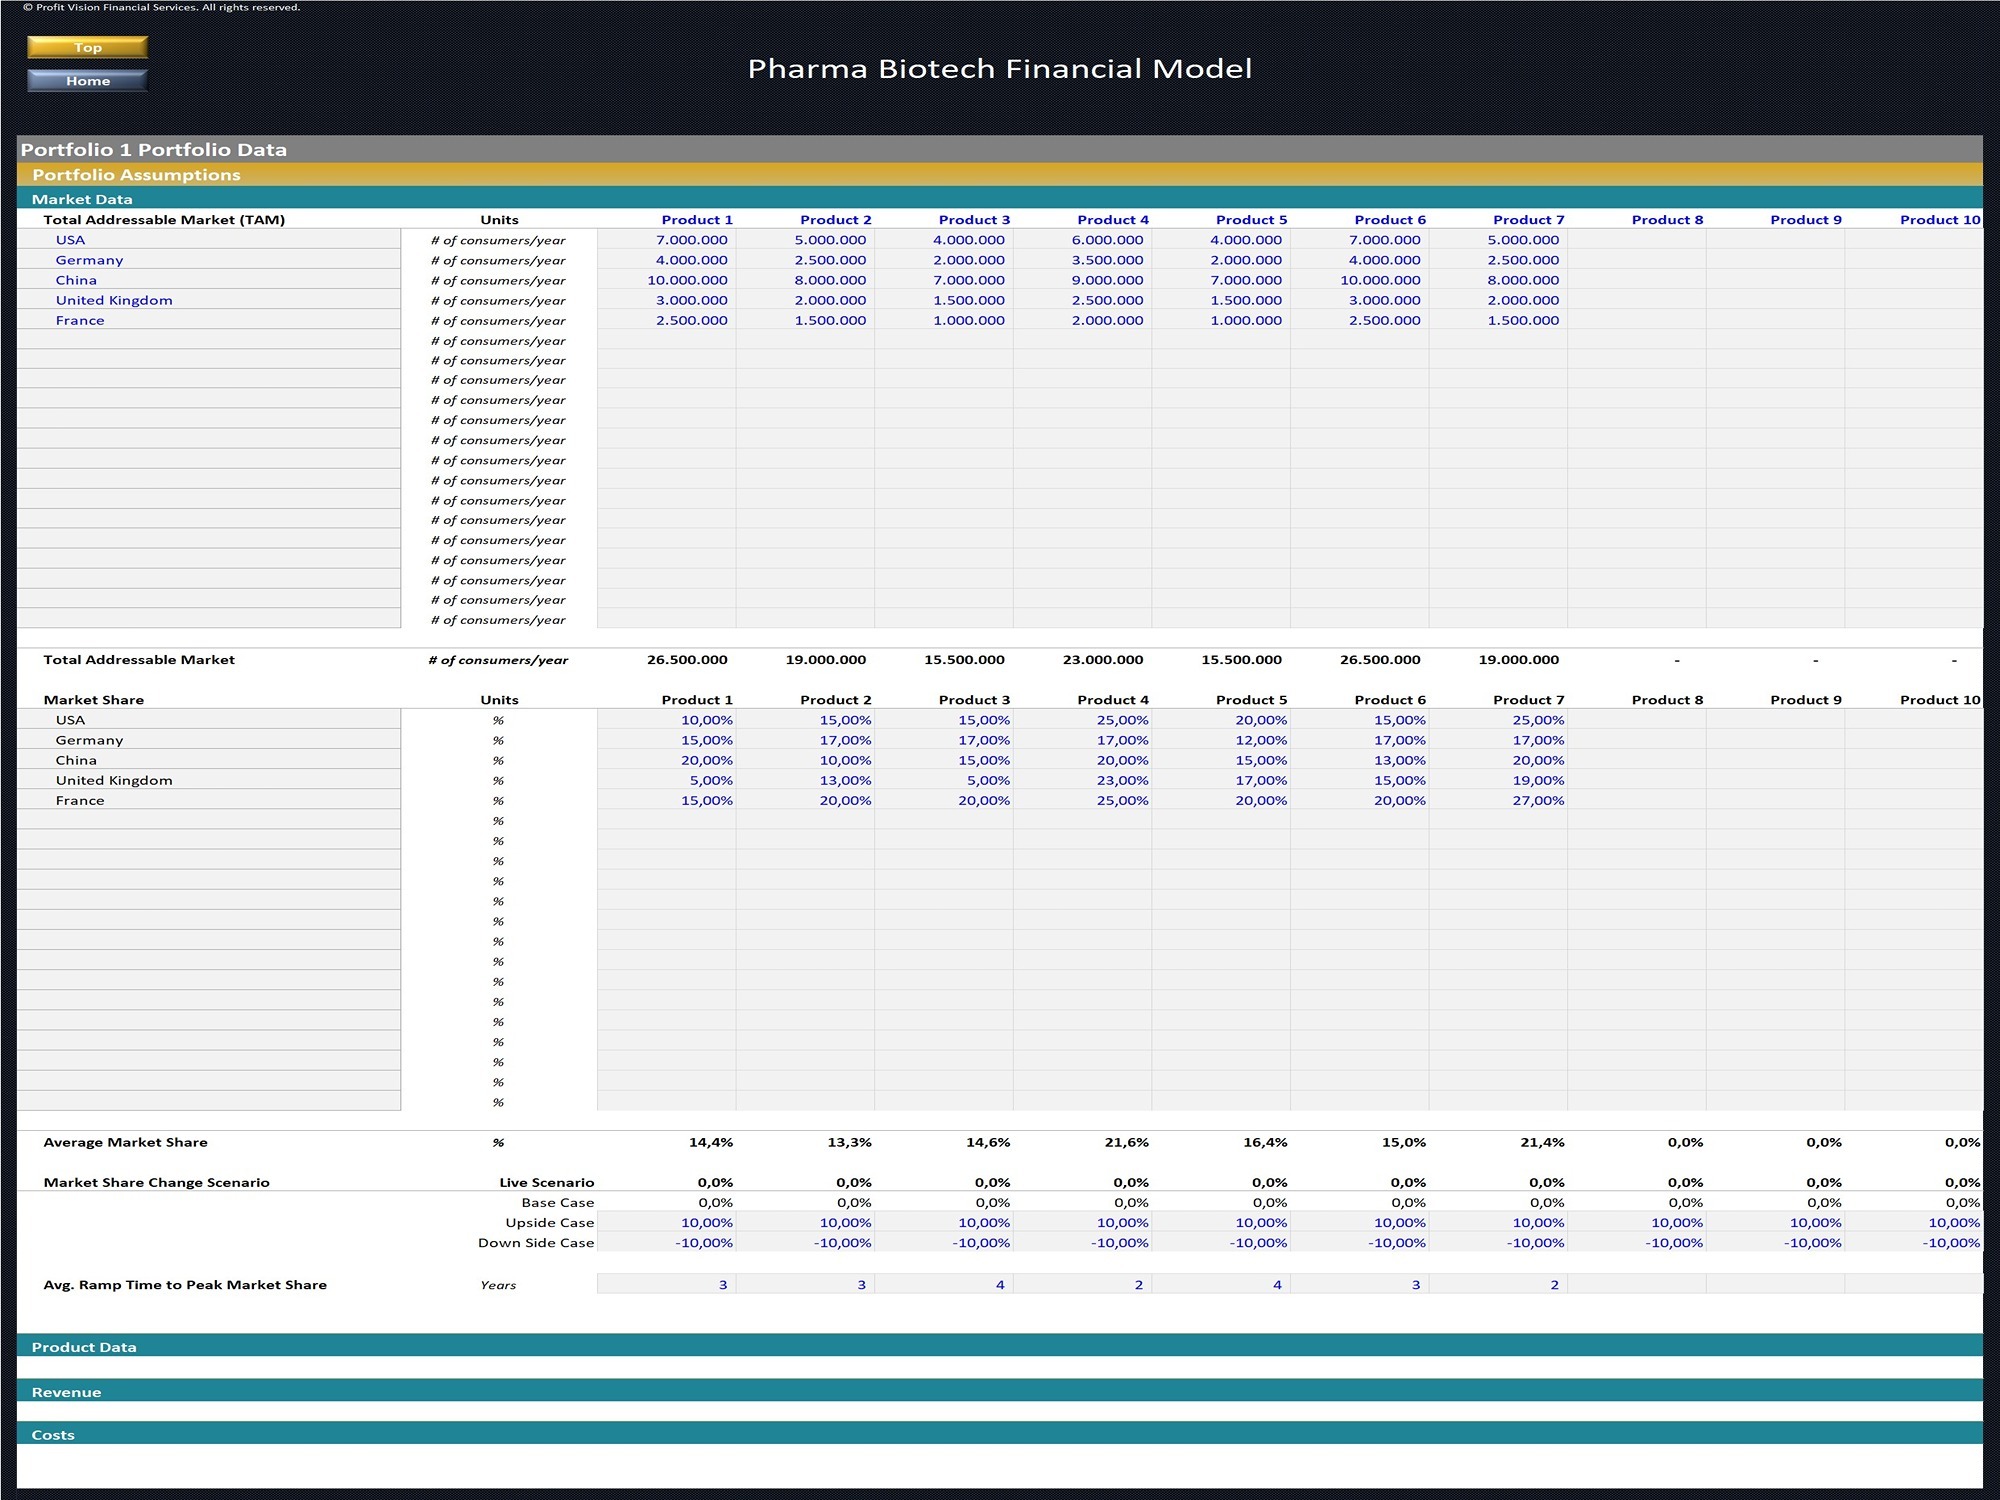
The new version includes 3 portfolios of products. Each portfolio includes up to 10 products and up to 30 different coutries for products distribution.
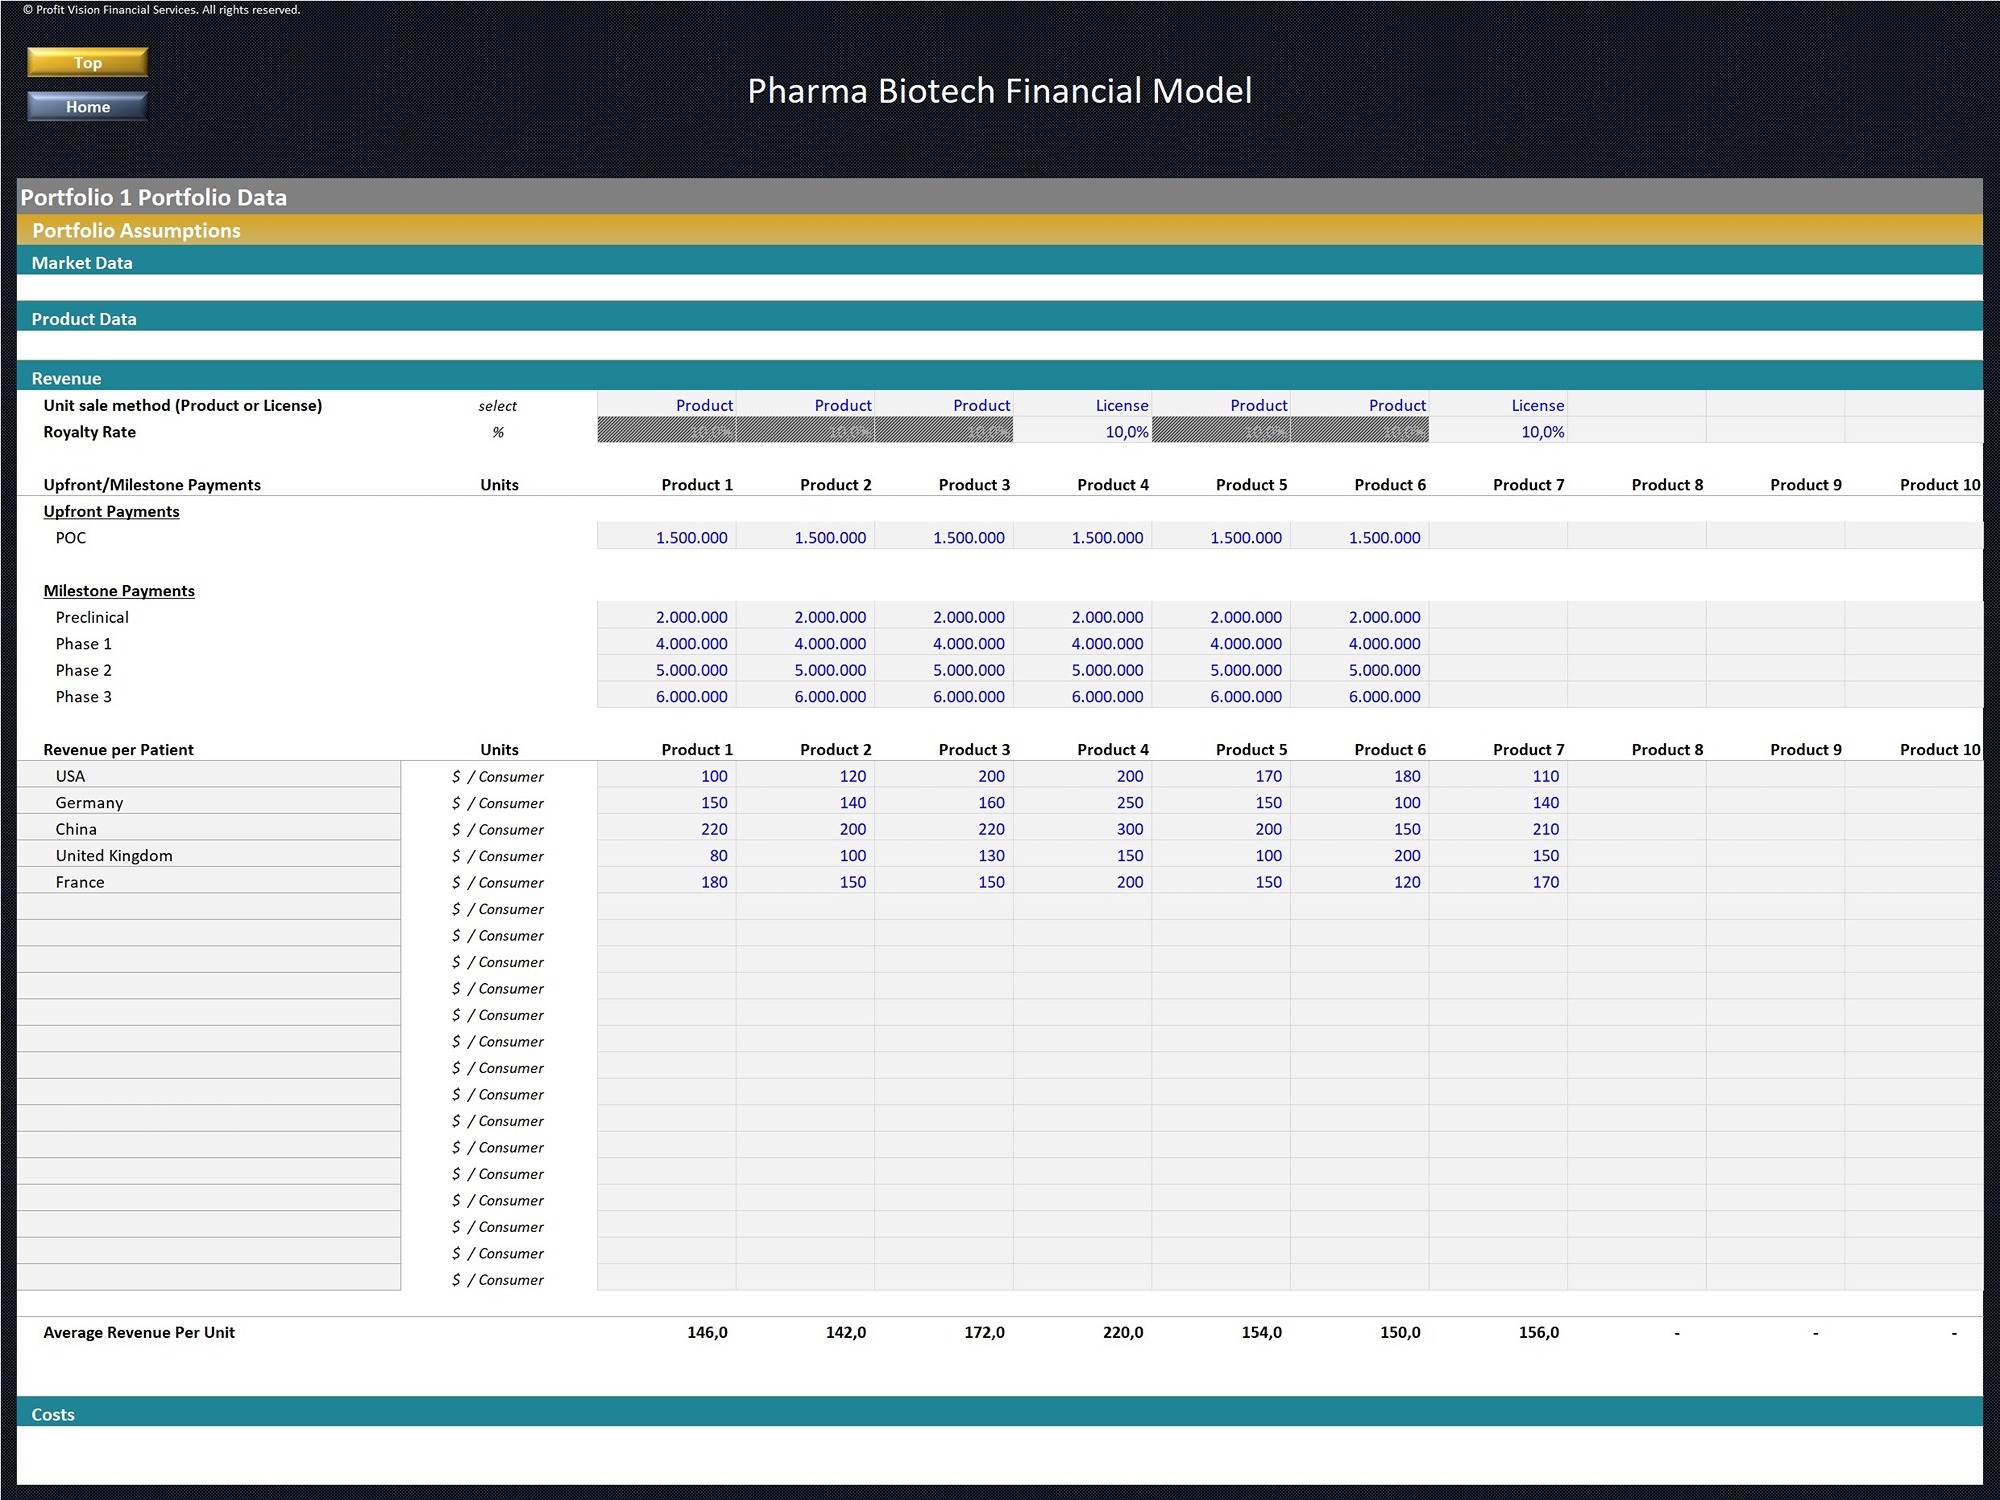
The new versions also include assumptions for Milestone and Upfront Payments for each product and Scenarios (Base, Upside, Downside) for Market Share penetration and LOA (Likelihood of Approval).
Financial Model presenting a business scenario of a Pharma / Biotech Company with 3 portfolios including 10 different types of products, each representing a potential market opportunity.
The model analyzes the NPV of each portfolio/product using a Risk-Adjusted DCF Valuation methodology after taking into consideration the different development risks and probability of success across 6 different development phases (Proof of Concept, Preclinical, Phase I, Phase II, Phase III, Approval).
The CF analysis of each portfolio is added together along with various Operating Expenses and Financing Assumptions to produce Group's Consolidated Financial Statements and come up with Business Unlevered and Levered Return Metrics (rNPV, IRR, MOIC, etc.).
Revenue is earned either through direct sale of the product or through product licensing and is forecasted using assumptions on product/portfolio potential market penetration, expected peak sales, sale price, royalty rates, etc.
The model includes Development timing assumptions per product from Preclinical to Market phases, Research & Development Costs per product and development phase, Pre and Post Market Capital Expenditures, and direct & indirect Operating Expenses.
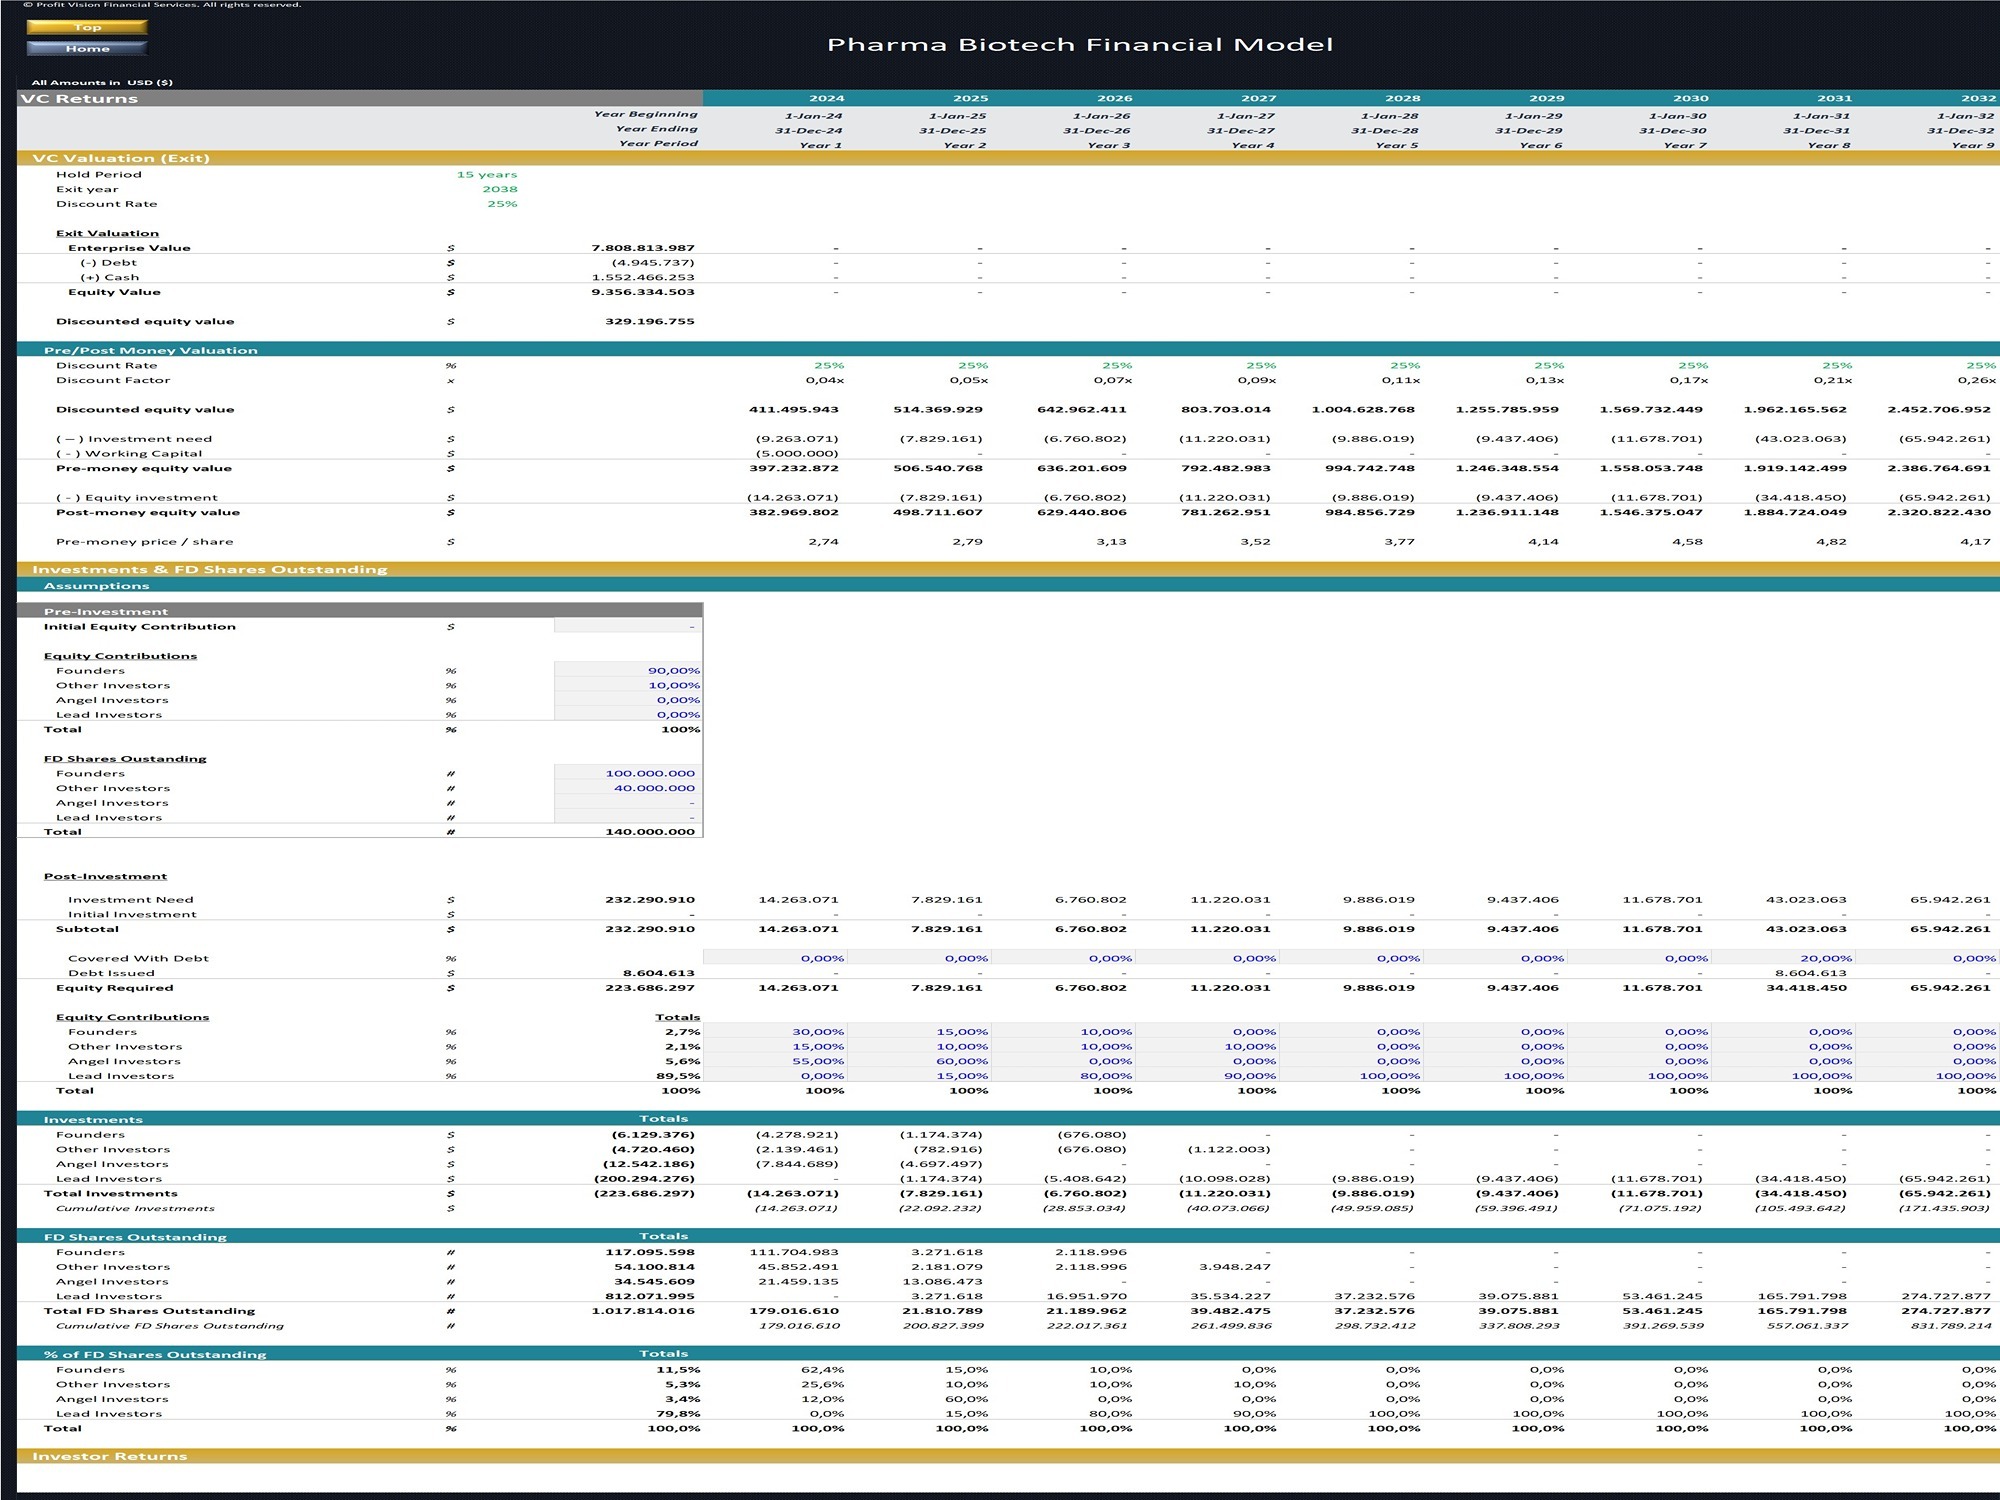
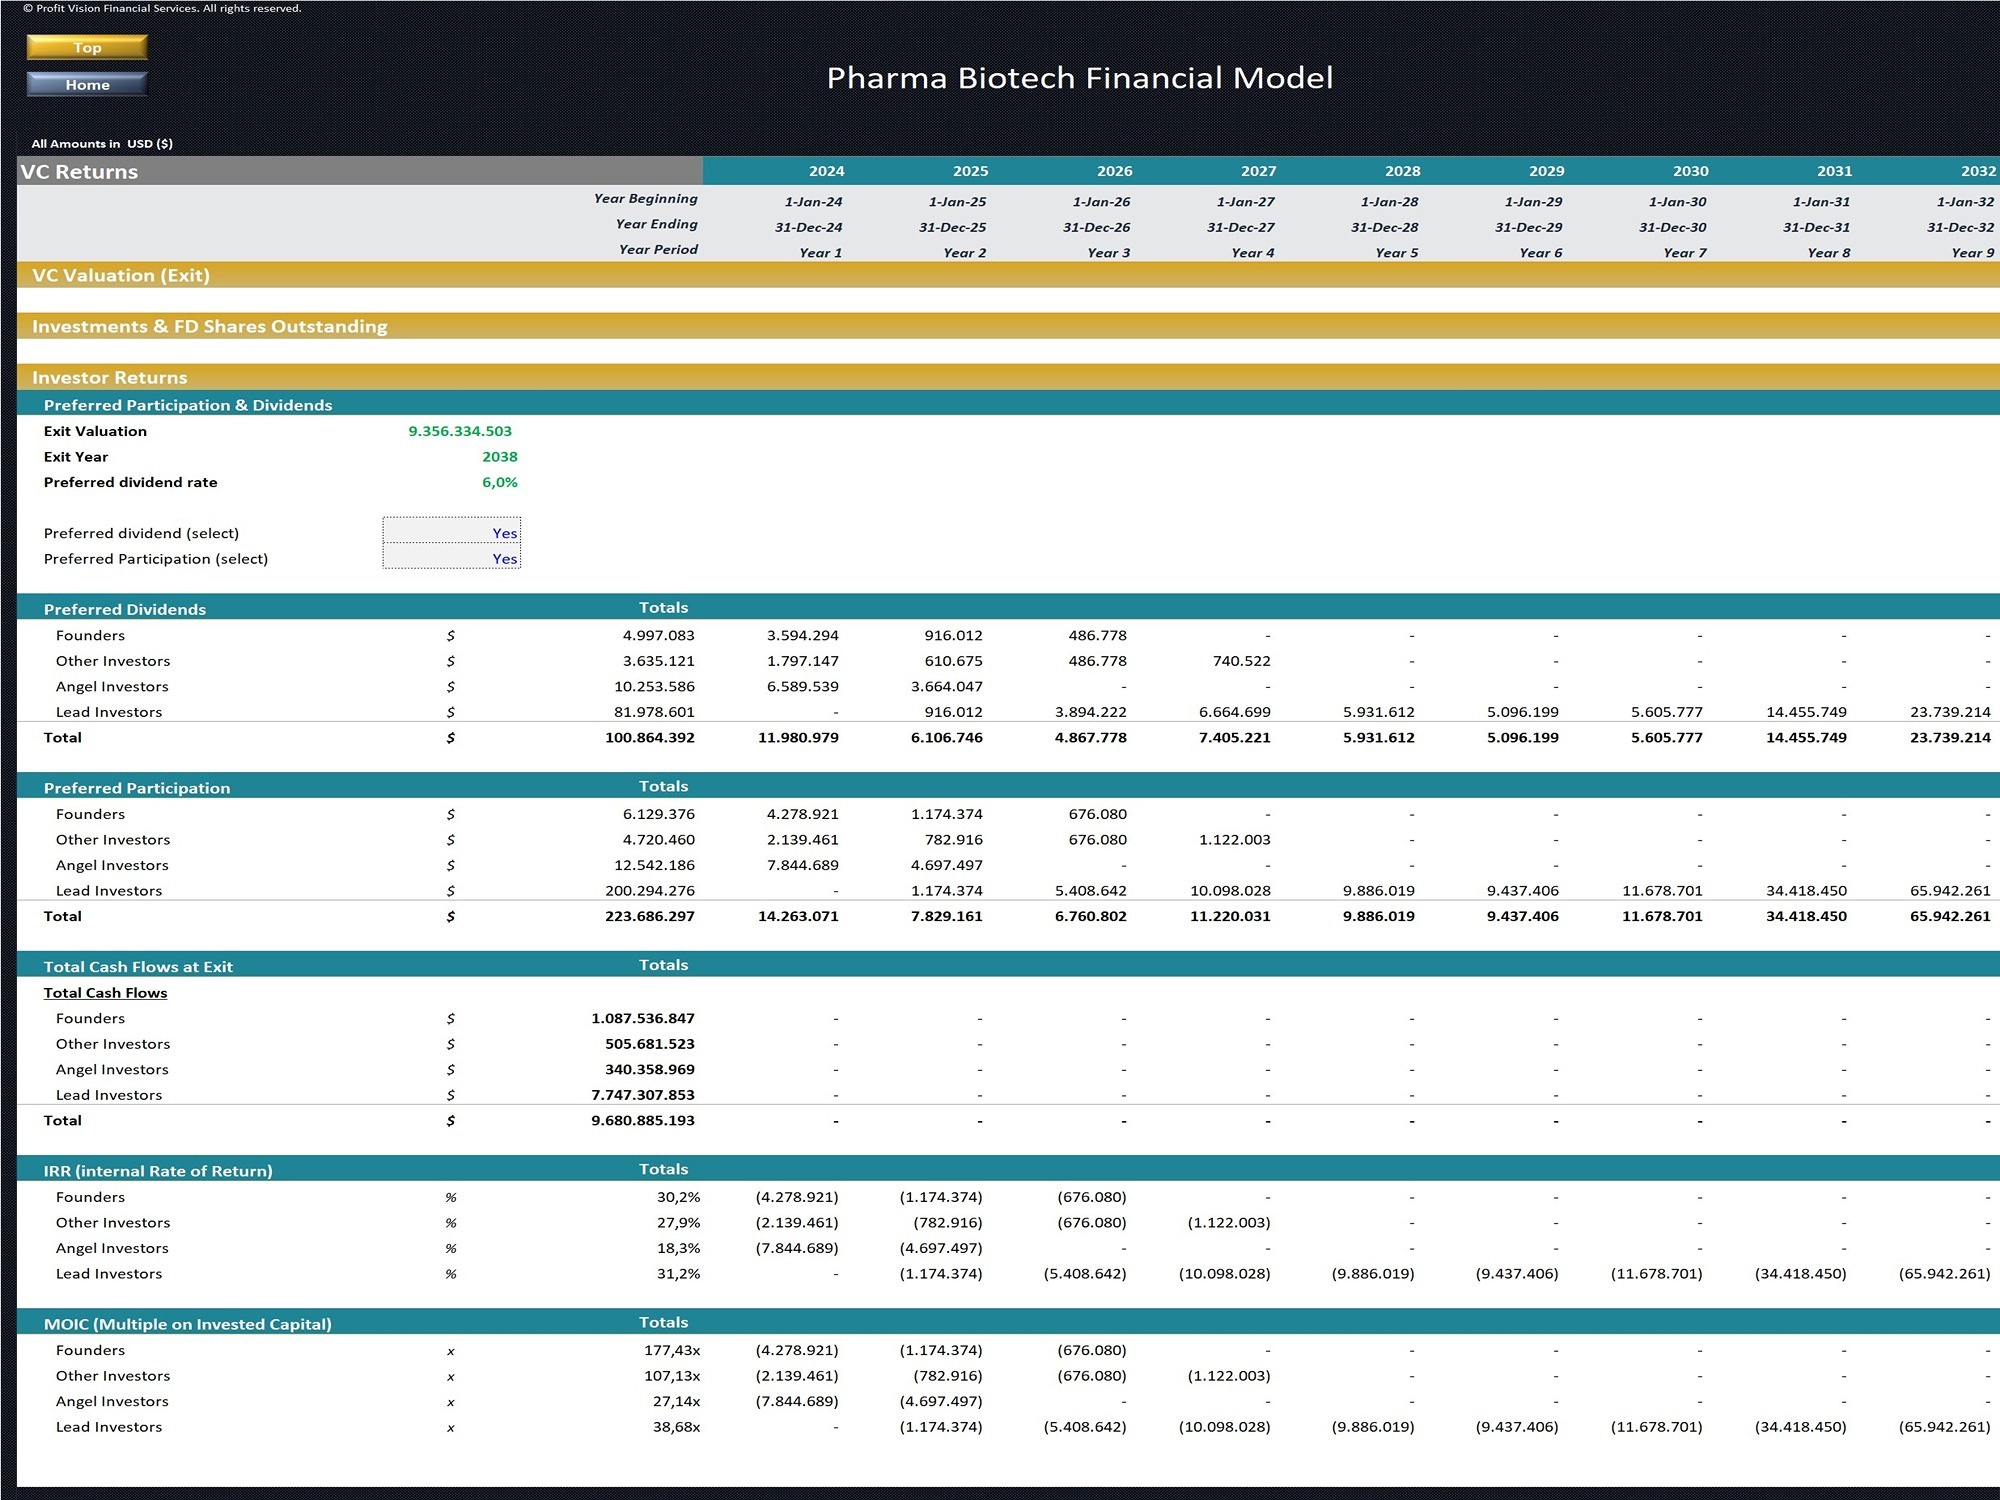
Finally the model provides a Venture Capital Valuation and Fundraising Analysis including Discounted Equity Value, Pre/Post Money Valuation, Fundraising per Investor (Invested Amount, FD Shares Outstanding, Share Price) and Investors Returns (Dividends Payout, Profit, IRR, MOIC).
The structure of the template follows Financial Modeling Best Practices principles and is fully customizable.
Model Structure:
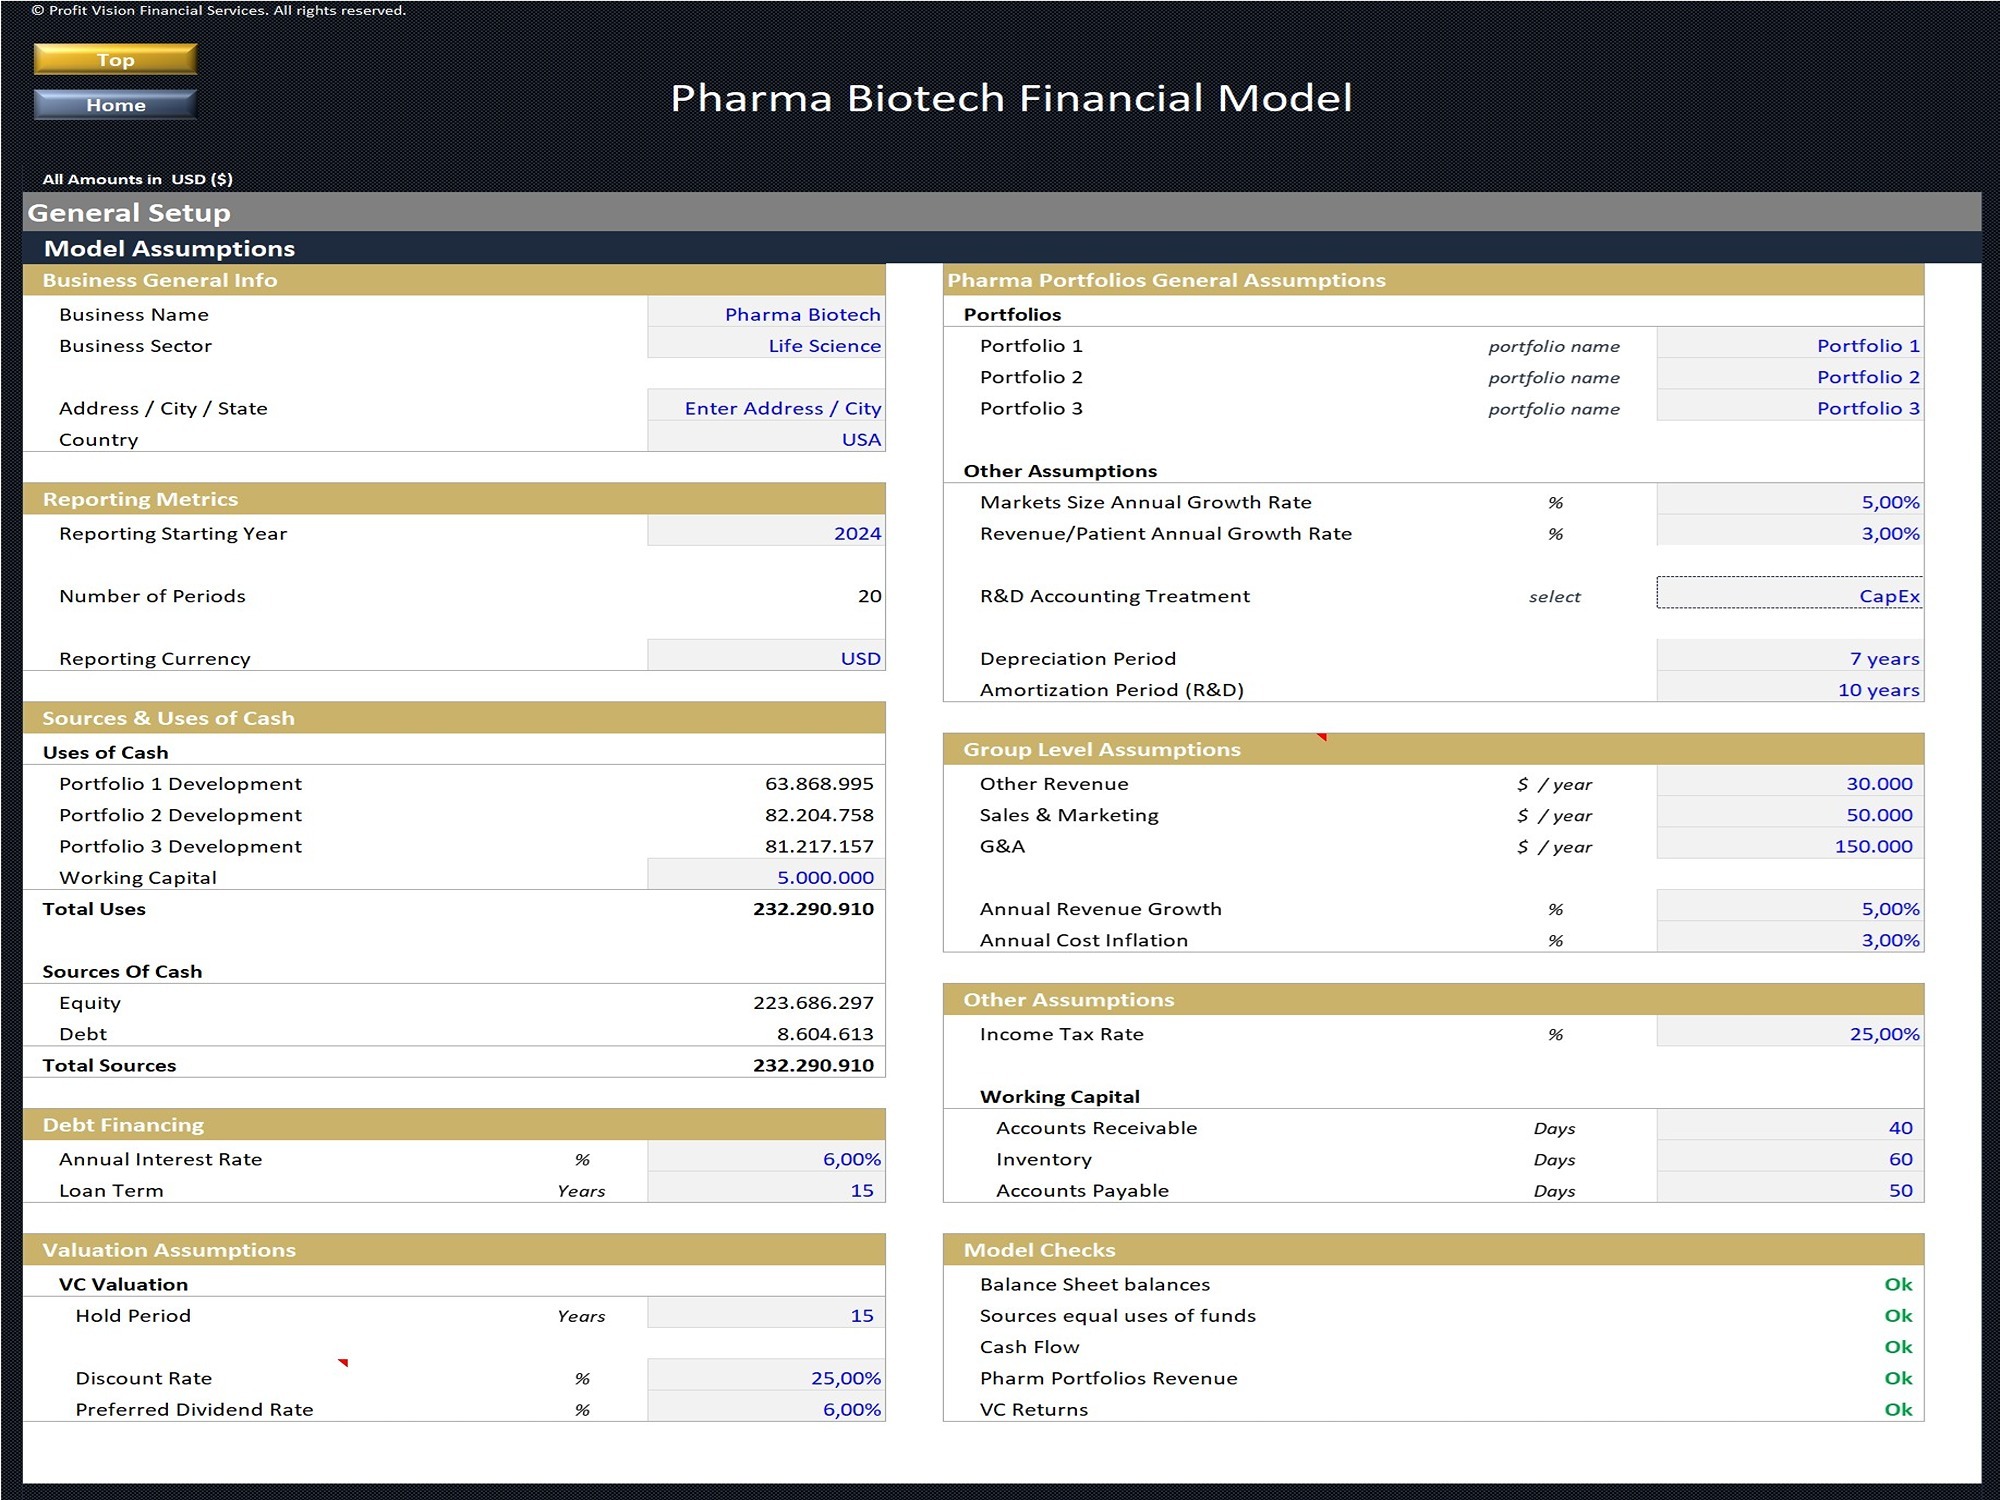
• General Setup
The General Setup tab contains all the high-level assumptions necessary for the overall functionality of the model including General Business Info, Timing and Currency, Portfolio(s) Data, Depreciation & Amortization, Income Tax Rate, Working Capital, Group Level Other Revenue & OpEx, Financing, and VC Assumptions
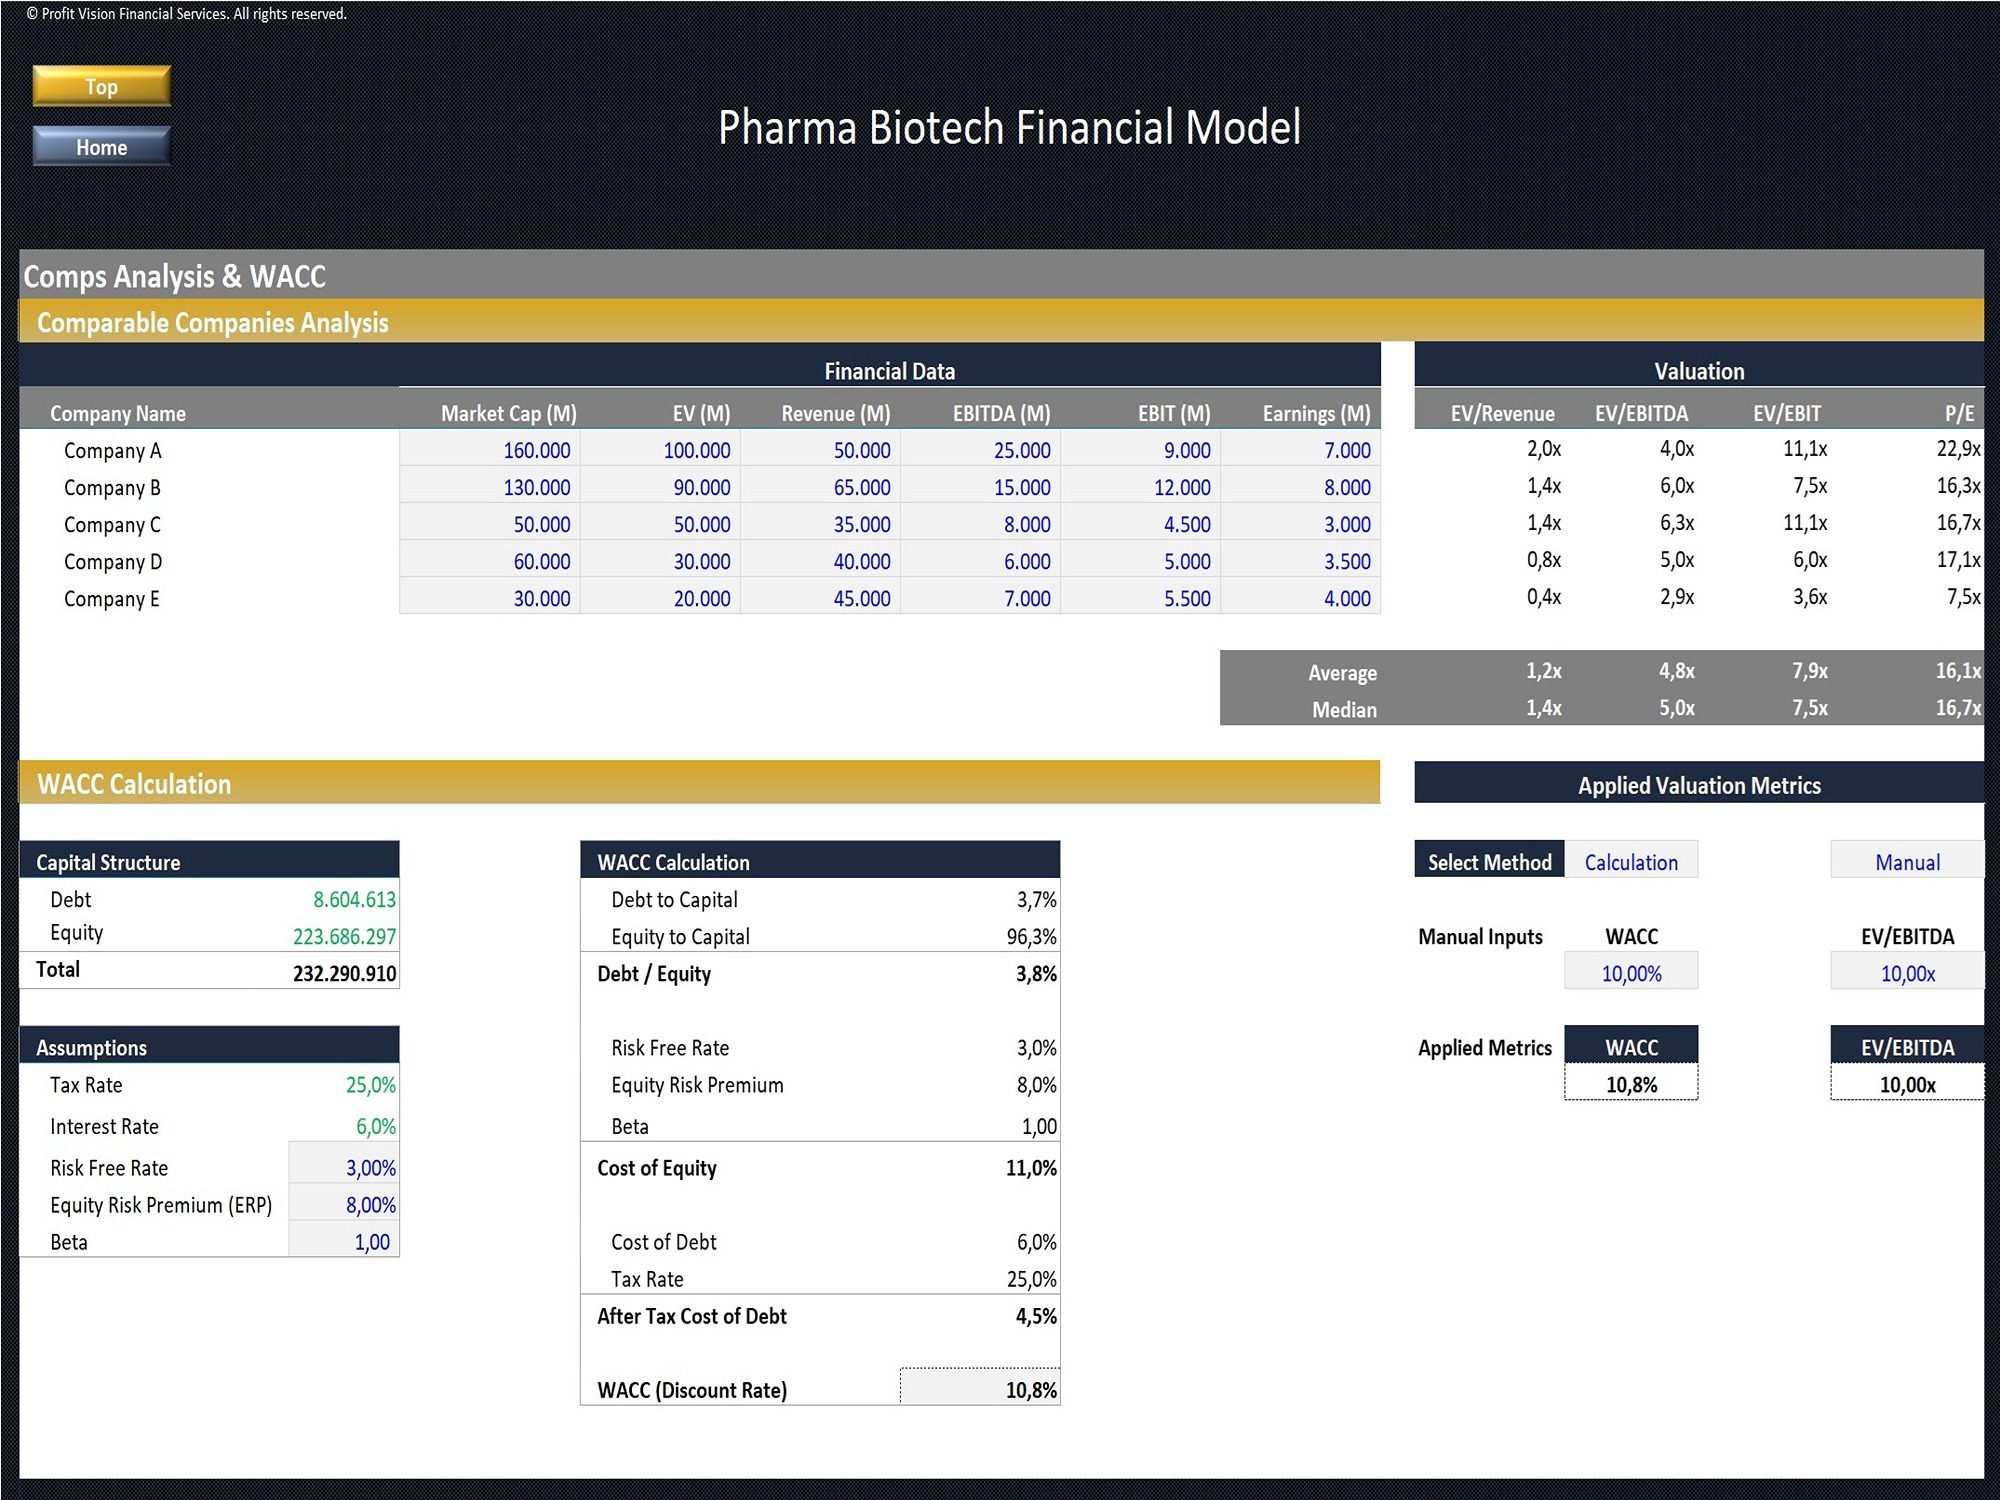
• WACC & Comps
Calculation of Weighted Average Cost of Capital using Comparable Companies Table to calculate Beta.
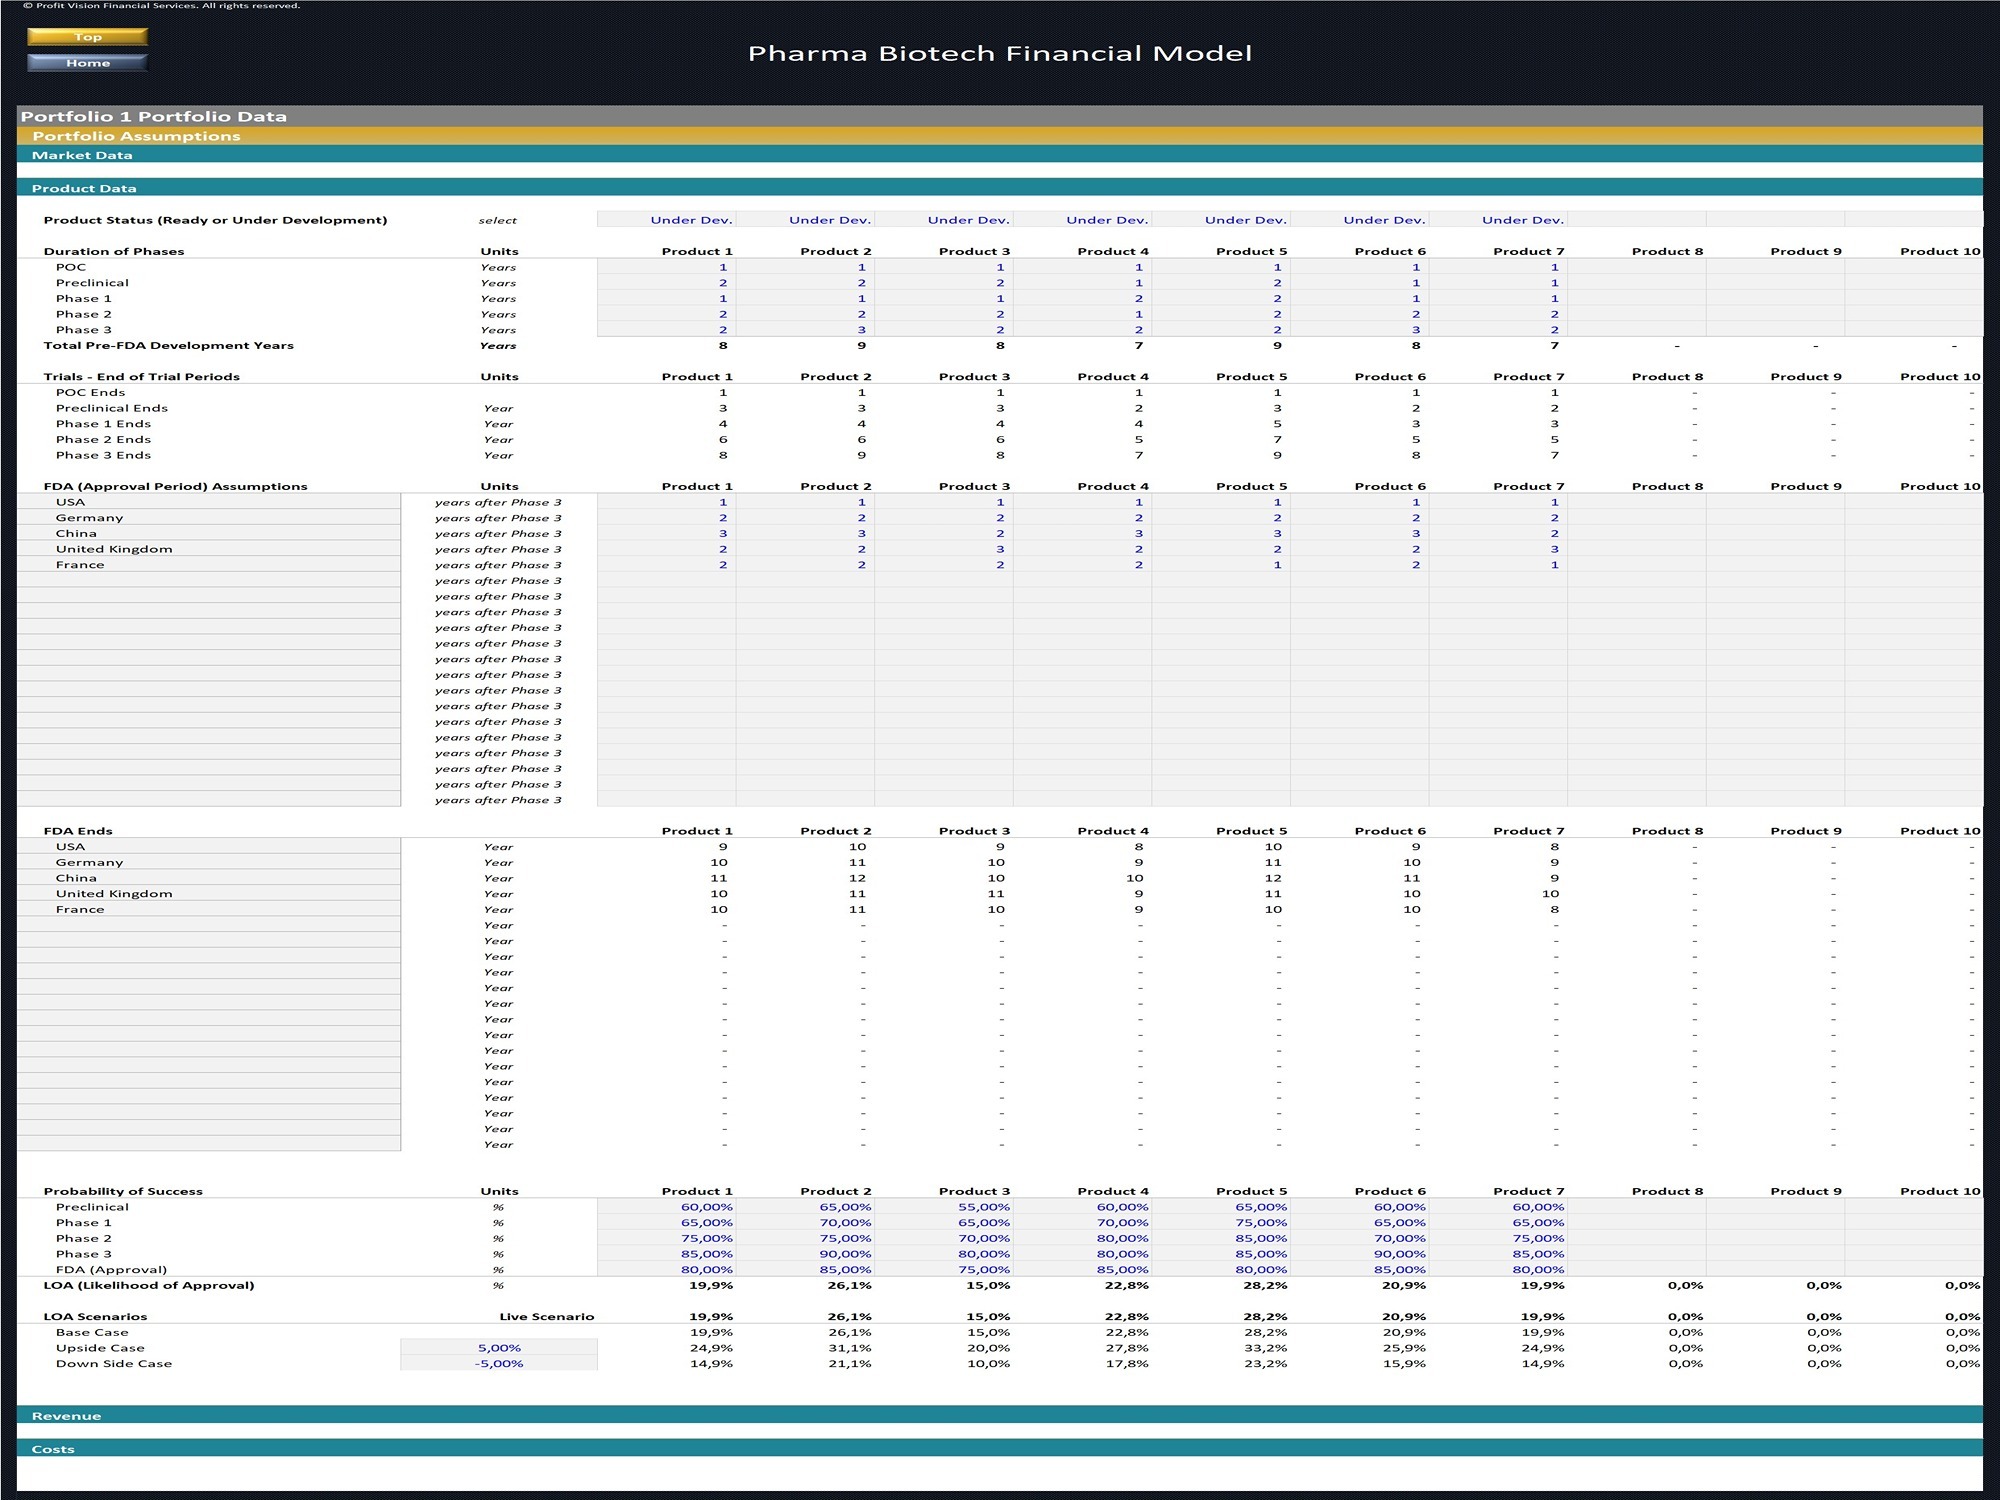
• Portfolios Data Products development and revenue assumptions including Market penetration data, Sale Price, Sale Method (Direct or License), Development phases timing and costs, COGS & OpEx, Pre/Post Market Capital Expenditures, Probability of Success (POS) rates, and LOA (Likelihood of Approval) calculation.
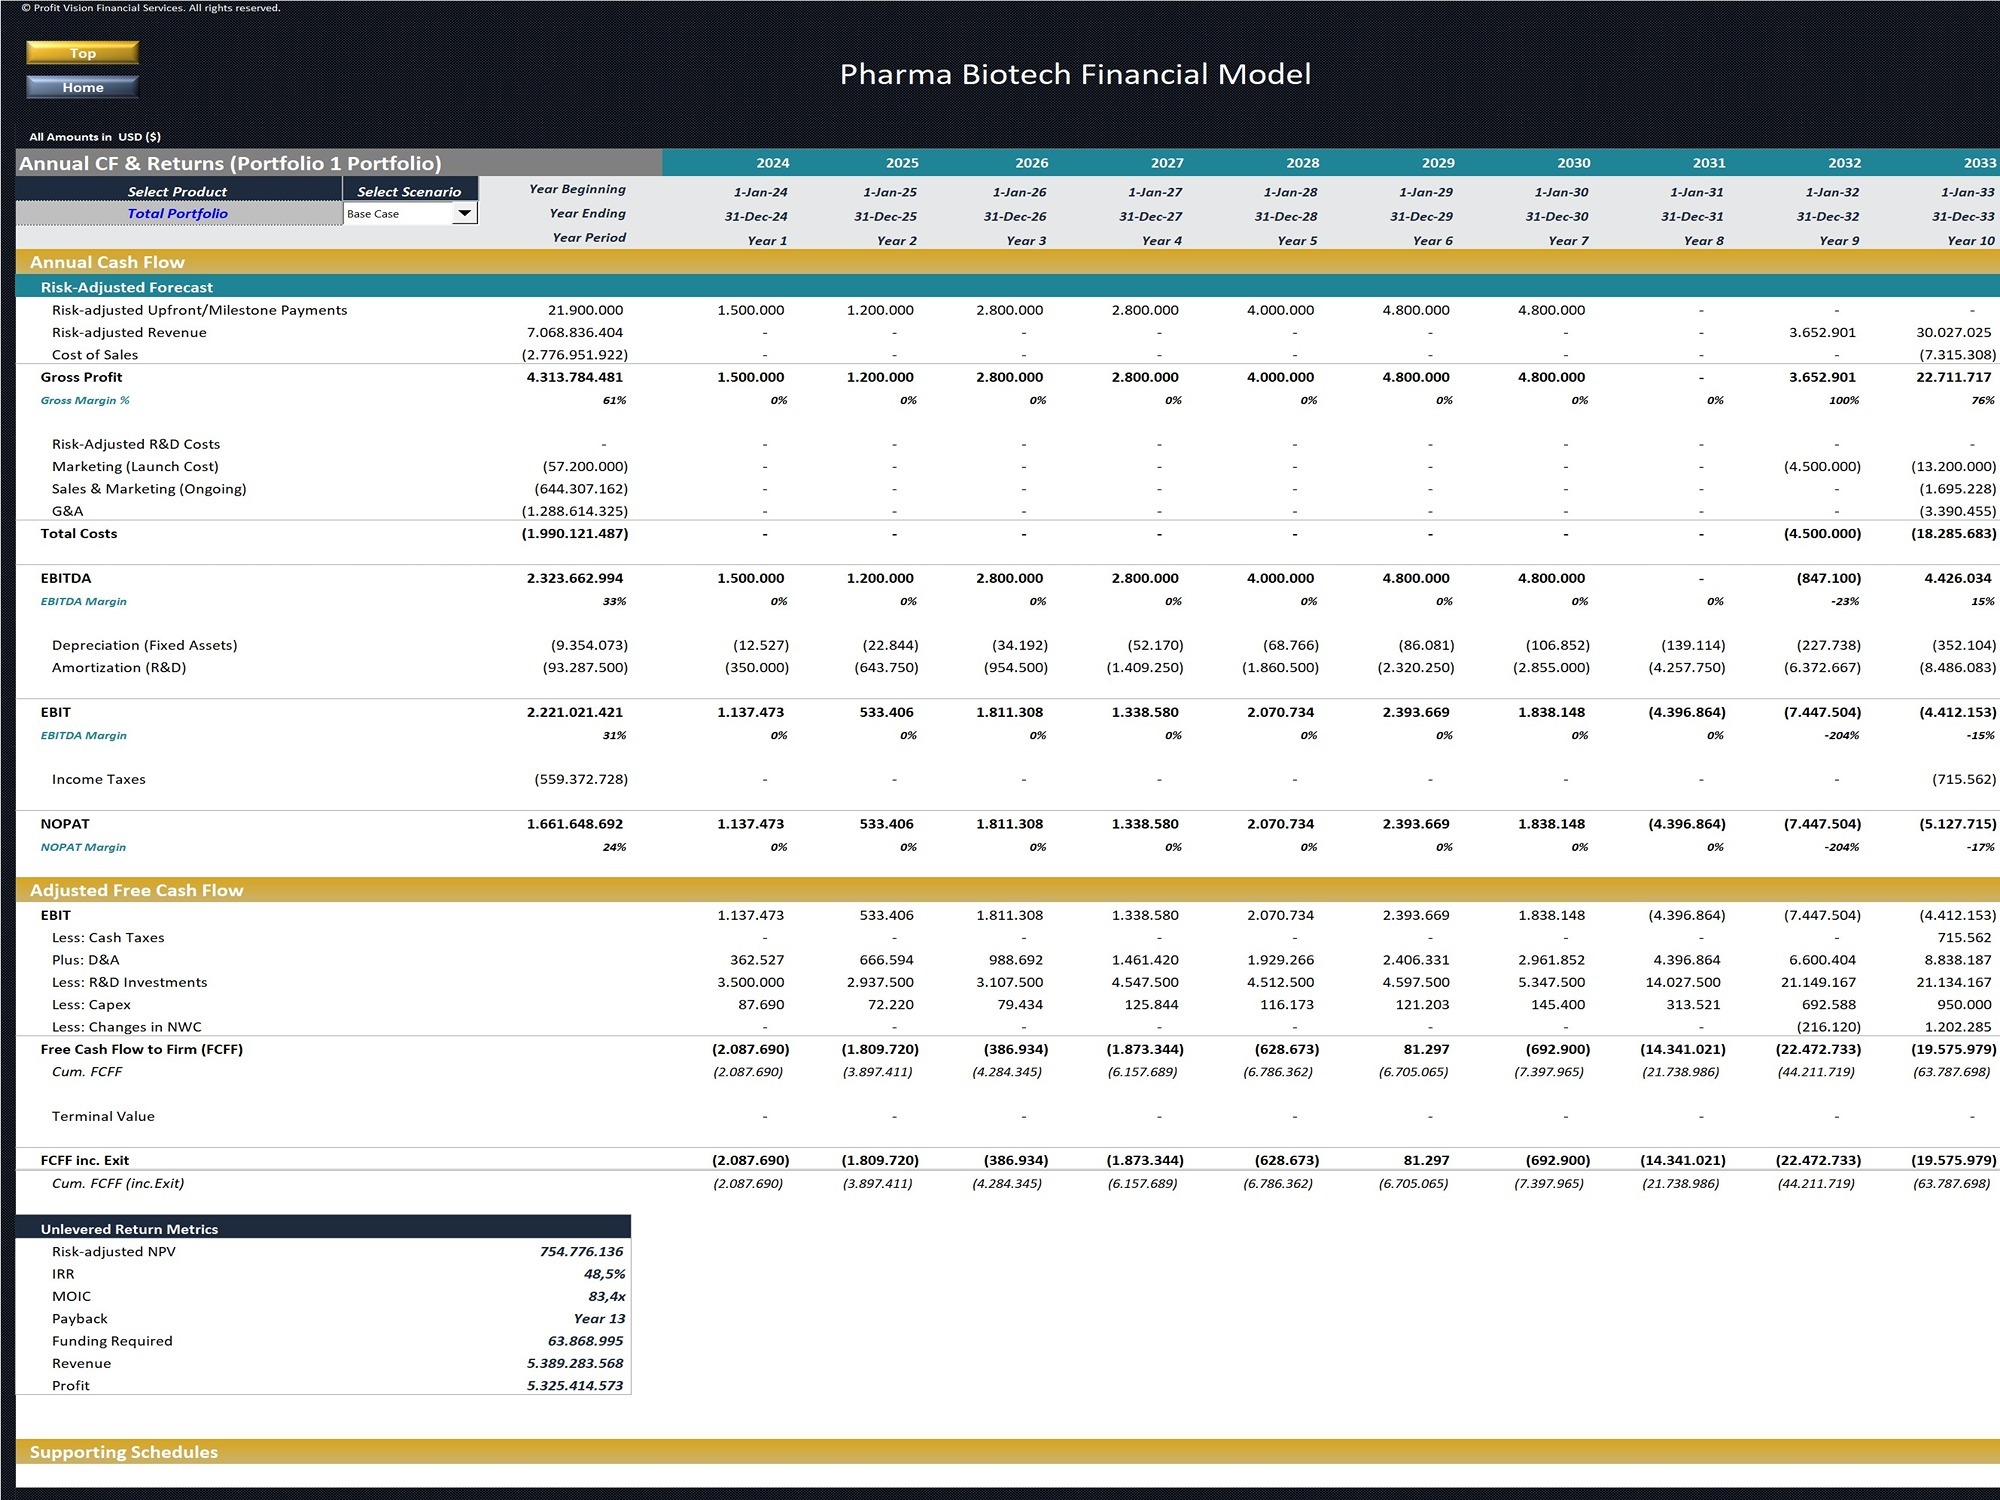
• Portfolios Analysis, Cash Flows & ReturnsAnalysis of each Portfolio per product and total portfolio level including Risk-Adjusted Forecast, Adjusted FCFF, Terminal Value, and Unlevered Return Metrics (rNPV, IRR, MOIC, etc) and Supporting Schedules for R&D Risk-Adjusted Costs and Working Capital.
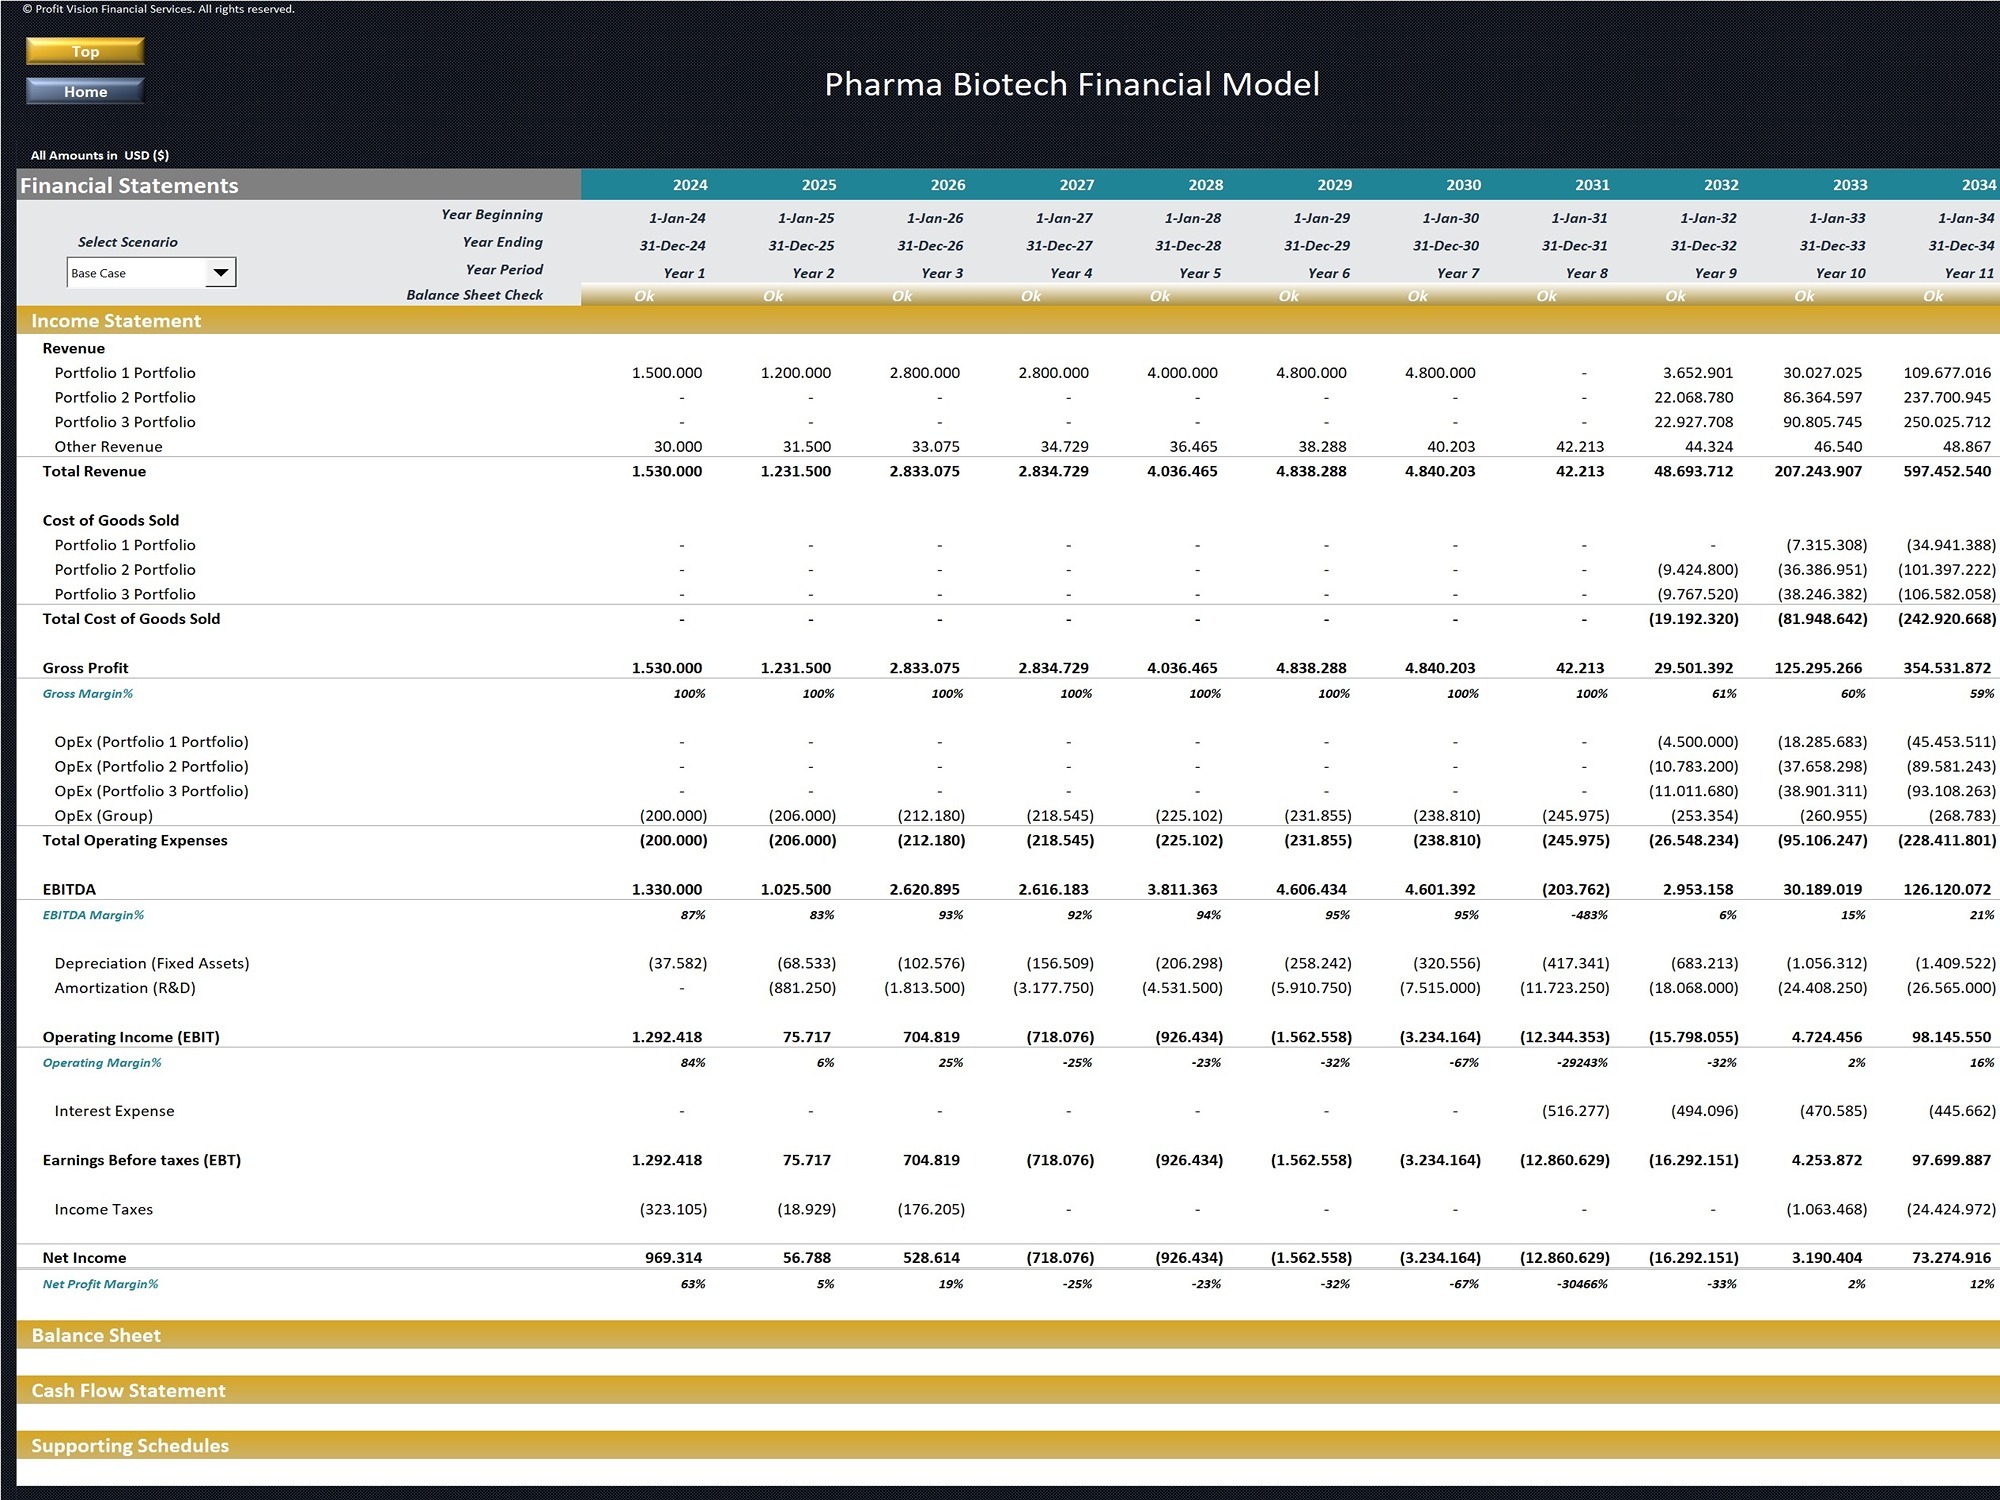
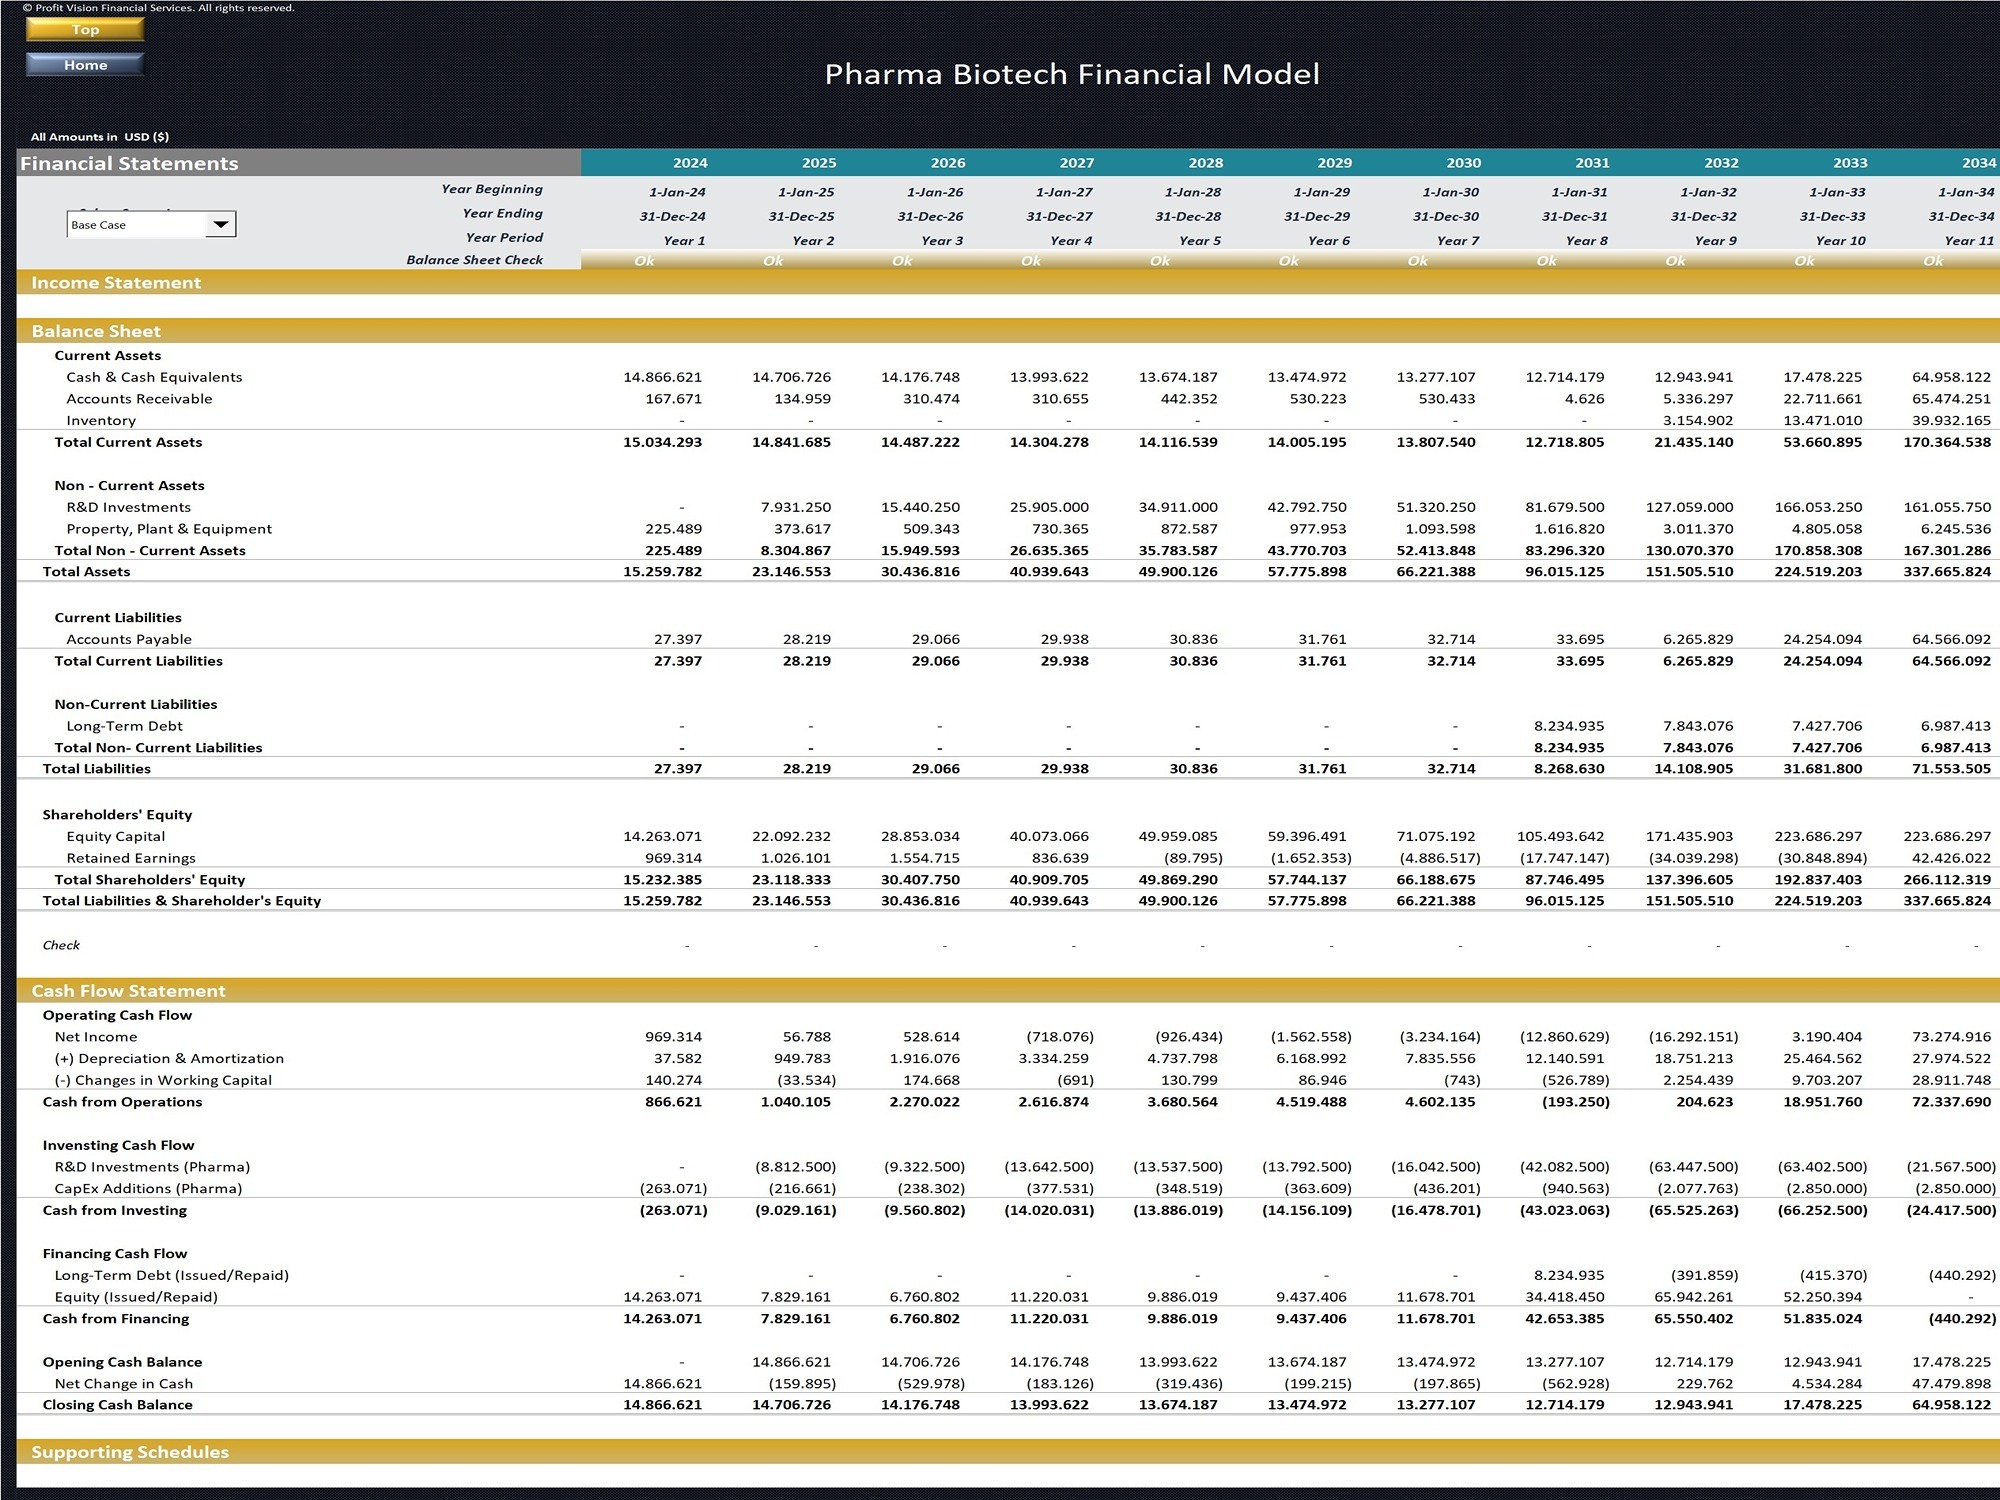
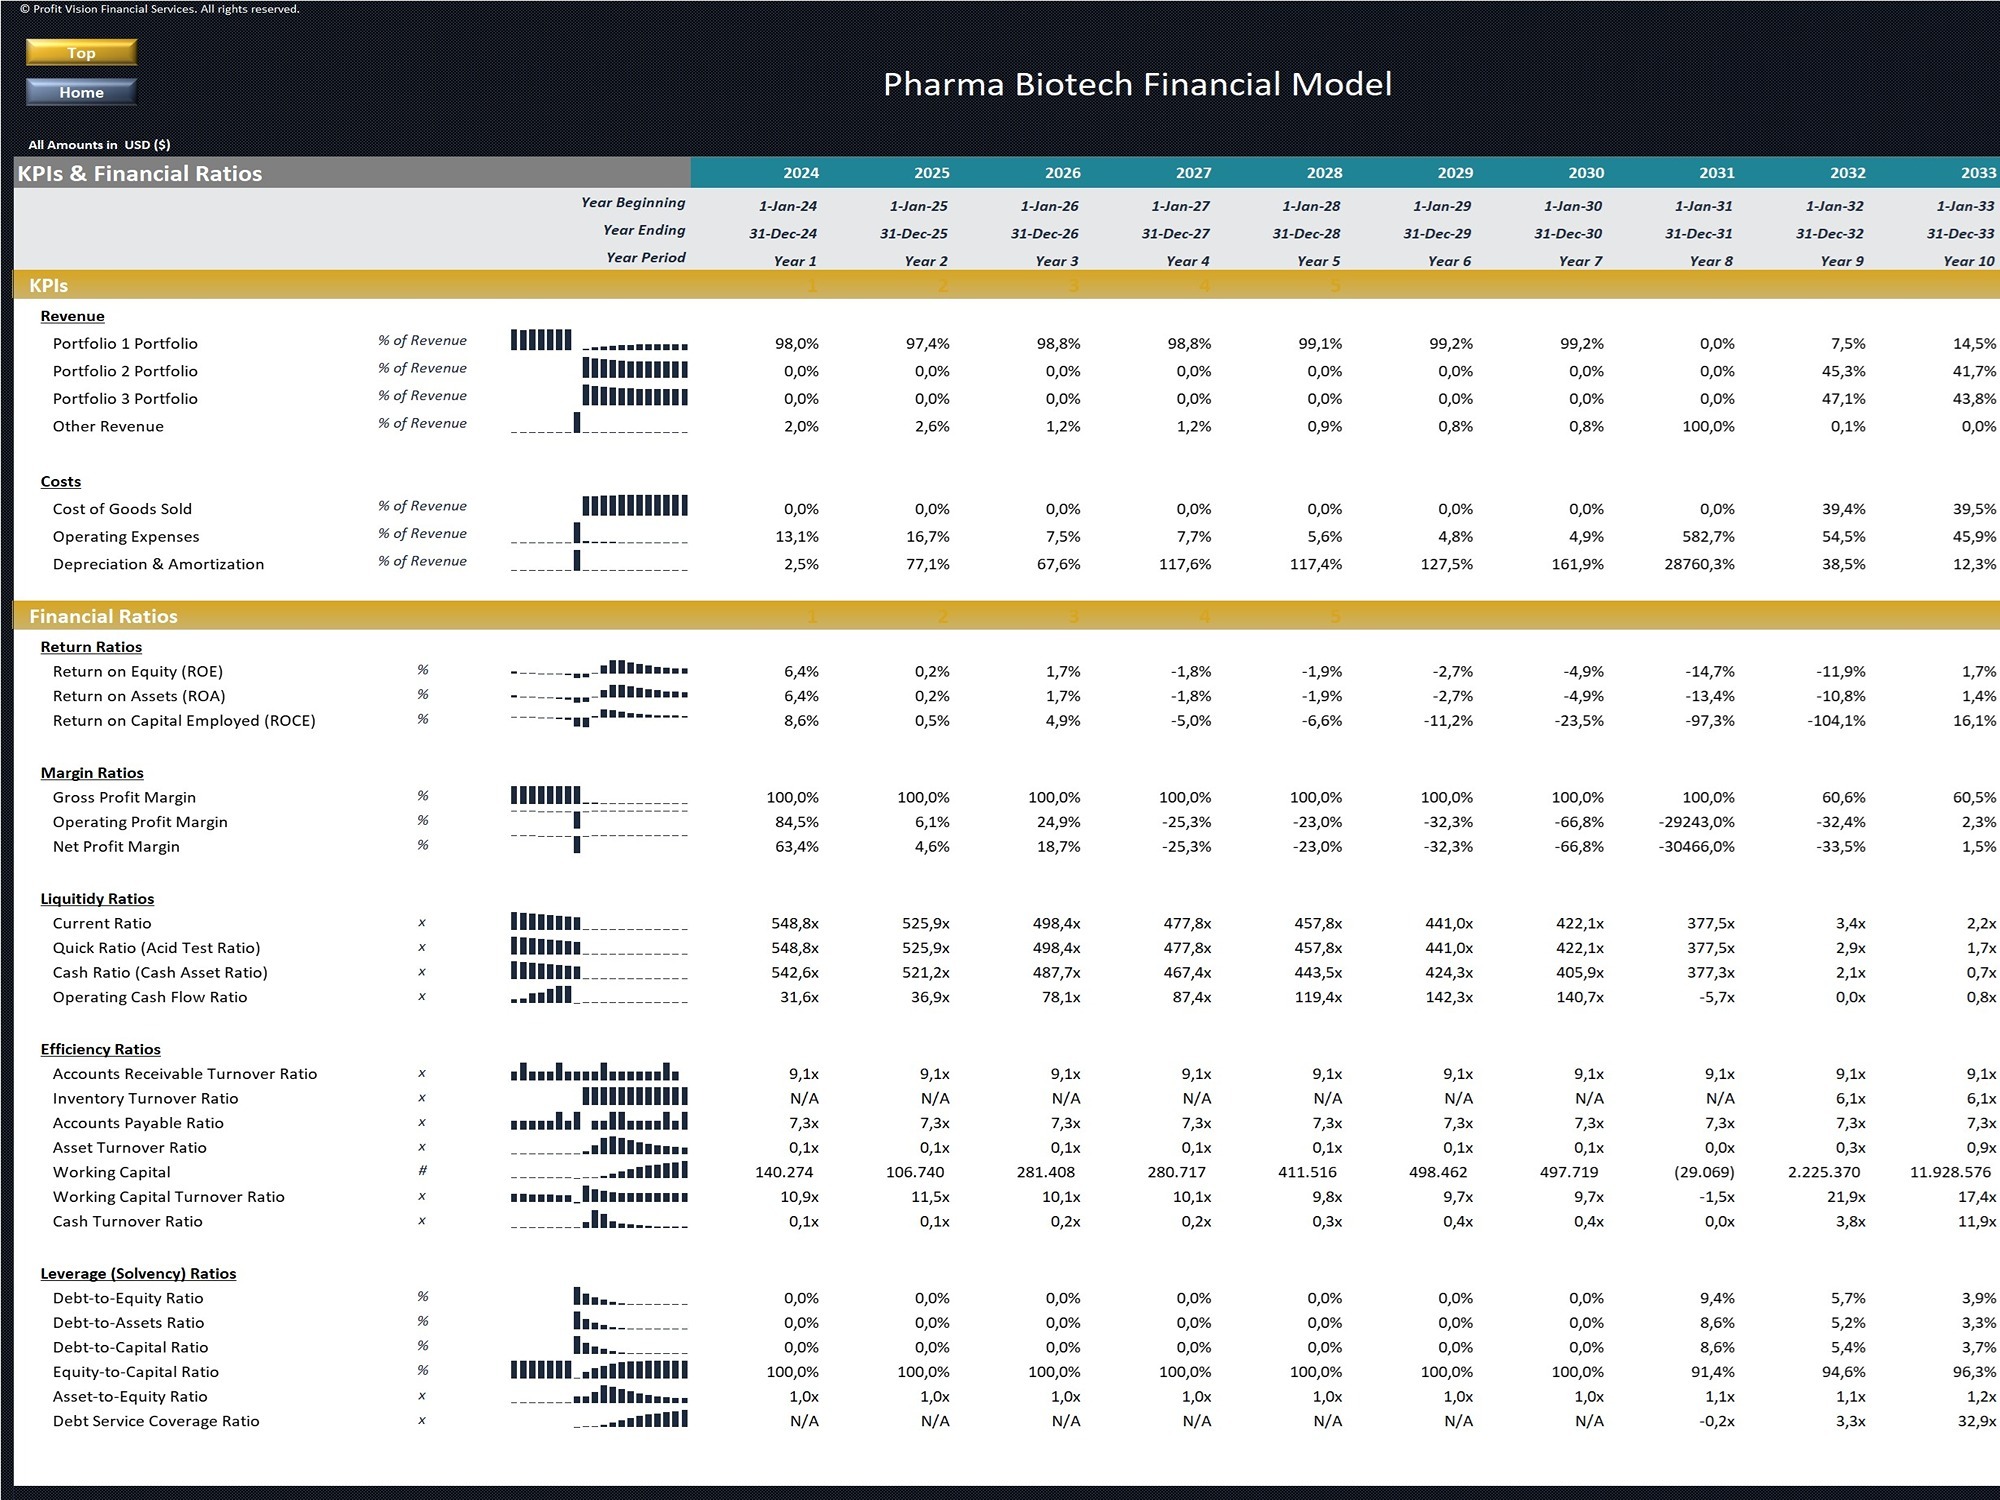
• Group Consolidated Reports
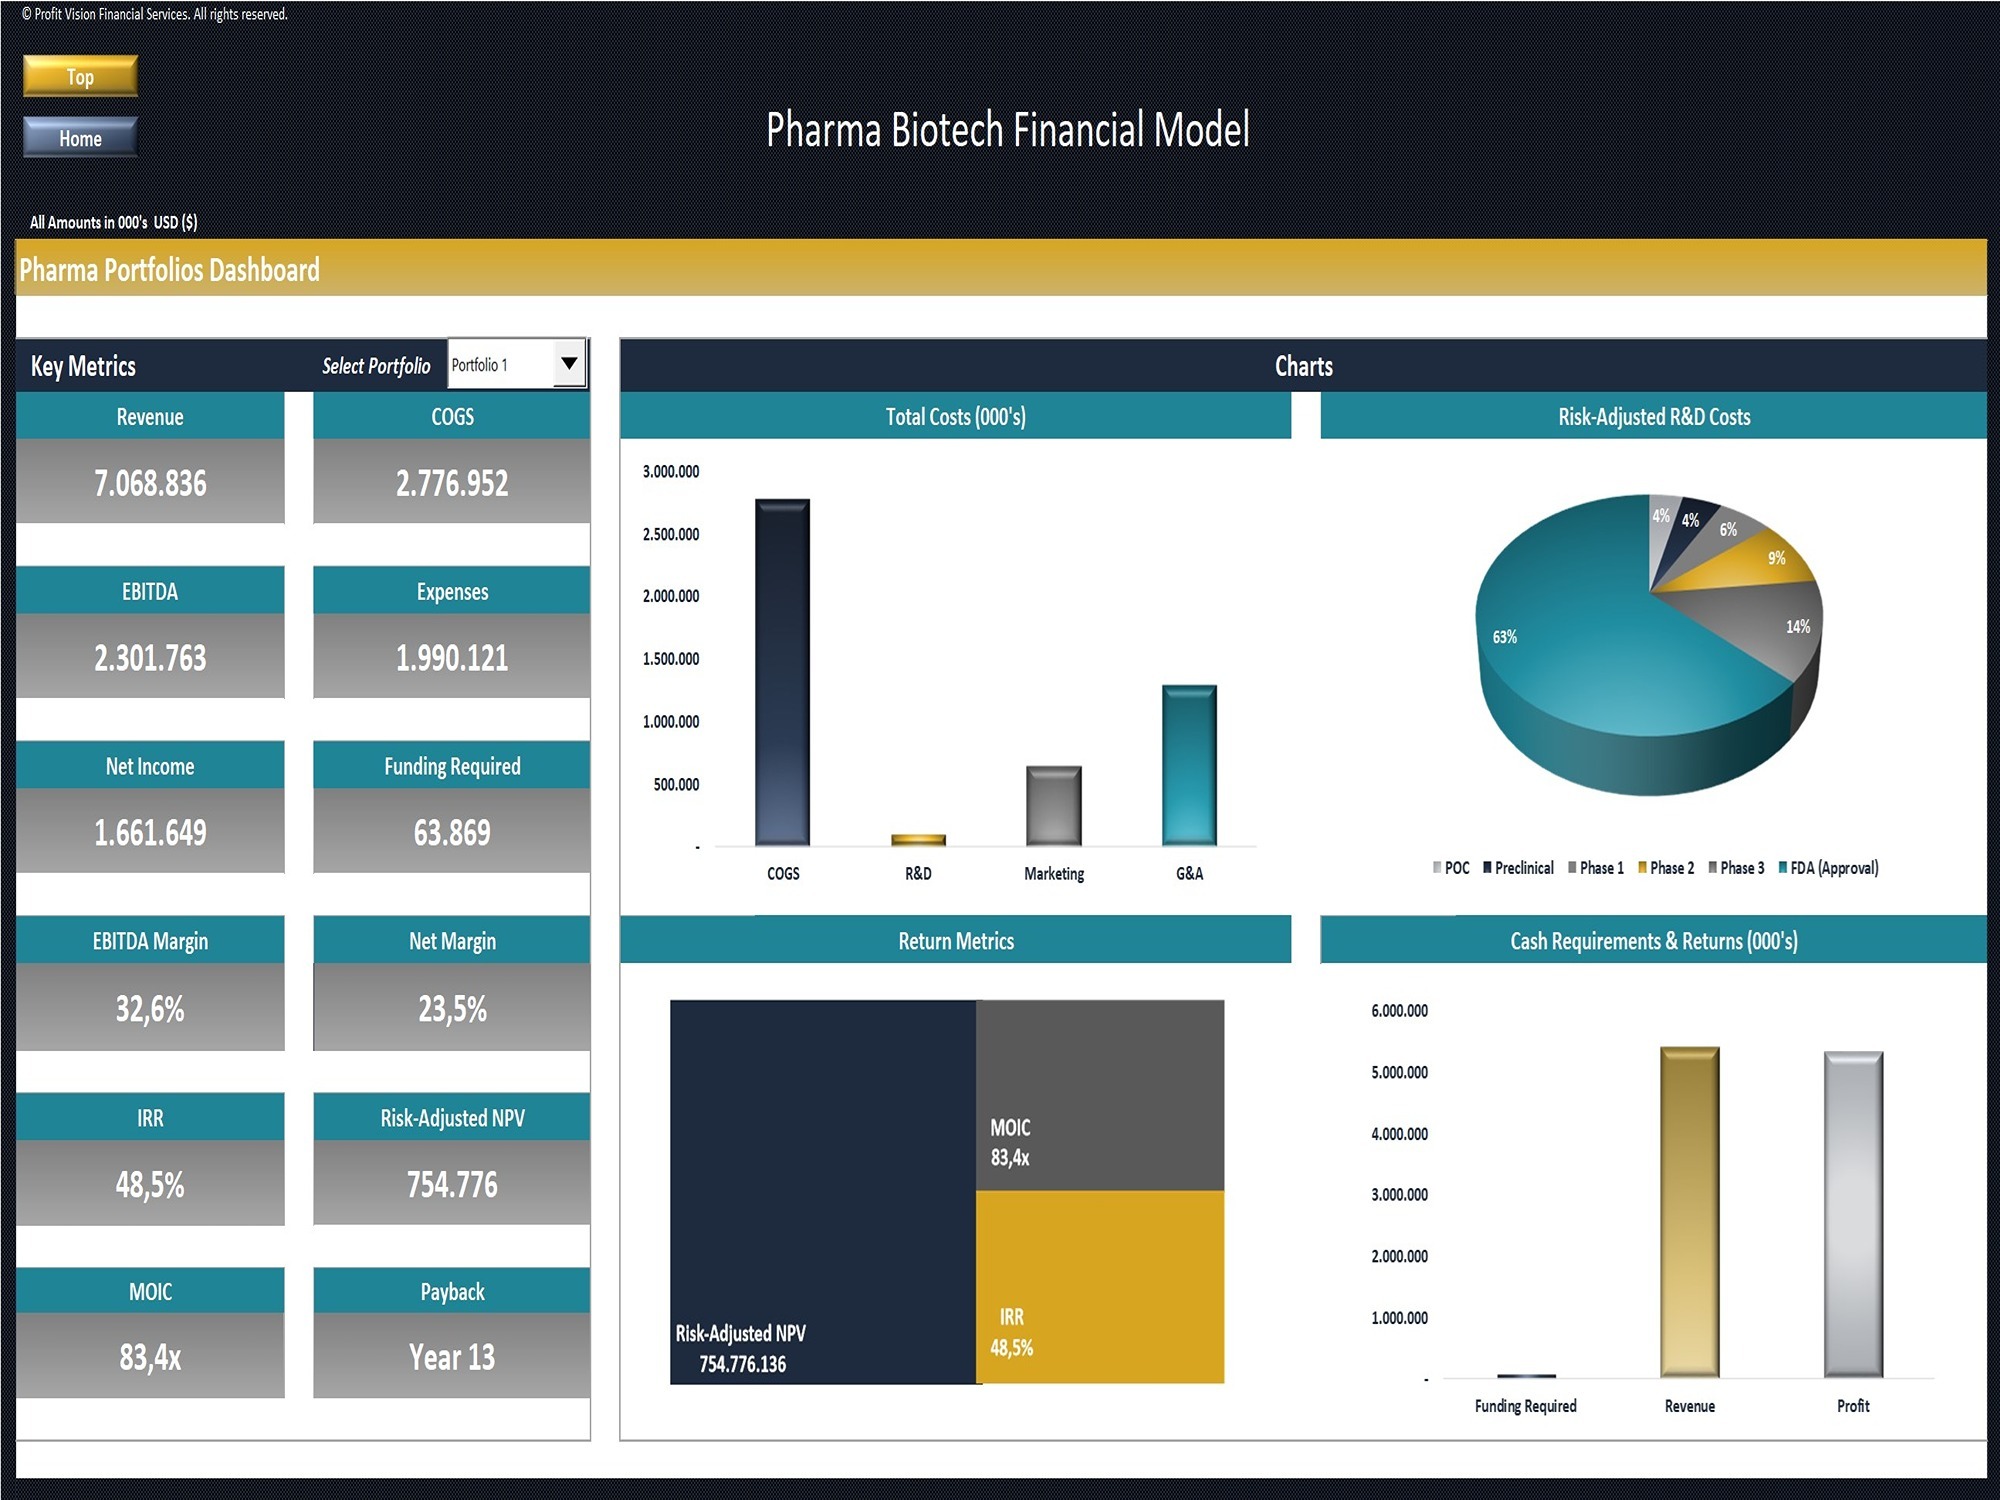
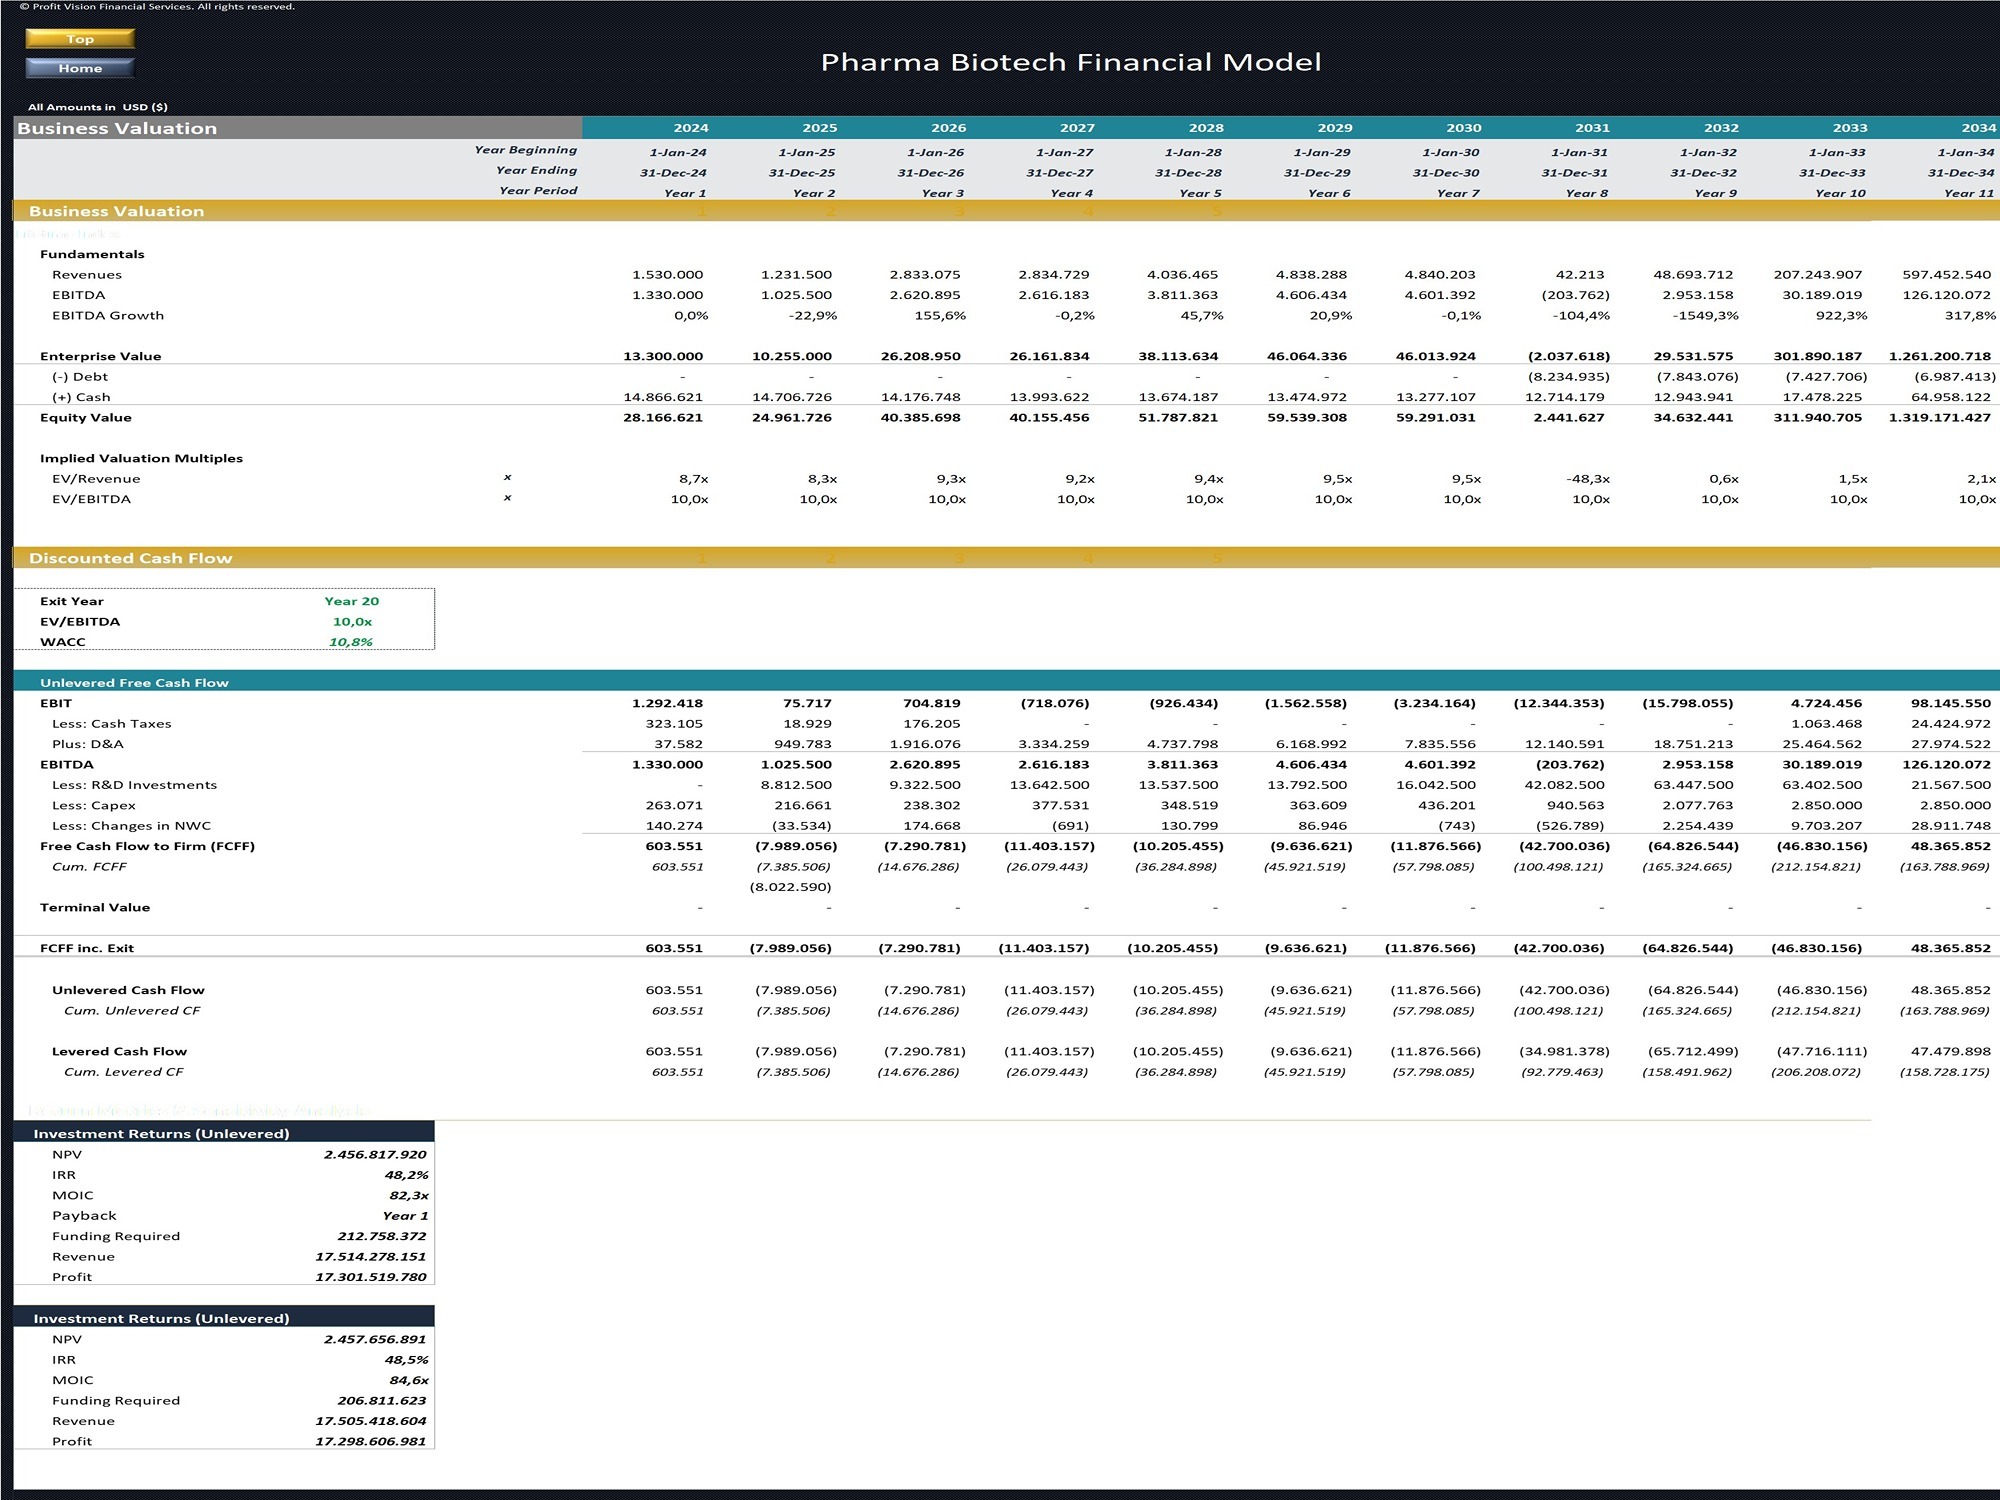
Consolidation of all portfolios at a Group Level presented on Financial Statements built using 3 Statement Model. The model provides also a KPIs and Financial Ratios report, Performance Dashboard per portfolio and a Group Valuation including DCF, Terminal Value, Unlevered, and Levered Cash Flows and Return Metrics (NPV, IRR, MOIC, etc.)
• Venture Capital Valuation
VC Valuation analysis including Discounted Equity Value, Pre/Post Money Valuation, Fundraising Analysis per Investor (Invested Amount, FD Shares Outstanding, Share Price) and Investors Returns (Dividends Payout, Profit, IRR, MOIC)
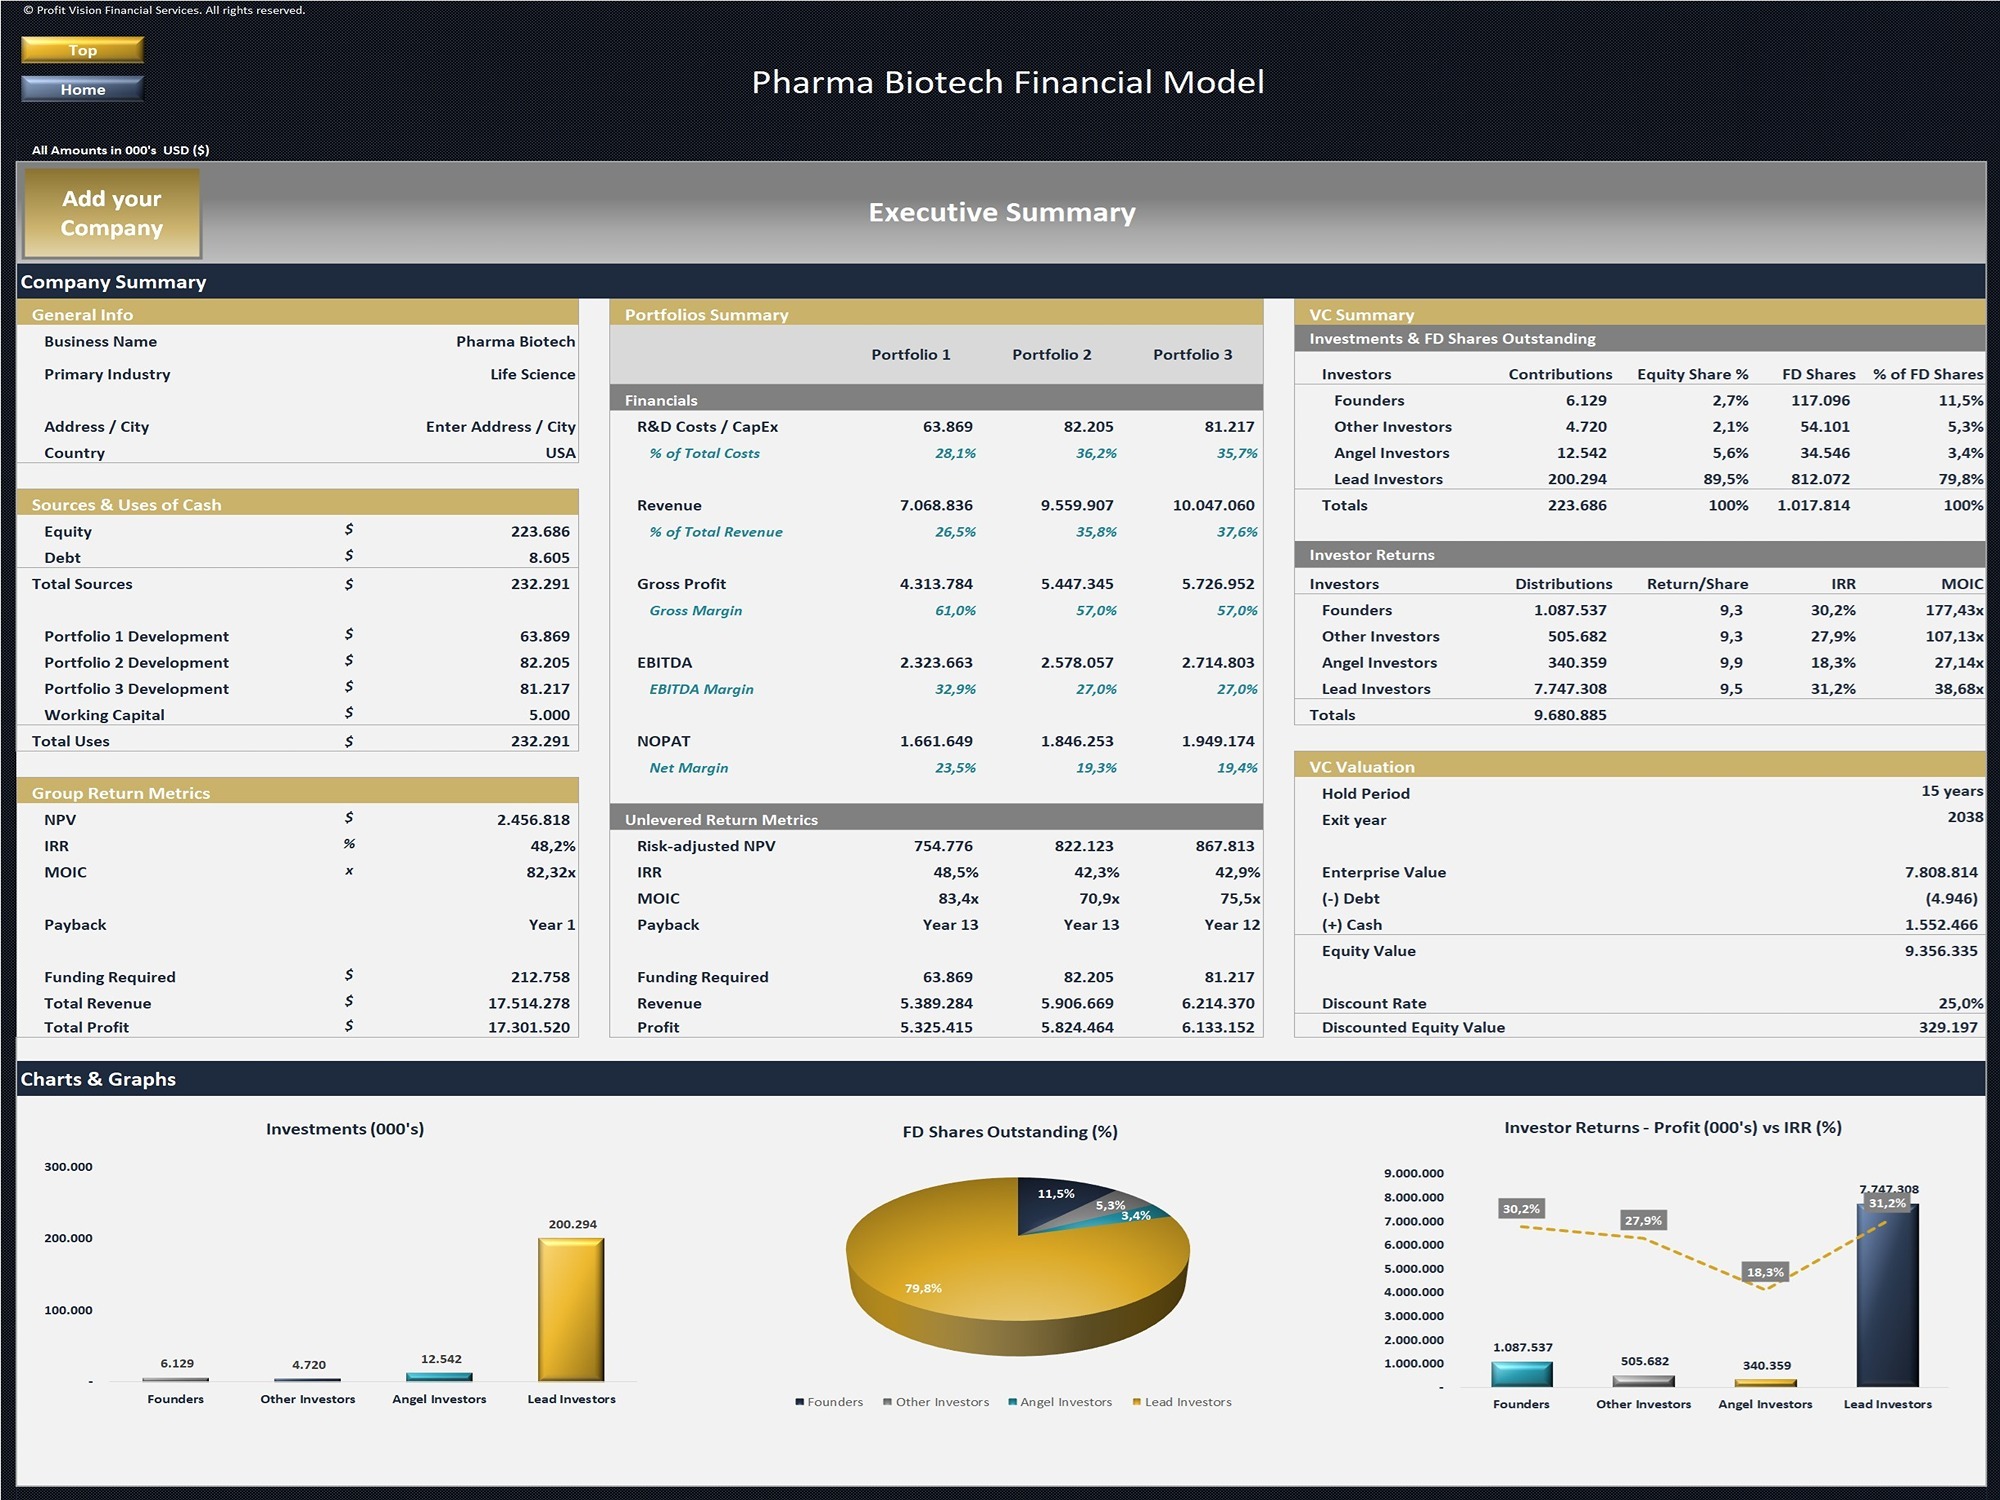
• Executive Summary Report
Company's Performance Summary designed to be easy to read, print, and save to pdf.
Help & Support
Committed to high quality and customer satisfaction, all our templates follow best practice financial modeling principles and are thoughtfully and carefully designed, keeping the user’s needs and comfort in mind.
No matter if you have no experience or you are well versed in finance, accounting, and the use of Microsoft Excel, our professional financial models are the right tools to boost your business operations!
If you however experience any difficulty while using this template and you are not able to find the appropriate guidance in the provided instructions, please feel free to contact us for assistance.
If you need a template customized for your business requirements, please e-mail us and provide a brief explanation of your specific needs.
New Versions Features:
The new version includes 3 portfolios of products. Each portfolio includes up to 10 products and up to 30 different coutries for products distribution.
The new versions also include assumptions for Milestone and Upfront Payments for each product and Scenarios (Base, Upside, Downside) for Market Share penetration and LOA (Likelihood of Approval).
Financial Model presenting a business scenario of a Pharma / Biotech Company with 3 portfolios including 10 different types of products, each representing a potential market opportunity.
The model analyzes the NPV of each portfolio/product using a Risk-Adjusted DCF Valuation methodology after taking into consideration the different development risks and probability of success across 6 different development phases (Proof of Concept, Preclinical, Phase I, Phase II, Phase III, Approval).
The CF analysis of each portfolio is added together along with various Operating Expenses and Financing Assumptions to produce Group's Consolidated Financial Statements and come up with Business Unlevered and Levered Return Metrics (rNPV, IRR, MOIC, etc.).
Revenue is earned either through direct sale of the product or through product licensing and is forecasted using assumptions on product/portfolio potential market penetration, expected peak sales, sale price, royalty rates, etc.
The model includes Development timing assumptions per product from Preclinical to Market phases, Research & Development Costs per product and development phase, Pre and Post Market Capital Expenditures, and direct & indirect Operating Expenses.
Finally the model provides a Venture Capital Valuation and Fundraising Analysis including Discounted Equity Value, Pre/Post Money Valuation, Fundraising per Investor (Invested Amount, FD Shares Outstanding, Share Price) and Investors Returns (Dividends Payout, Profit, IRR, MOIC).
The structure of the template follows Financial Modeling Best Practices principles and is fully customizable.
Model Structure:
• General Setup
The General Setup tab contains all the high-level assumptions necessary for the overall functionality of the model including General Business Info, Timing and Currency, Portfolio(s) Data, Depreciation & Amortization, Income Tax Rate, Working Capital, Group Level Other Revenue & OpEx, Financing, and VC Assumptions
• WACC & Comps
Calculation of Weighted Average Cost of Capital using Comparable Companies Table to calculate Beta.
• Portfolios Data Products development and revenue assumptions including Market penetration data, Sale Price, Sale Method (Direct or License), Development phases timing and costs, COGS & OpEx, Pre/Post Market Capital Expenditures, Probability of Success (POS) rates, and LOA (Likelihood of Approval) calculation.
• Portfolios Analysis, Cash Flows & ReturnsAnalysis of each Portfolio per product and total portfolio level including Risk-Adjusted Forecast, Adjusted FCFF, Terminal Value, and Unlevered Return Metrics (rNPV, IRR, MOIC, etc) and Supporting Schedules for R&D Risk-Adjusted Costs and Working Capital.
• Group Consolidated Reports
Consolidation of all portfolios at a Group Level presented on Financial Statements built using 3 Statement Model. The model provides also a KPIs and Financial Ratios report, Performance Dashboard per portfolio and a Group Valuation including DCF, Terminal Value, Unlevered, and Levered Cash Flows and Return Metrics (NPV, IRR, MOIC, etc.)
• Venture Capital Valuation
VC Valuation analysis including Discounted Equity Value, Pre/Post Money Valuation, Fundraising Analysis per Investor (Invested Amount, FD Shares Outstanding, Share Price) and Investors Returns (Dividends Payout, Profit, IRR, MOIC)
• Executive Summary Report
Company's Performance Summary designed to be easy to read, print, and save to pdf.
Help & Support
Committed to high quality and customer satisfaction, all our templates follow best practice financial modeling principles and are thoughtfully and carefully designed, keeping the user’s needs and comfort in mind.
No matter if you have no experience or you are well versed in finance, accounting, and the use of Microsoft Excel, our professional financial models are the right tools to boost your business operations!
If you however experience any difficulty while using this template and you are not able to find the appropriate guidance in the provided instructions, please feel free to contact us for assistance.
If you need a template customized for your business requirements, please e-mail us and provide a brief explanation of your specific needs.
This Best Practice includes
Excel Financial Model
Further information
Analyzes a Biopharmaceutical Company using a Risk-Adjusted NPV Valuation Methodology.
Currently the model supports 3 portfolios of 10 products and 30 countries for product's distribution (more can be added upon request)
