
Originally published: 27/03/2023 13:56
Publication number: ELQ-22936-1
View all versions & Certificate
Publication number: ELQ-22936-1
View all versions & Certificate

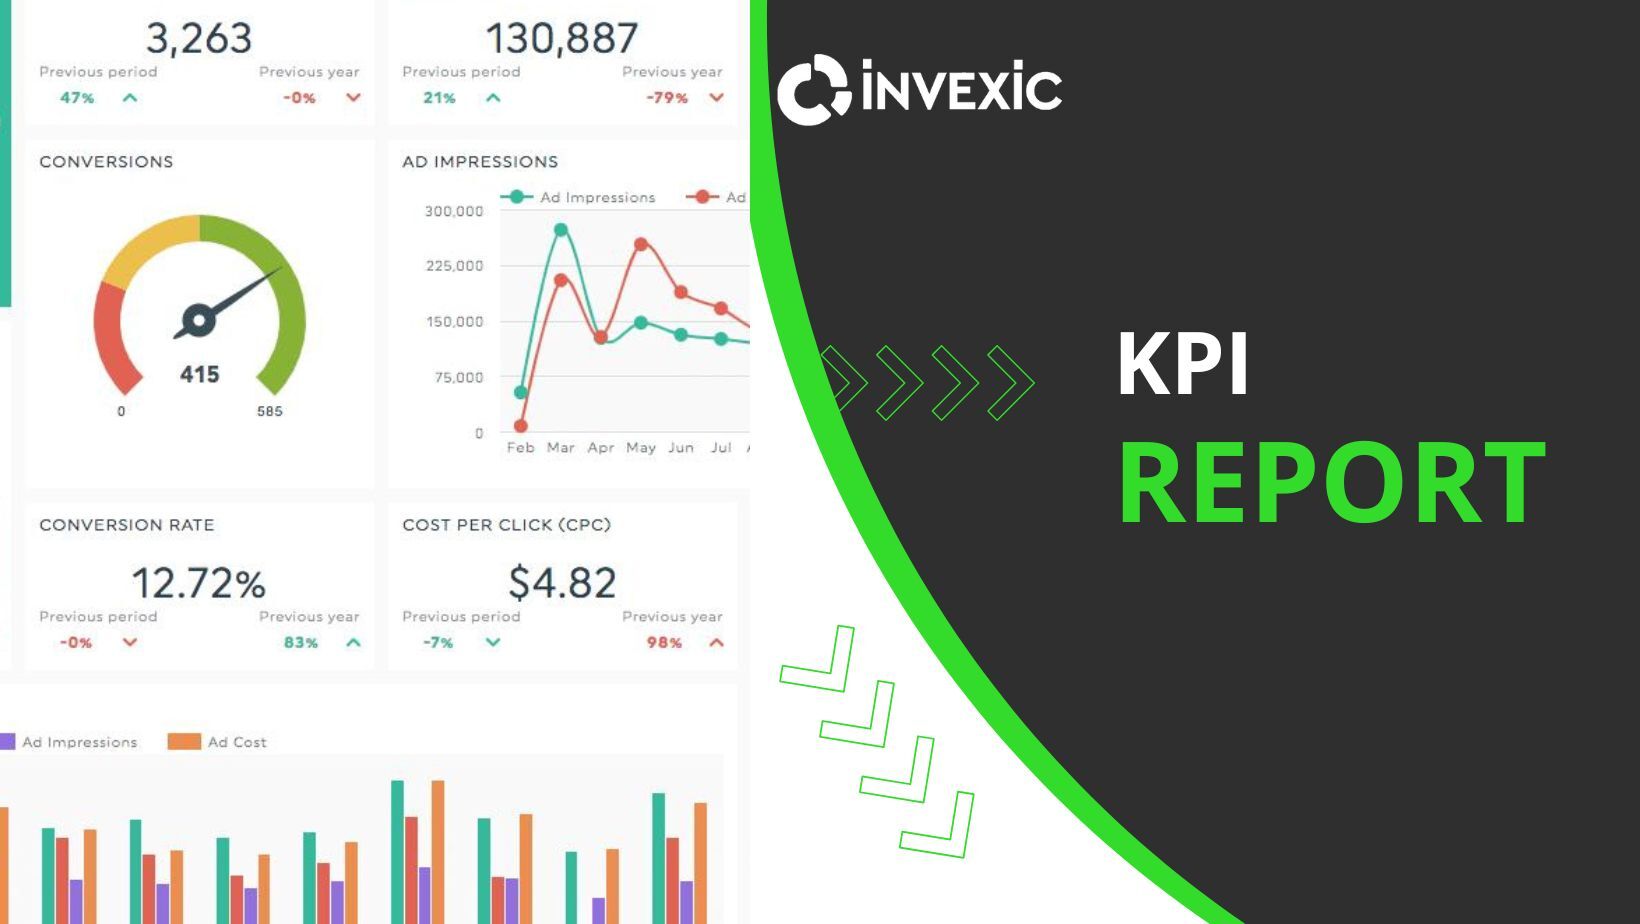
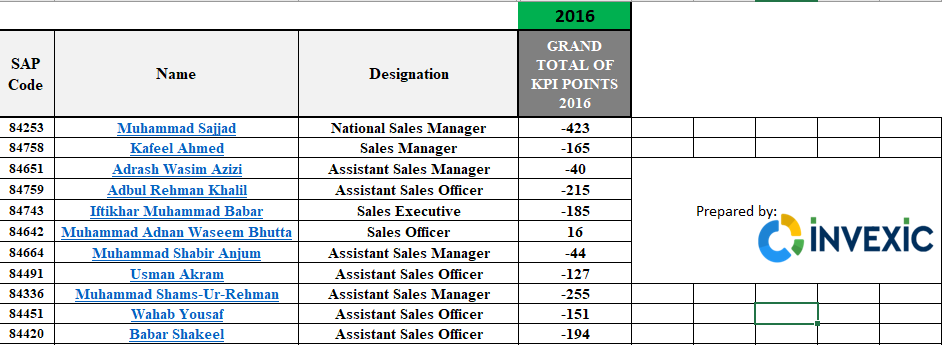
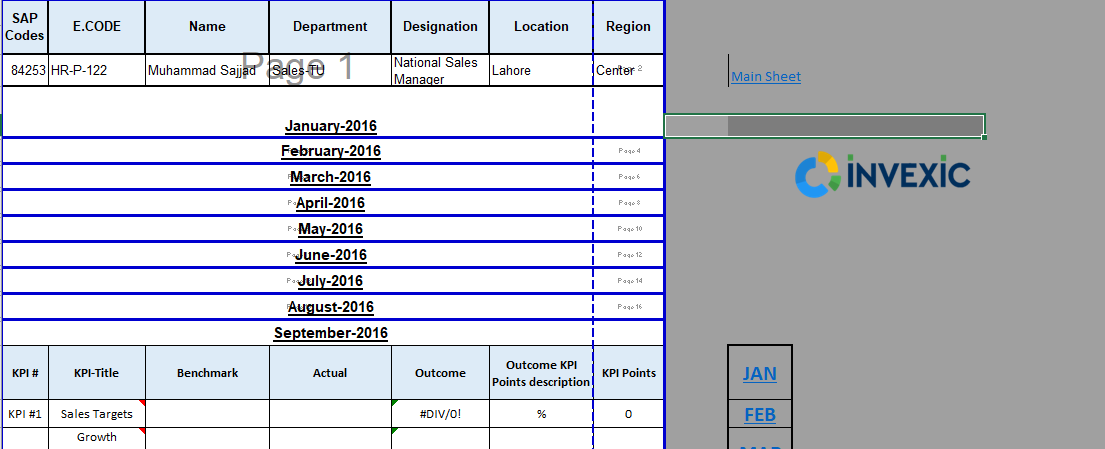
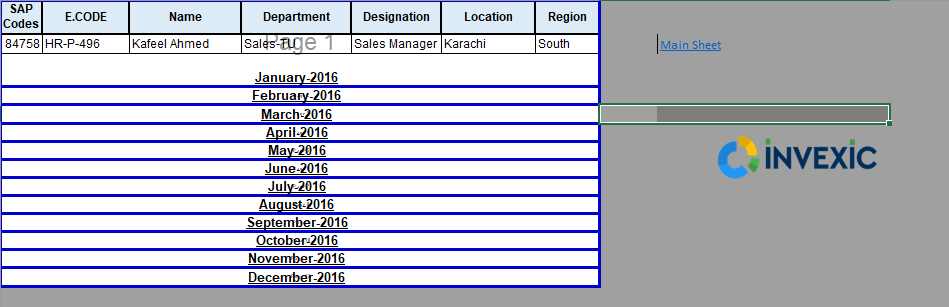
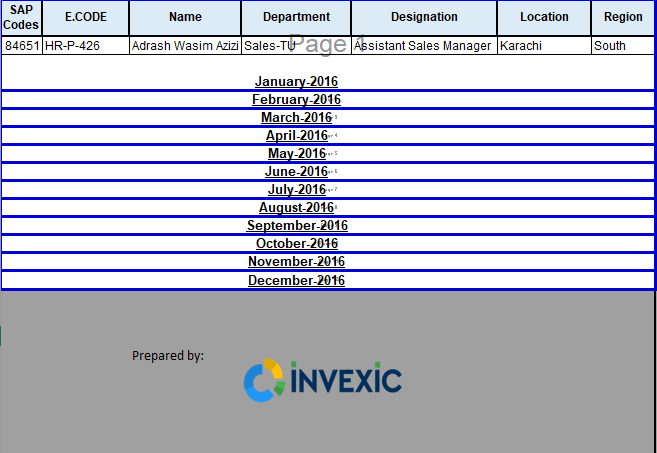
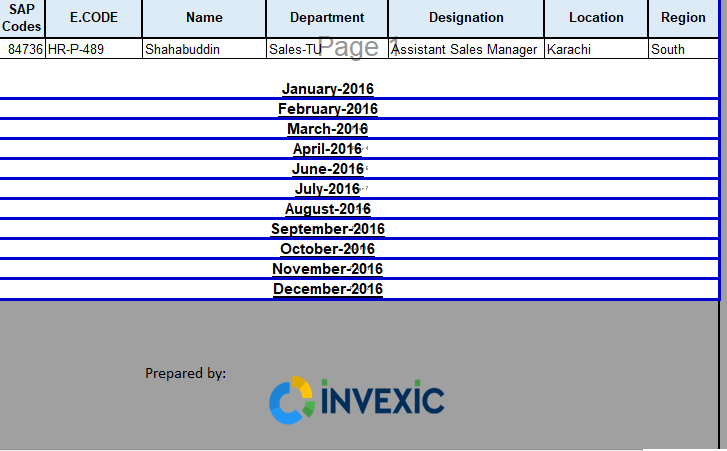
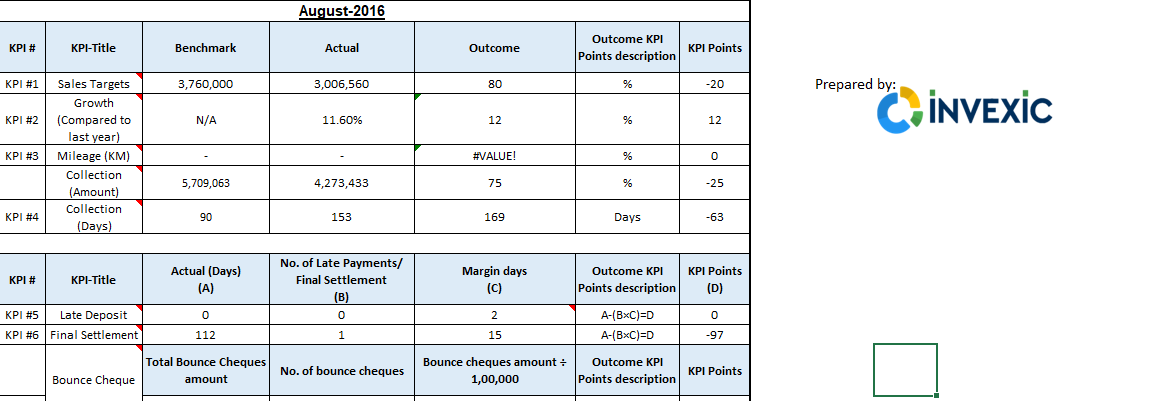
KPI Report
A KPI report allows business leaders to quickly and easily review and analyze key performance indicators (KPIs) and thereby know how their organization is.
Our mission is to be a top professional services firm by adhering to our core values which is integrity, objectivity, professional competence, development and maintenance of technical expertise and coFollow
