
Originally published: 14/04/2020 12:59
Last version published: 14/04/2020 15:58
Publication number: ELQ-80127-3
View all versions & Certificate
Last version published: 14/04/2020 15:58
Publication number: ELQ-80127-3
View all versions & Certificate

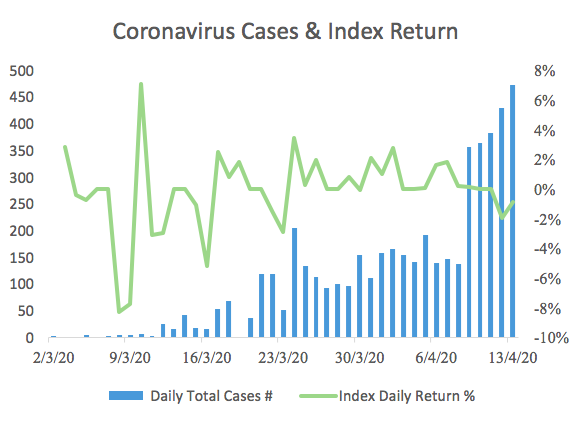
COVID-19 vs Index Return Excel Model
Analysis on index return in relation to Covid-19 cases.
