
Originally published: 05/12/2017 15:46
Publication number: ELQ-86400-1
View all versions & Certificate
Publication number: ELQ-86400-1
View all versions & Certificate

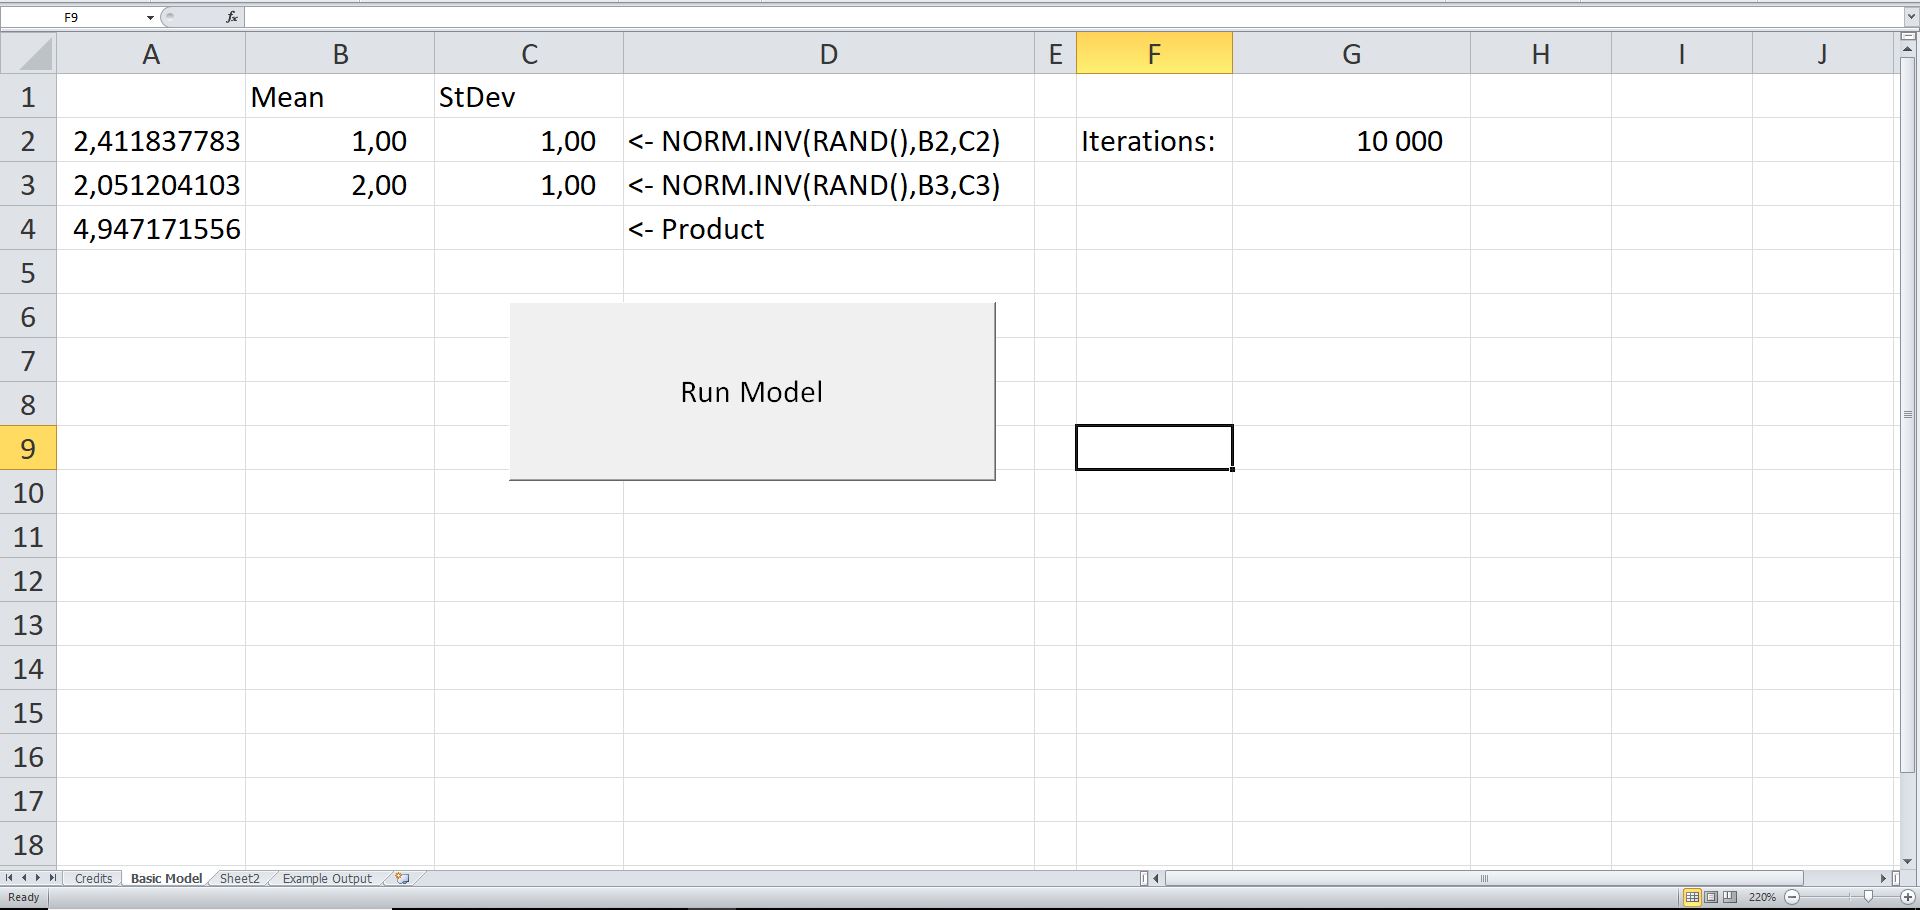
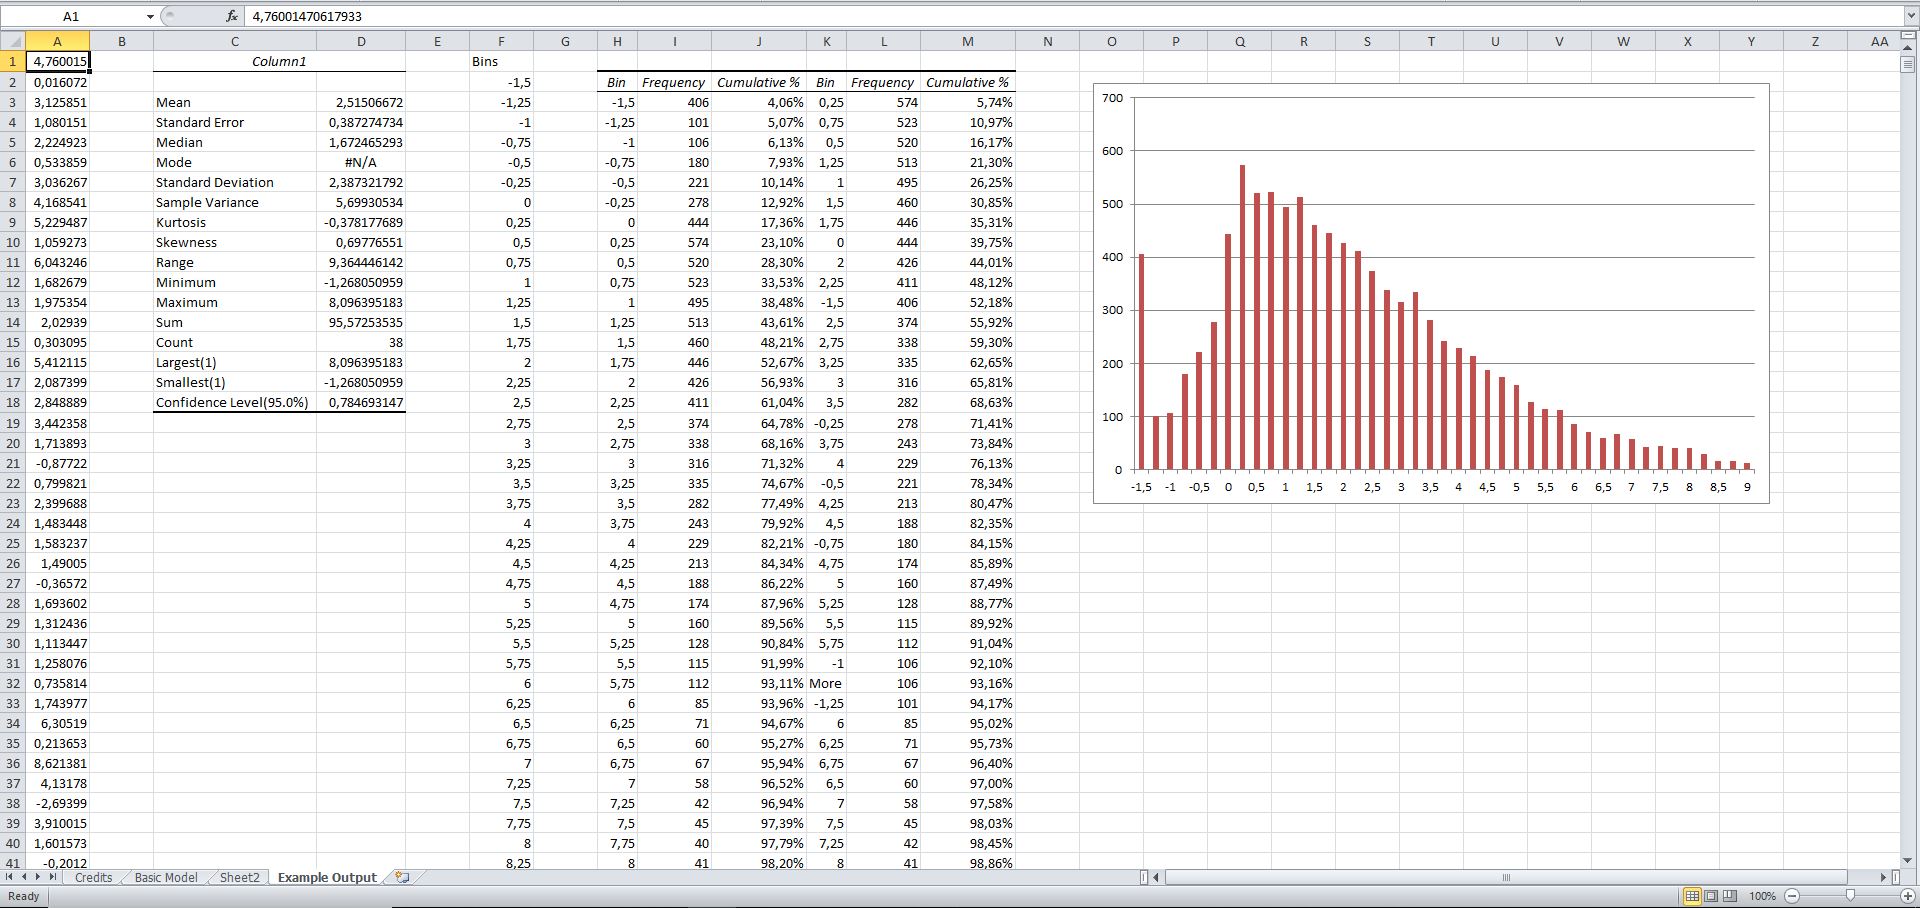
Monte Carlo Simulation Excel Model
Monte Carlo Model generated in excel with explanatory article included to guide you block-by-block through the code.
