Statistical Analysis Dashboard - v.2
Originally published: 10/01/2024 09:25
Last version published: 09/09/2026 12:18
Publication number: ELQ-75602-6
View all versions & Certificate
certified

Statistical Analysis Dashboard - v.2

Unlock powerful insights with this all-in-one statistical dashboardโ€”ideal for researchers, analysts, and decision-makers seeking clarity from complex data.

Description

๐Ÿ“Š Statistical Analysis Dashboard v2 โ€” Interactive HTML File
By Data'sOk
โ”โ”โ”โ”โ”โ”โ”โ”โ”โ”โ”โ”โ”โ”โ”โ”โ”โ”โ”โ”โ”โ”โ”โ”
A complete statistical toolkit. Drop in a CSV, get real analysis โ€” not just a pretty chart.
This is the second generation of the very first tool Data'sOk ever built. The original was an Excel dashboard for descriptive stats, correlation, and regression. This version keeps everything that worked and adds the things Excel was never going to do well: an interactive correlation heatmap, proper outlier detection and one-click cleanup, automatic forecasting with method comparison, and a full hypothesis-testing suite โ€” all in a single file that opens in any browser.
No macros. No add-ins. No subscription. Upload a CSV, and you have a working analysis in under a minute.
โ”โ”โ”โ”โ”โ”โ”โ”โ”โ”โ”โ”โ”โ”โ”โ”โ”โ”โ”โ”โ”โ”โ”โ”
WHAT YOU GET
7 analysis tabs, all driven by your own data:
๐Ÿ“ Data
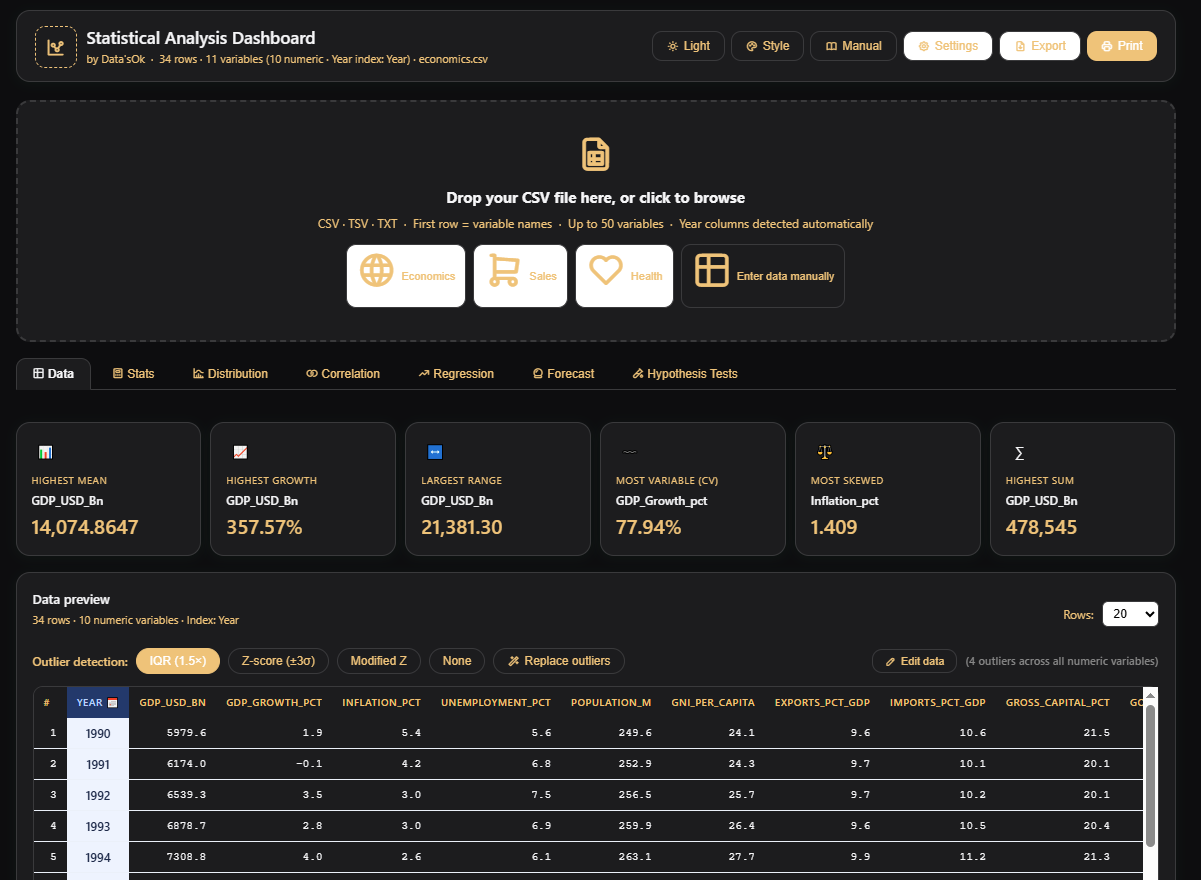
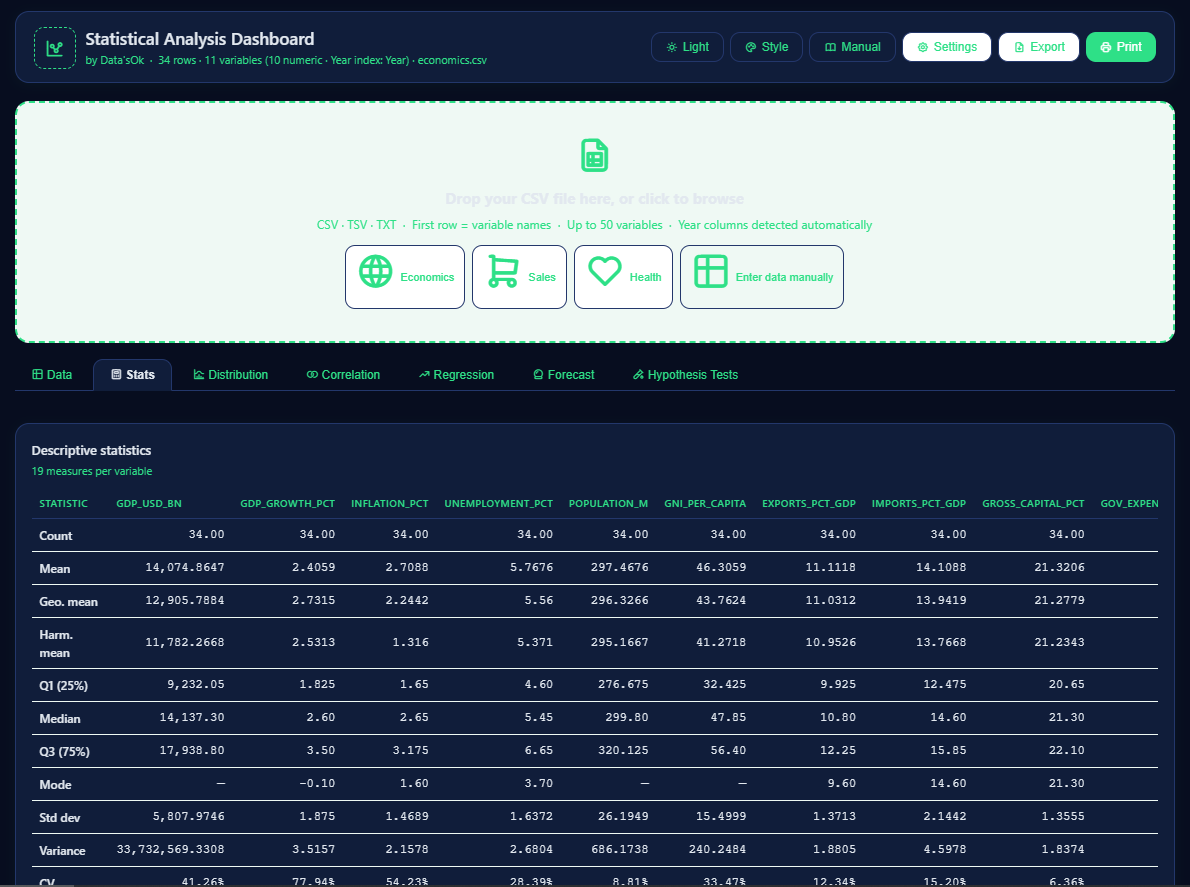
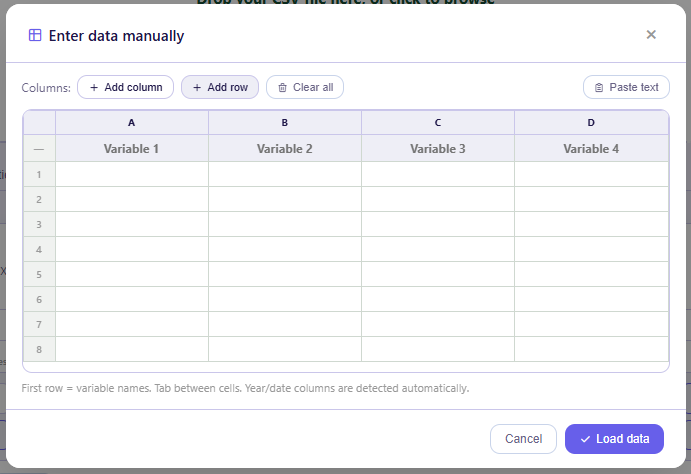
Drag-and-drop CSV upload, or paste/type data directly into a spreadsheet-style grid. Year/date columns are detected automatically and excluded from statistics. Sortable columns. Built-in outlier detection (IQR, Z-score, or Modified Z-score) with one-click replacement via linear interpolation.
๐Ÿ“Š Descriptive Statistics
19 measures per variable โ€” mean, geometric mean, harmonic mean, quartiles, mode, standard deviation, variance, coefficient of variation, skewness, kurtosis, growth rates, and more. Sortable table, variable comparison chart, and a CV ranking chart to spot your most volatile variables instantly.
๐Ÿ“ˆ Distribution
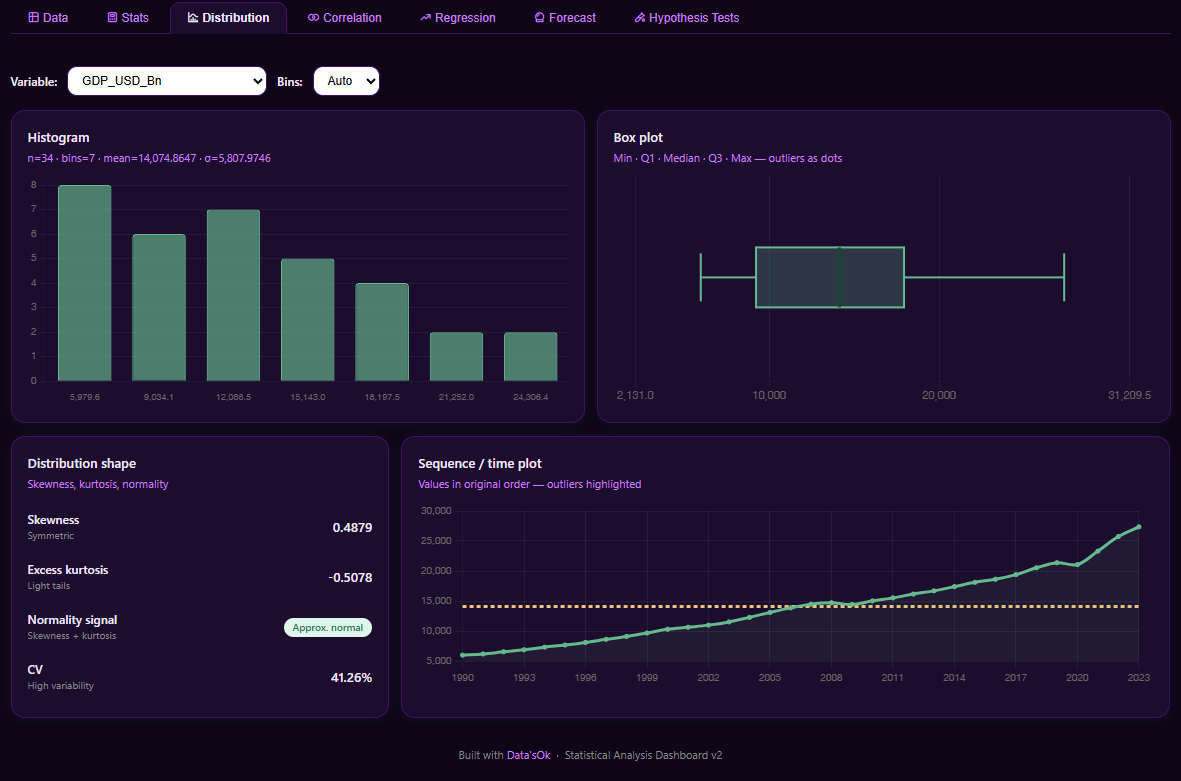
Histogram with adjustable bins, a properly rendered box plot with outliers marked, a sequence/time plot, and an automatic shape analysis (skewness, kurtosis, normality signal) in plain language.
๐Ÿ”— Correlation
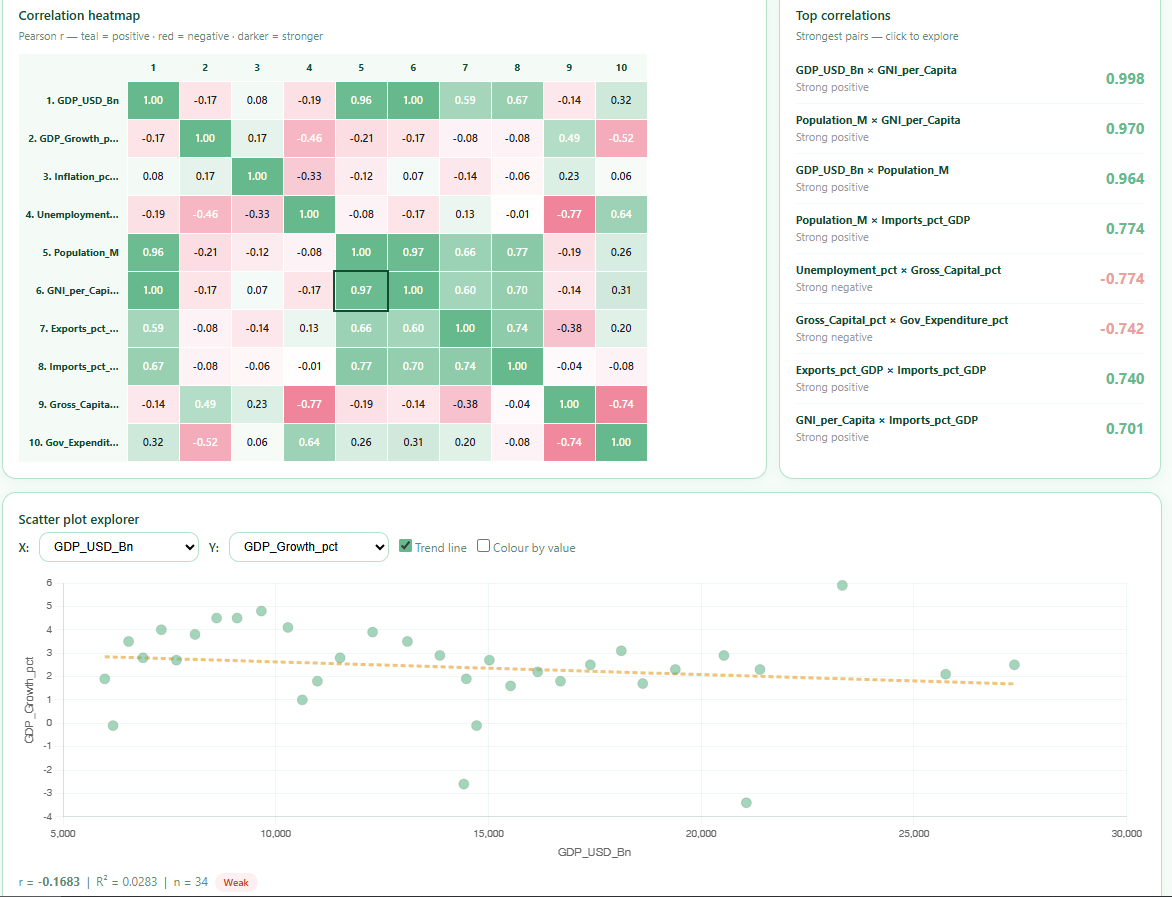
Click any cell on the interactive heatmap to instantly plot that pair's scatter diagram. Trend line, Rยฒ, p-value, and strength rating included. Top-correlations panel surfaces your strongest relationships automatically.
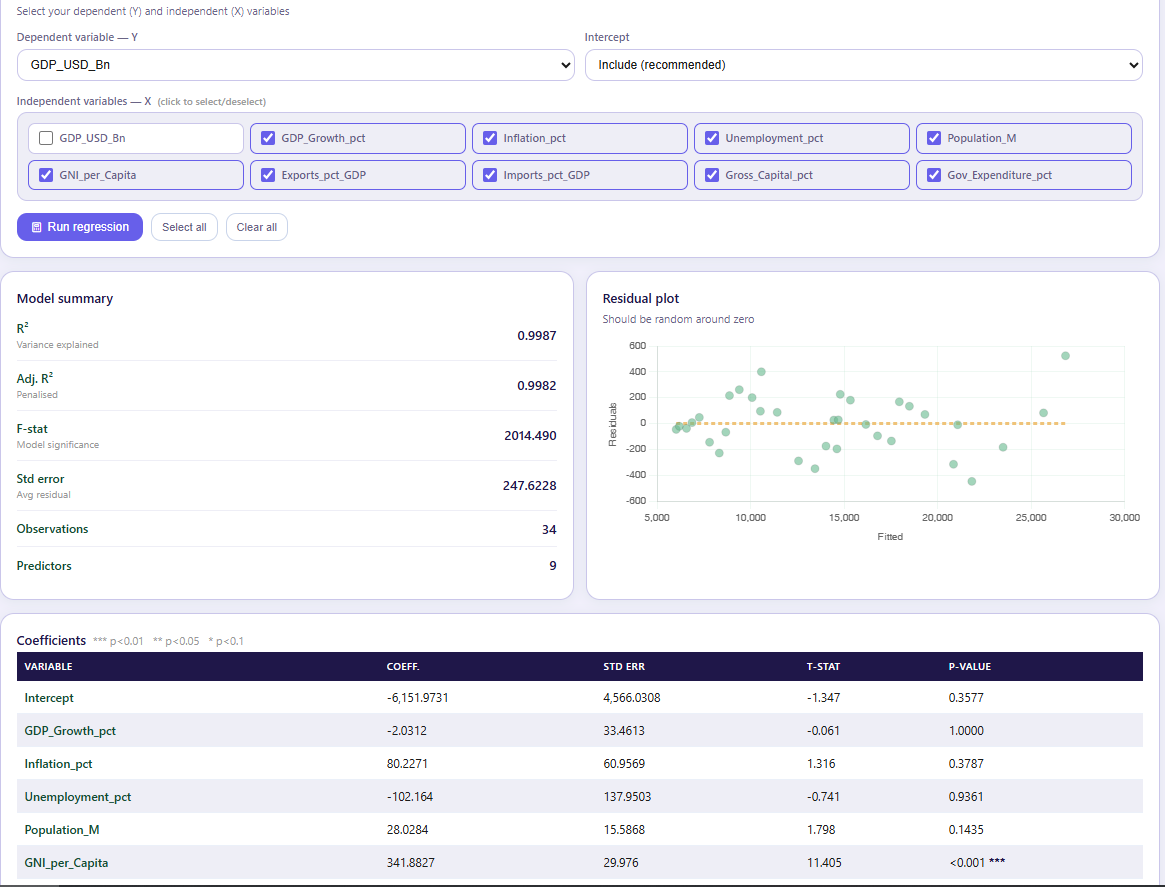
๐Ÿ“‰ Regression
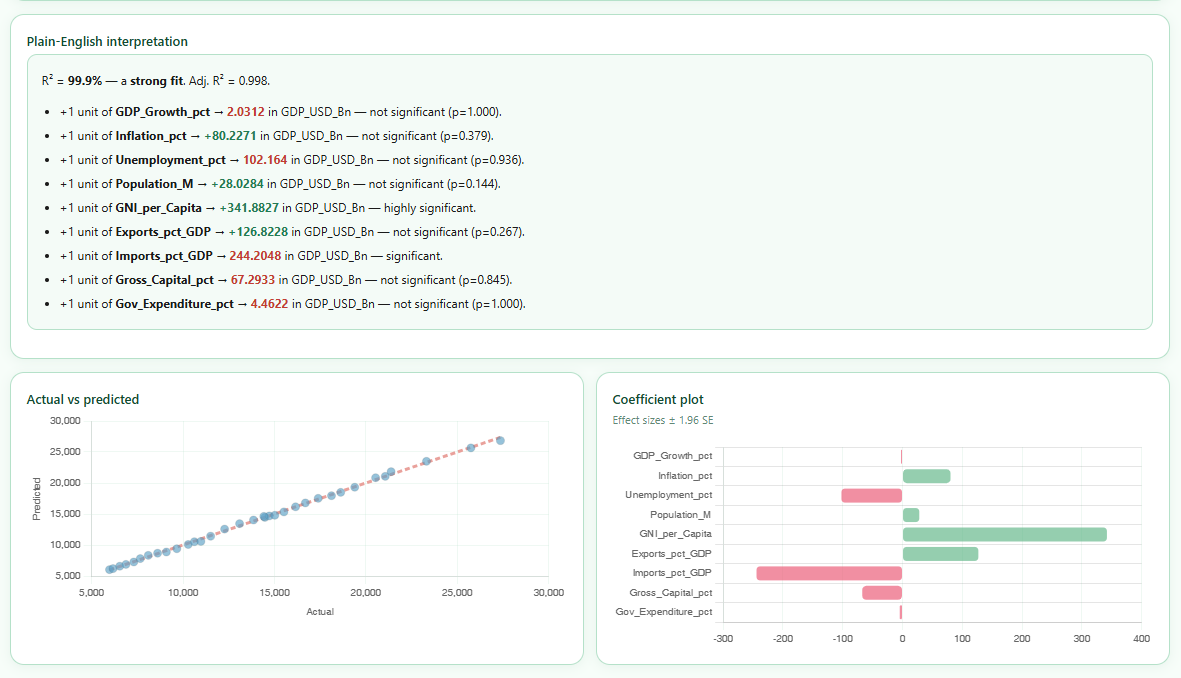
Full multiple OLS regression with a clickable variable picker. Coefficients, standard errors, t-stats, p-values, Rยฒ, adjusted Rยฒ, residual plots, and โ€” the part people actually use โ€” a plain-English interpretation of what the model is telling you.
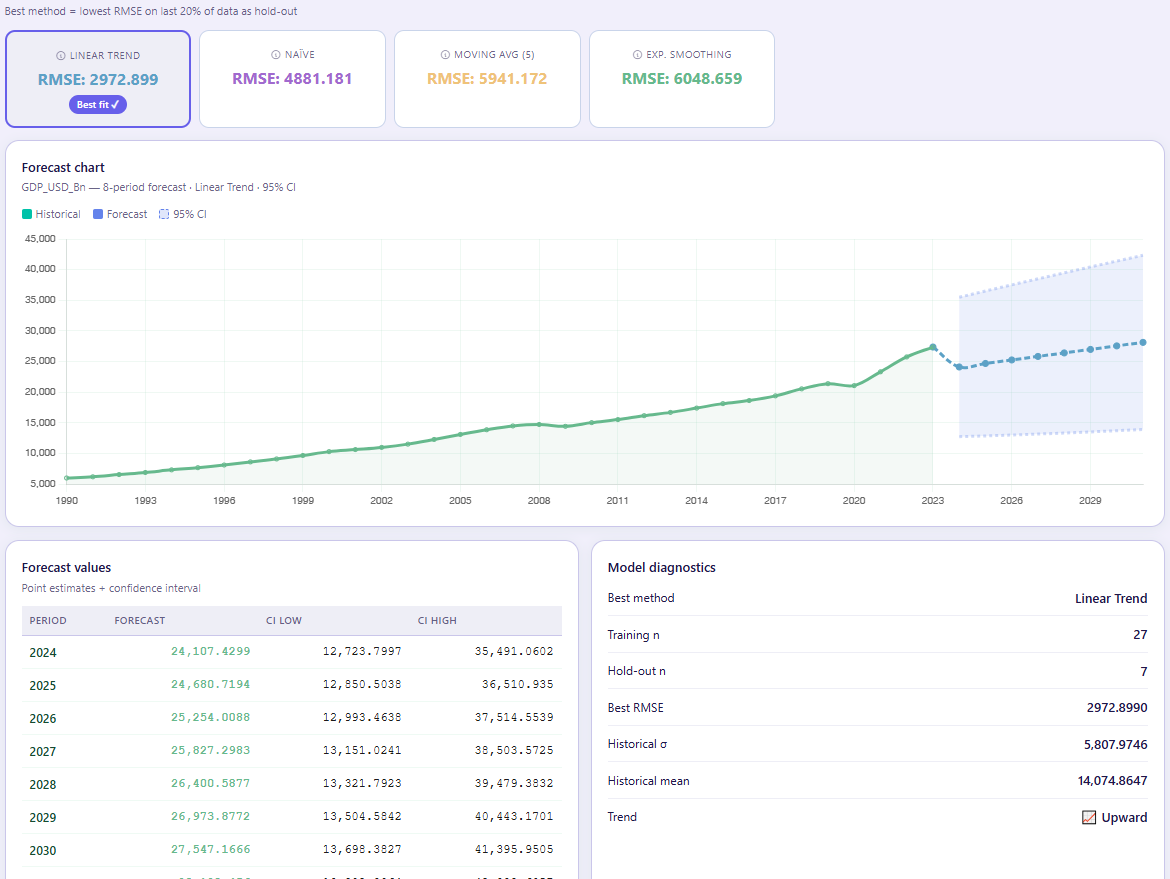
๐Ÿ”ฎ Forecast
Four forecasting methods (Naรฏve, Moving Average, Exponential Smoothing, Linear Trend) compared automatically on a hold-out sample. Best method selected for you, with confidence intervals and a full forecast table. Hover any method for a one-line explanation of how it works.
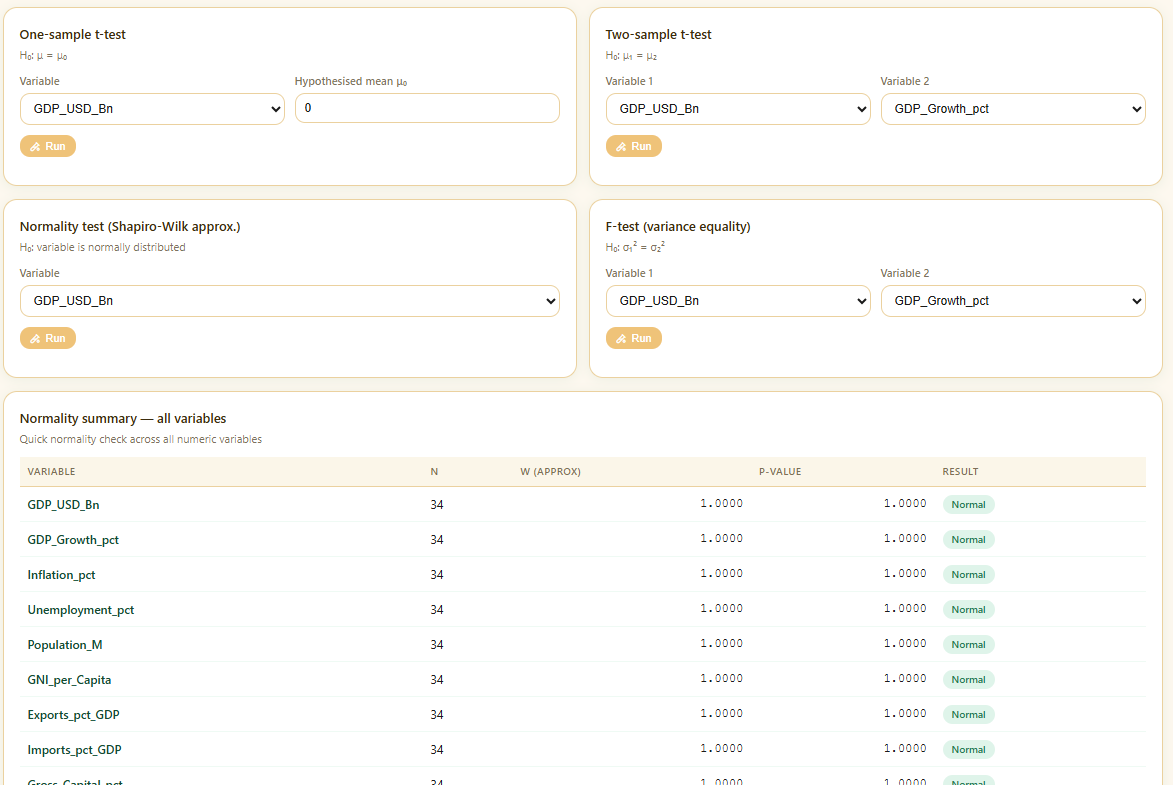
๐Ÿงช Hypothesis Tests
One-sample and two-sample t-tests, a normality test, and an F-test for variance equality โ€” each with a plain pass/fail readout, not just a p-value to interpret yourself.
โ”โ”โ”โ”โ”โ”โ”โ”โ”โ”โ”โ”โ”โ”โ”โ”โ”โ”โ”โ”โ”โ”โ”โ”
ADDITIONAL FEATURES
๐ŸŽจ 6 light themes and 4 dark themes, or set your own colours
๐Ÿ–Š๏ธ Logo upload and editable title for white-labelling
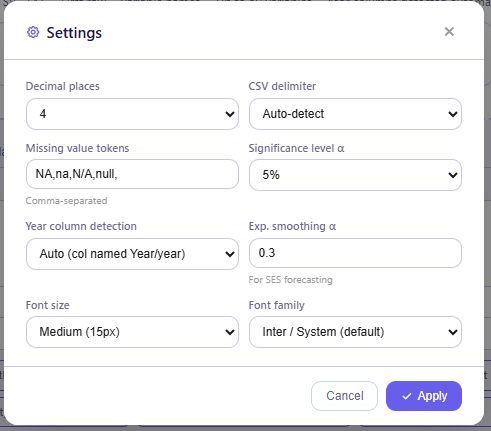
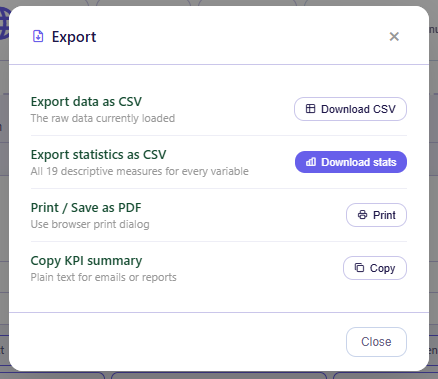
๐Ÿ’พ Export data or full statistics to CSV, copy a KPI summary, or print to PDF
๐Ÿ“– Built-in manual covering every tab and statistical method
โœ… 3 sample datasets (economics, sales, health) to explore before using your own data
โ”โ”โ”โ”โ”โ”โ”โ”โ”โ”โ”โ”โ”โ”โ”โ”โ”โ”โ”โ”โ”โ”โ”โ”
WHO IT'S FOR
โ†’ Analysts who want a fast first look at a new dataset without opening R or Python
โ†’ Researchers who need descriptive stats, correlation, and regression without a stats package licence
โ†’ Consultants who want a polished, presentable analysis to hand to a client
โ†’ Students and self-learners who want to see statistical concepts (skewness, p-values, Rยฒ) explained alongside the numbers
โ†’ Anyone who has a CSV and a question, and wants an answer in minutes, not hours
โ”โ”โ”โ”โ”โ”โ”โ”โ”โ”โ”โ”โ”โ”โ”โ”โ”โ”โ”โ”โ”โ”โ”โ”
REQUIREMENTS
Any modern browser โ€” Chrome, Firefox, Safari, or Edge. Works on Windows, Mac, and Linux. No installation, no internet connection required after download. Your data stays on your machine โ€” nothing is uploaded anywhere.

This Best Practice includes
1 zip file with 1 HTML file in it.

Acquire business license for $19.00

Add to cart

Add to bookmarks

Discuss

Further information

The Statistical Dashboard is applicable to all kinds of statistical research. The Tool can be a great support for students, researchers and managers, during their studies, research of decision-making.

Quick data analysis, main statistical indicators, basic data analysis.

Complicated data analysis and forecasting models.


5.0 / 5 (1 votes)

please wait...