

Originally published: 10/01/2024 09:25
Last version published: 24/07/2025 13:51
Publication number: ELQ-75602-5
View all versions & Certificate
Last version published: 24/07/2025 13:51
Publication number: ELQ-75602-5
View all versions & Certificate

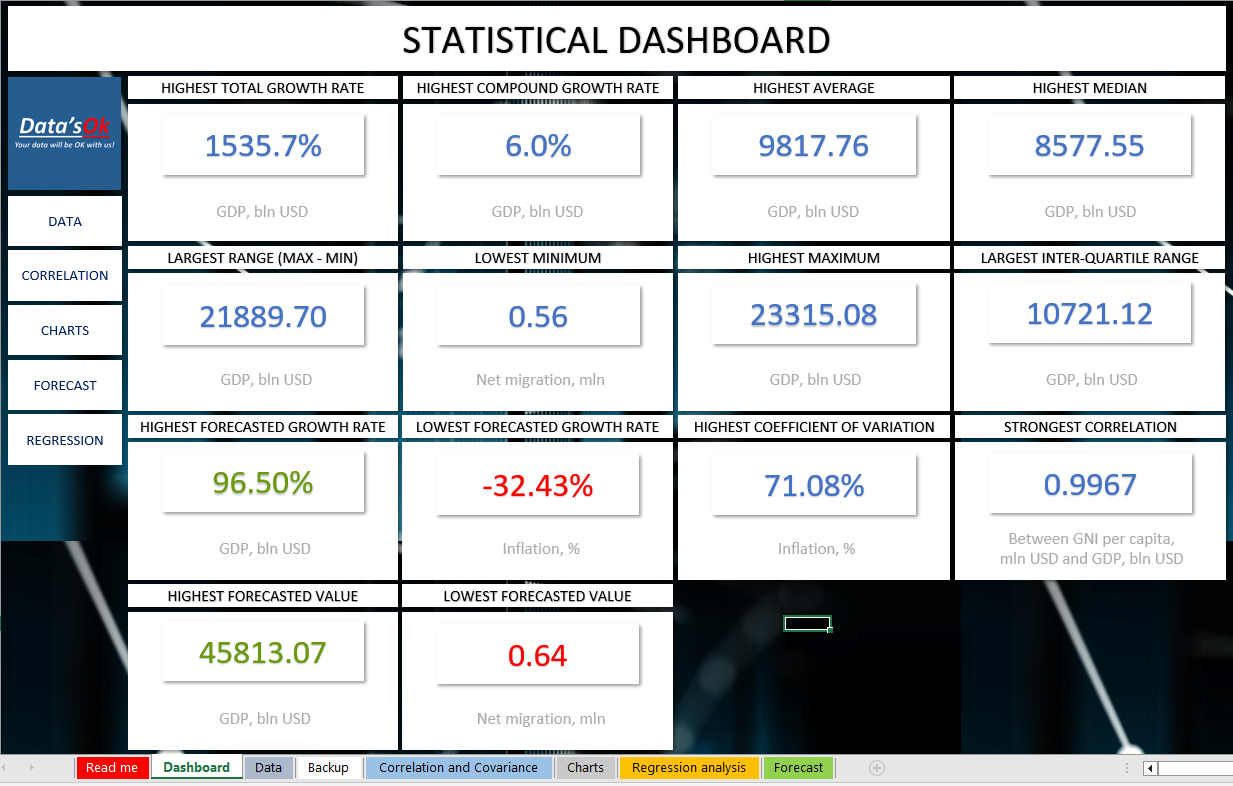
Statistical Analysis Excel Dashboard - Full version
Unlock powerful insights with this all-in-one statistical dashboard—ideal for researchers, analysts, and decision-makers seeking clarity from complex data.
Further information
The Statistical Dashboard is applicable to all kinds of statistical research. The Tool can be a great support for students, researchers and managers, during their studies, research of decision-making.
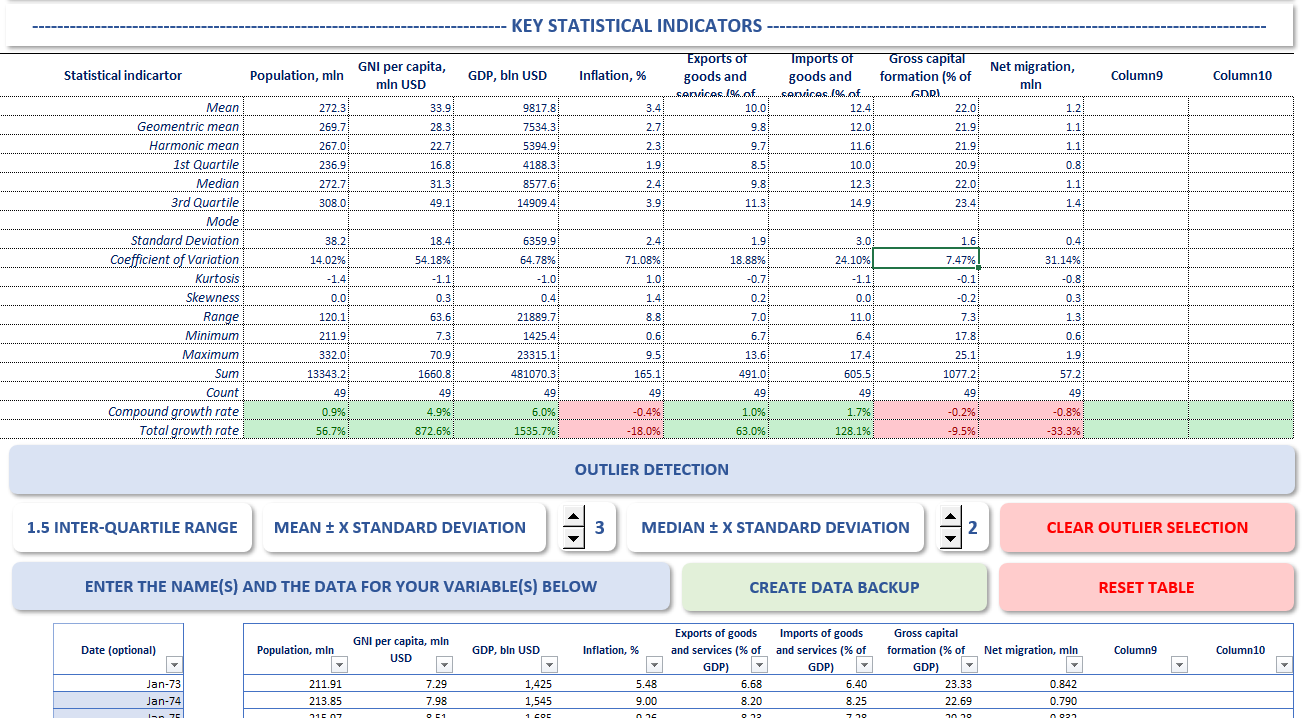
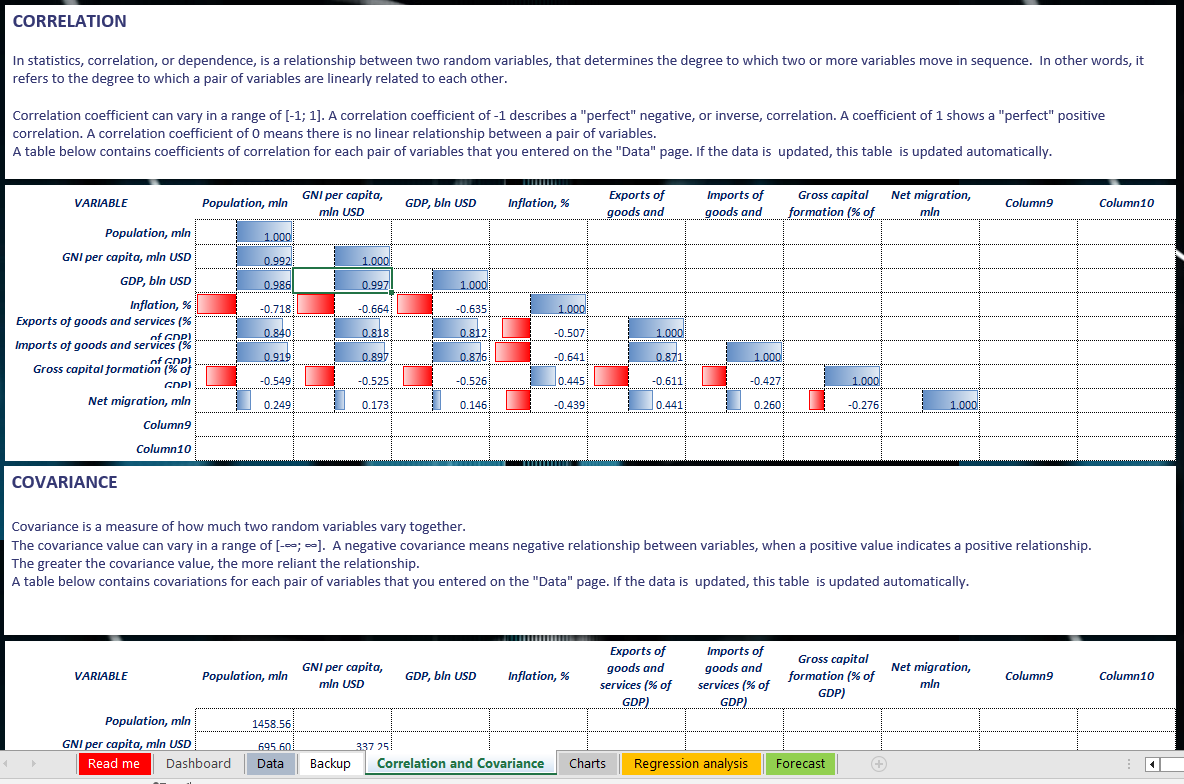
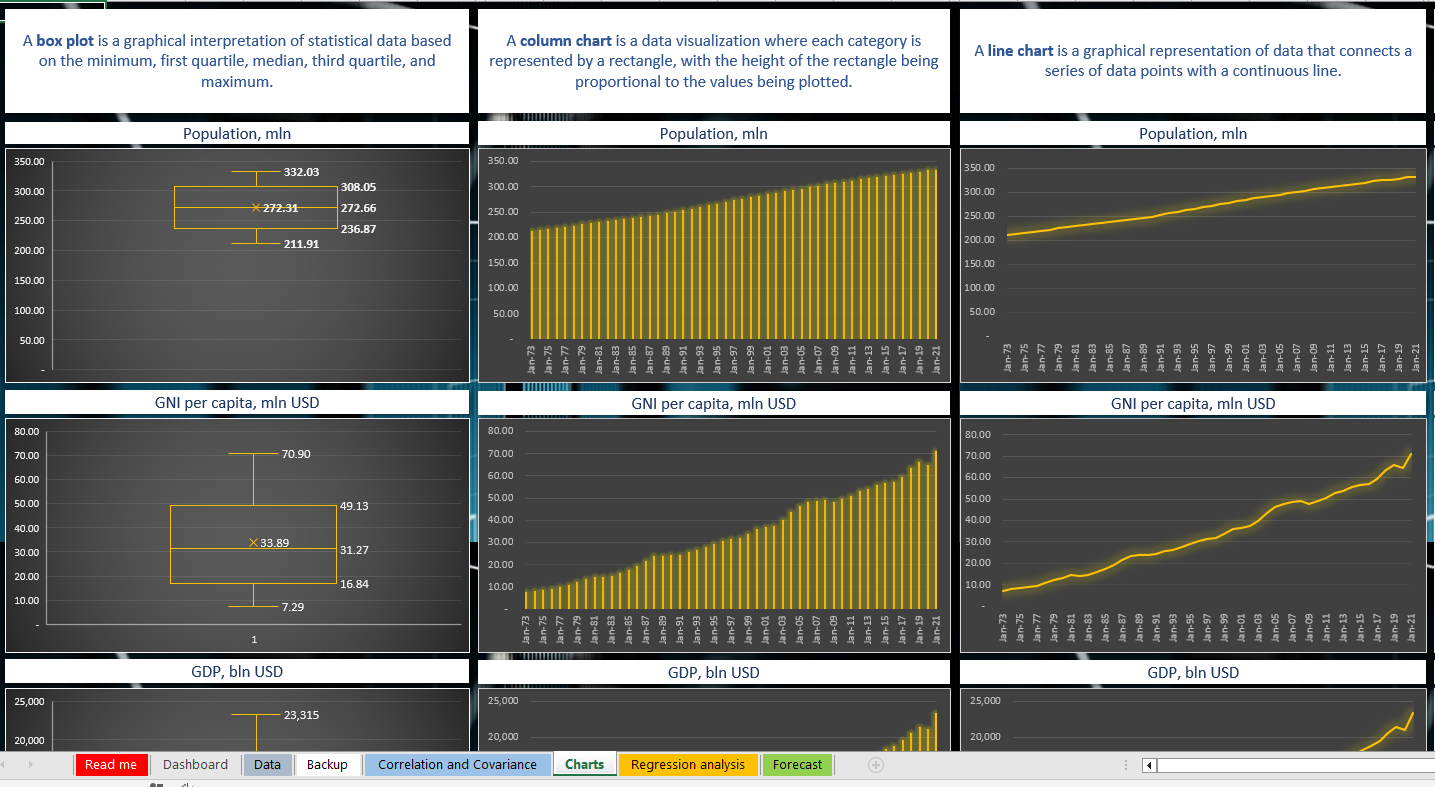
Quick data analysis, main statistical indicators, basic data analysis.
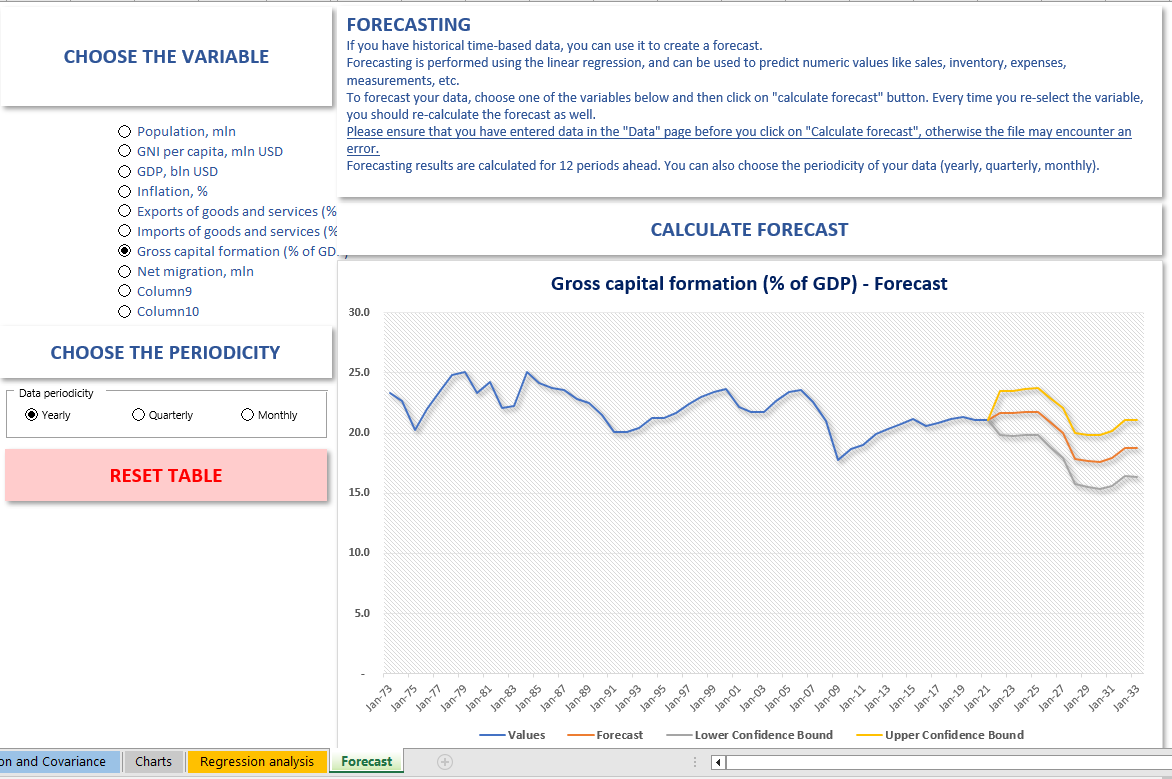
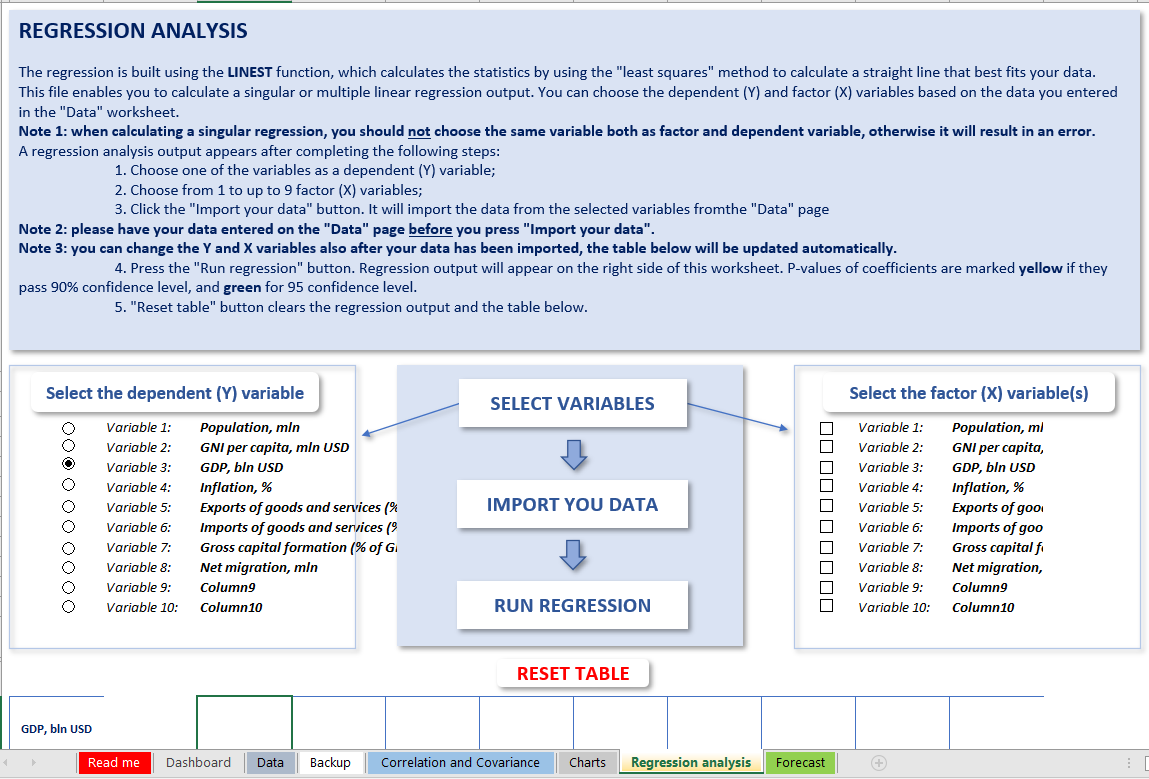
Complicated data analysis and forecasting models.
