Publication number: ELQ-73378-1
View all versions & Certificate

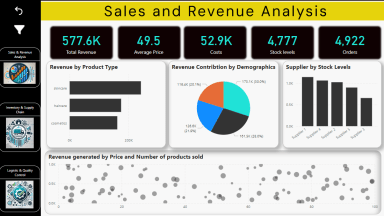
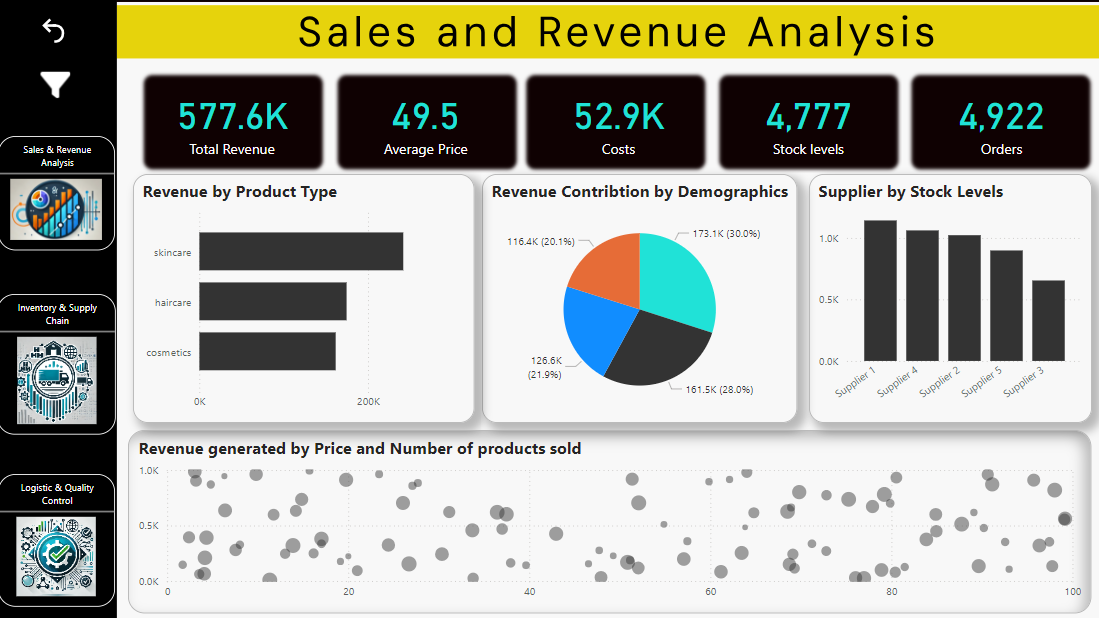
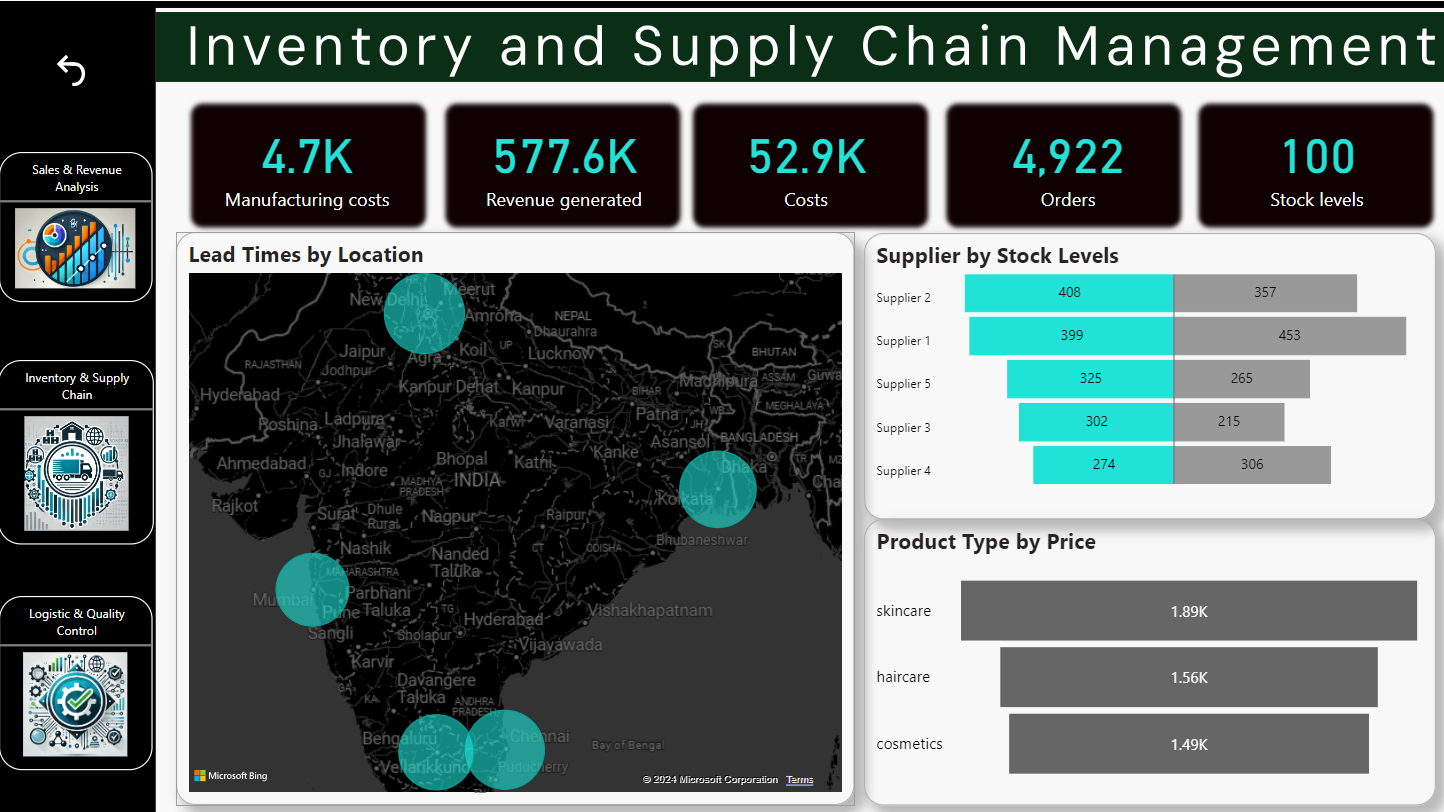
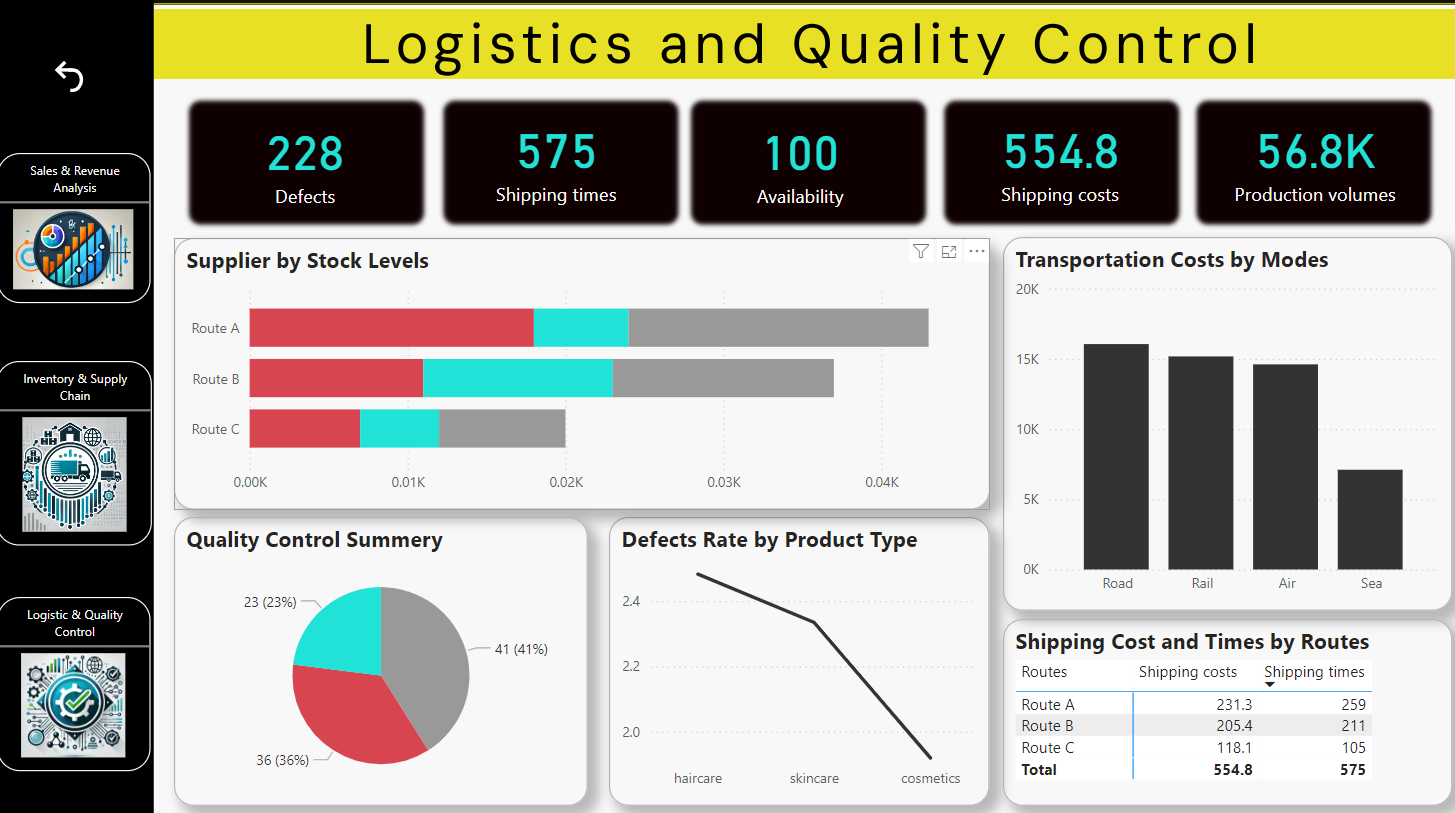
Supply Chain Analysis Power BI dashboard
This is Power BI project focused on Supply Chain Analysis!
Further information
The Best Practice Guide helps users design impactful Power BI dashboards with a focus on clear visuals, actionable insights, and efficient use of features. It provides guidelines on layout, color schemes, and data visualization to enhance decision-making and stakeholder engagement. Perfect for creating accessible, user-friendly dashboards in supply chain analytics.
This Best Practice Guide is tailored for creating Power BI dashboards focused on supply chain metrics, interactive data exploration, and data-driven decision-making. It’s ideal for visualizing inventory, sales, and logistics data with clear, actionable insights. Perfect for teams needing user-friendly, impactful dashboards.
This Best Practice Guide is not ideal for non-supply chain data, static reports without interactivity, or highly specialized visuals requiring custom coding. It’s best suited for interactive, Power BI-driven supply chain analytics.
