Originally published: 17/07/2026 20:40
Publication number: ELQ-39824-1
View all versions & Certificate
Publication number: ELQ-39824-1
View all versions & Certificate

Scenario & Sensitivity Planner
Scenario & Sensitivity Analysis Template (Excel) — Base / Best / Worst P&L + Sensitivity Grid

Description
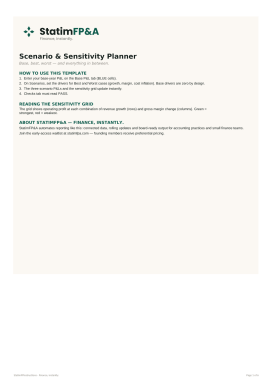
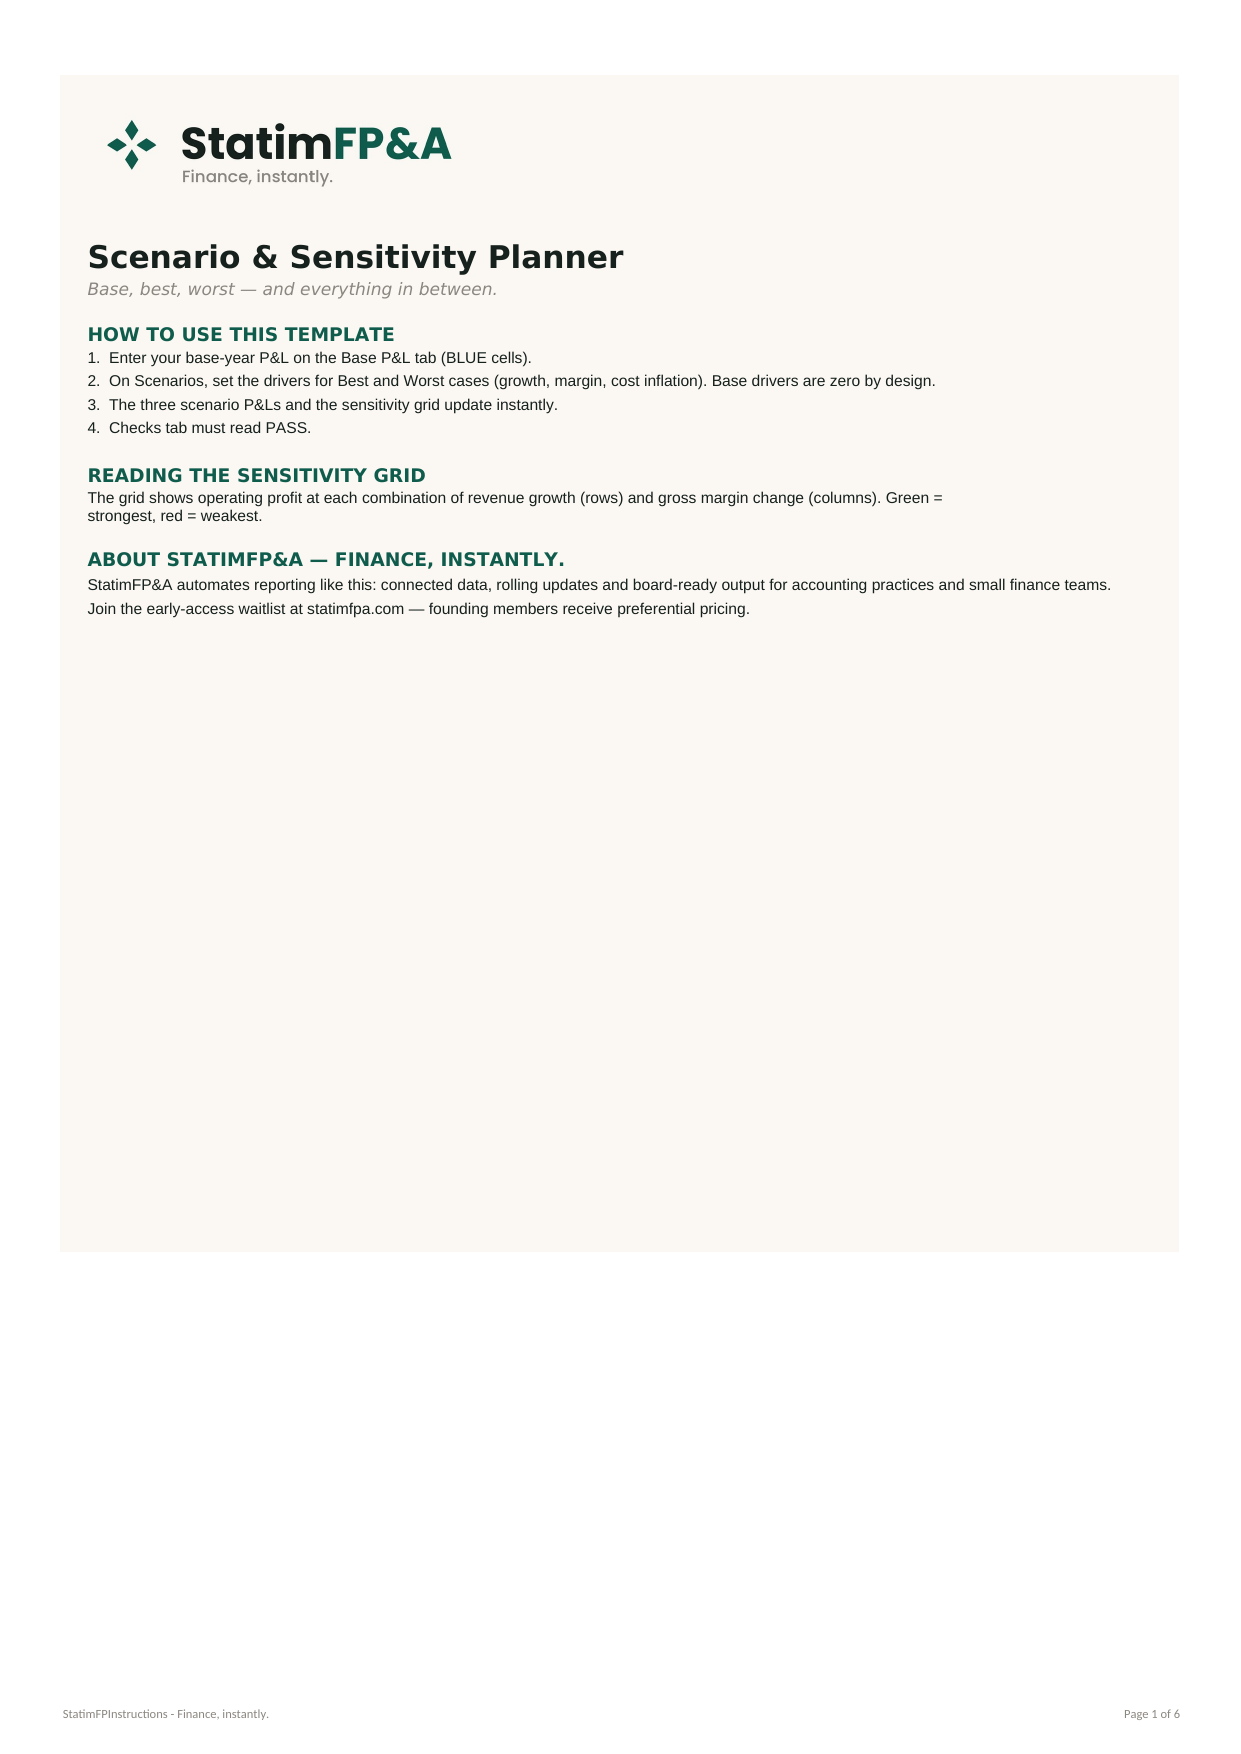
Base, best, worst — and everything in between.
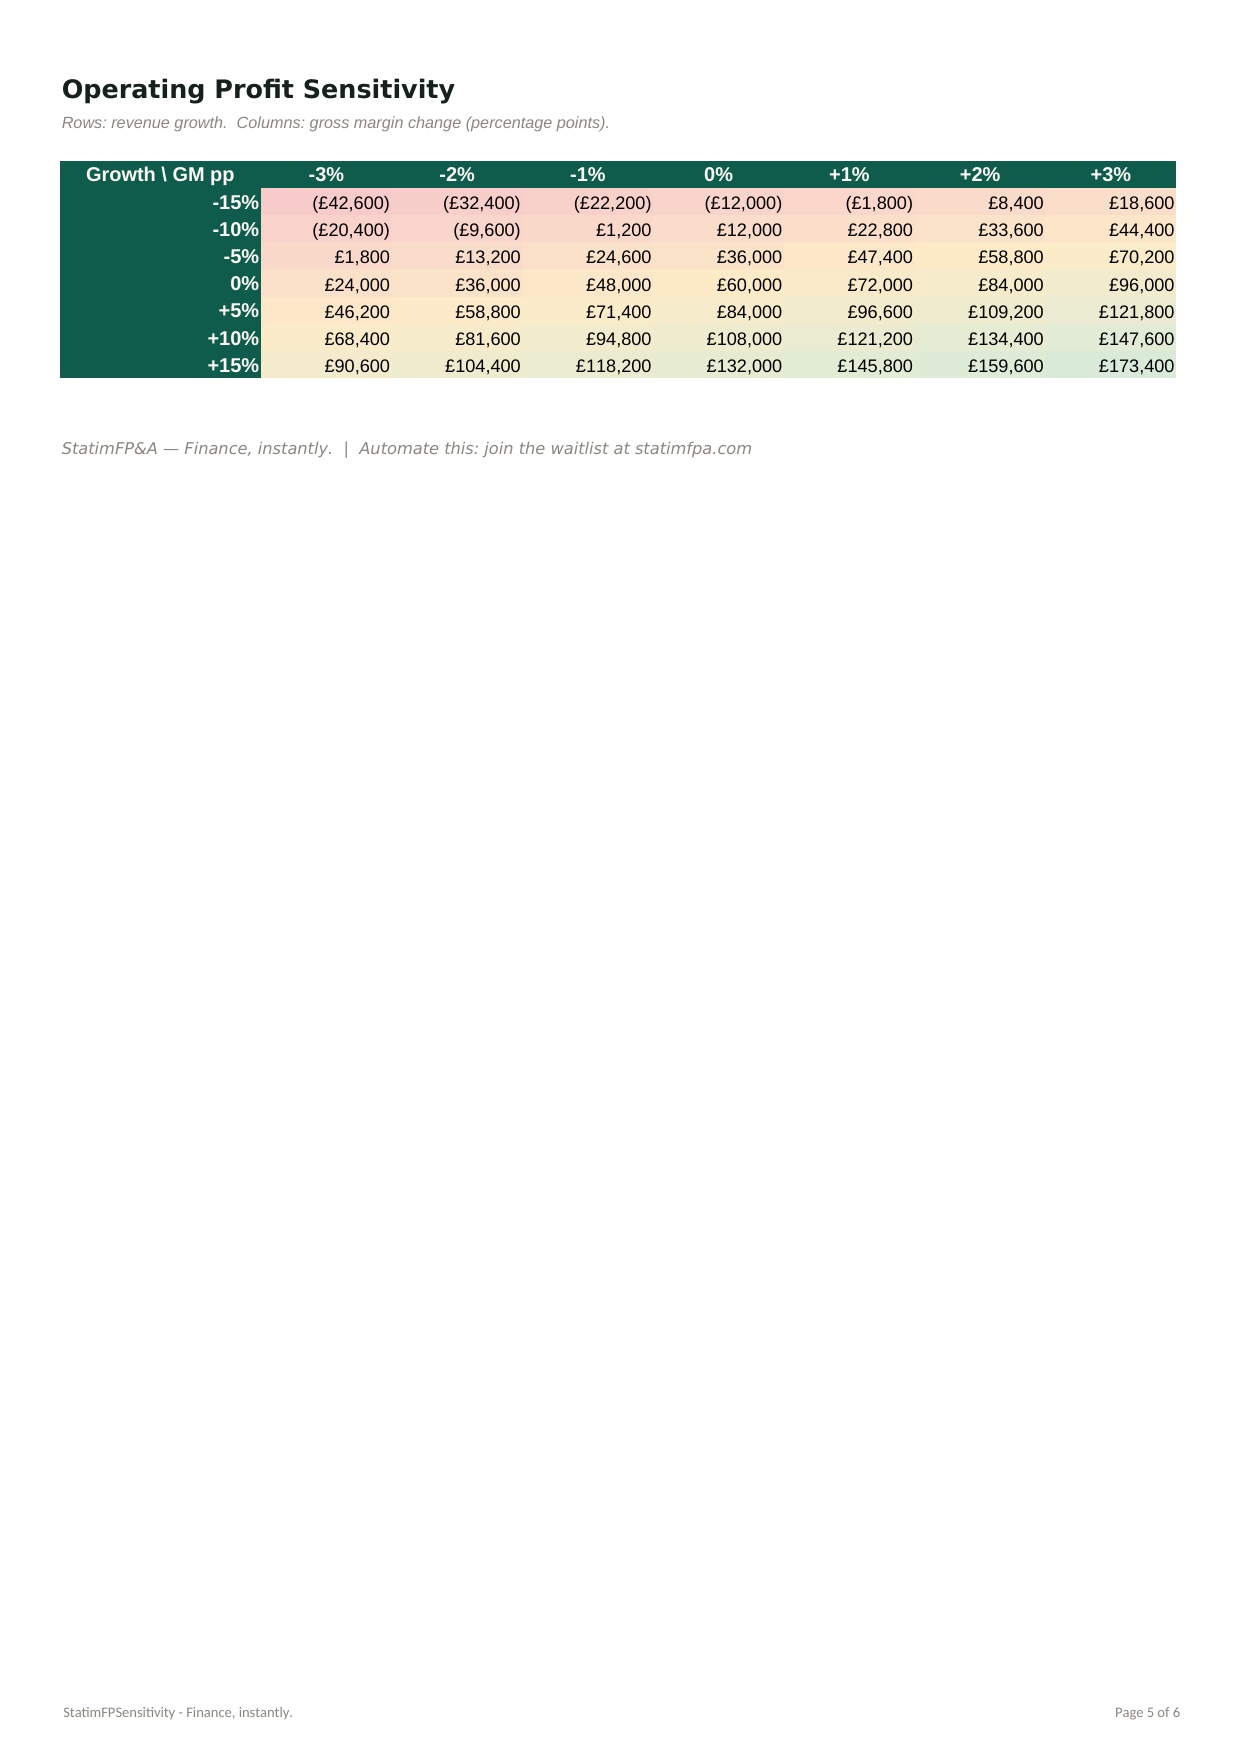
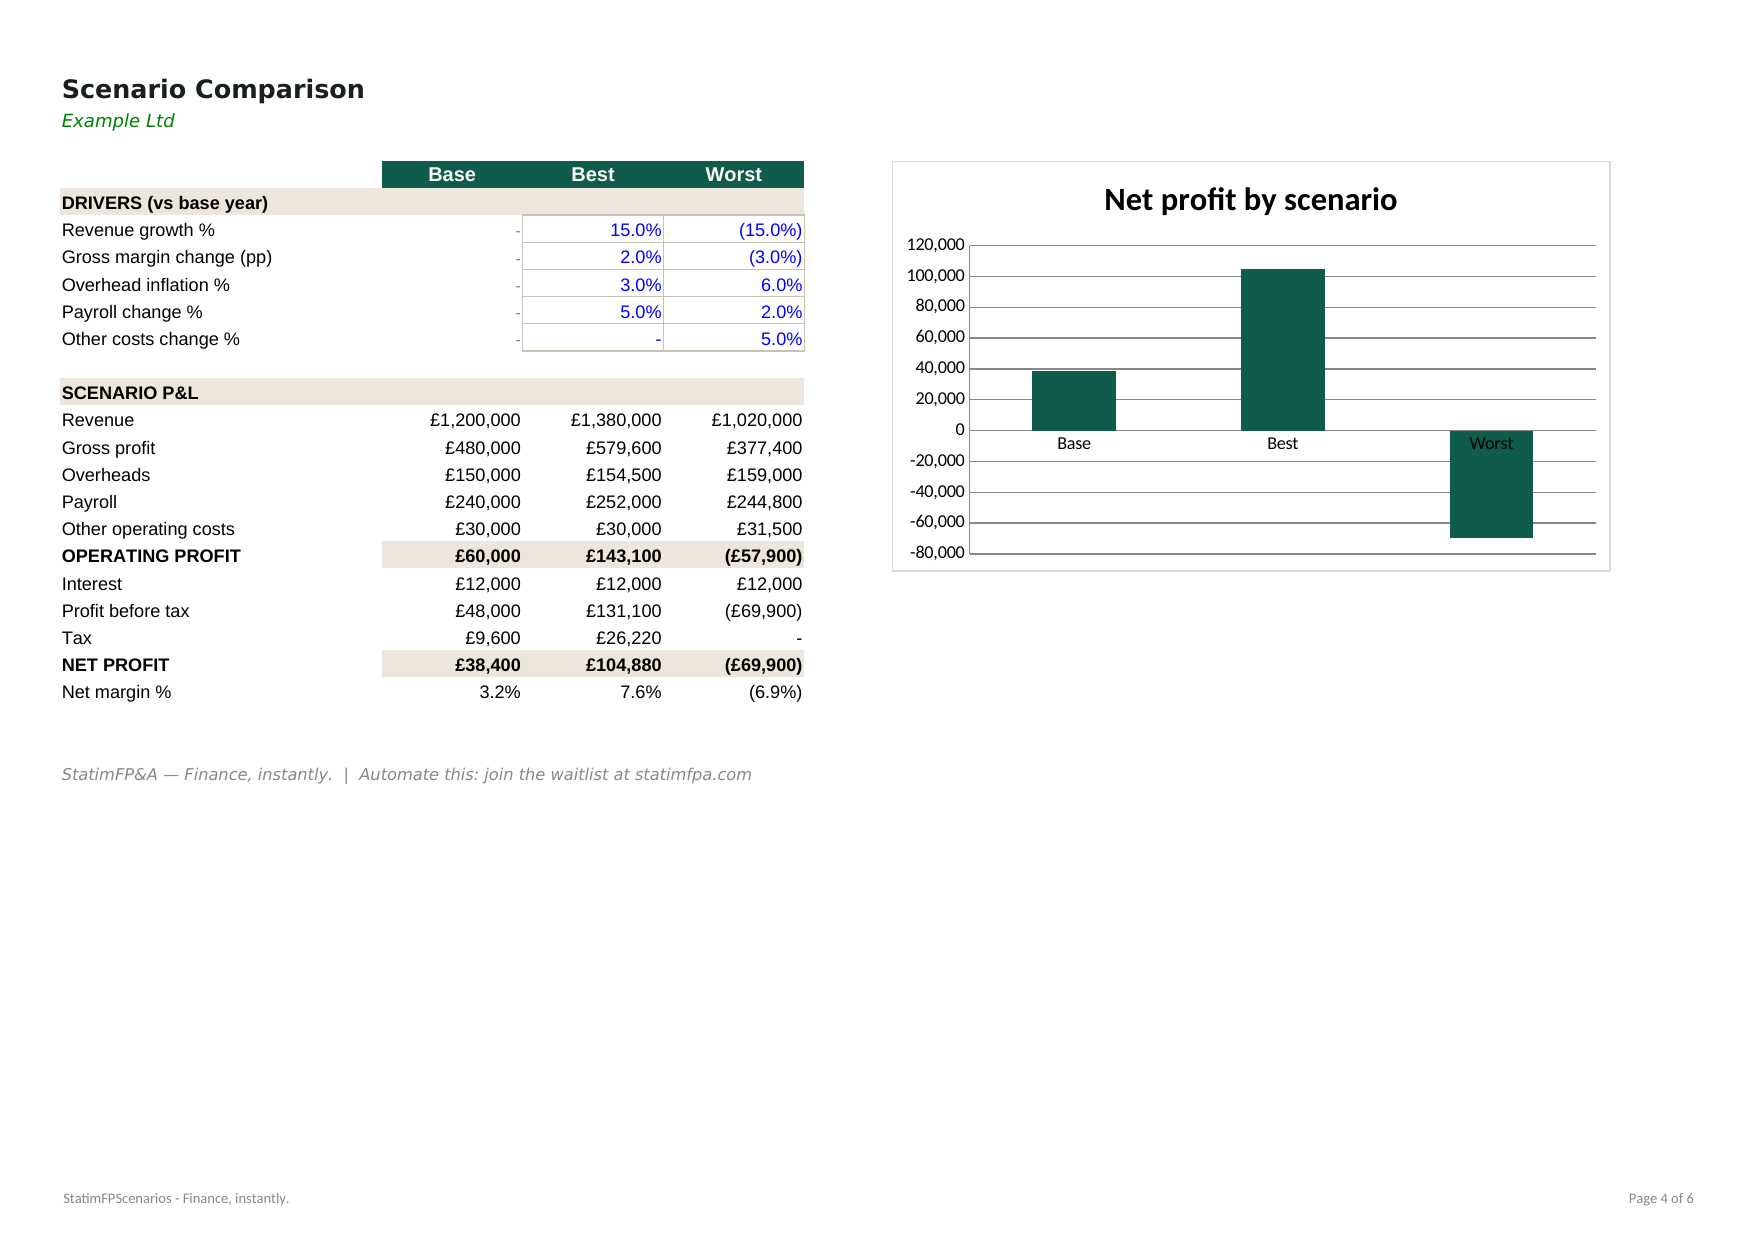
A single-number forecast is a guess wearing a suit. The question that matters isn't "what do we expect?" — it's "what happens if we're wrong?" This template answers it properly. Enter your base-year P&L once, set growth, margin and cost-inflation drivers for best and worst cases, and get three complete scenario P&Ls side by side — plus a colour-shaded sensitivity grid showing operating profit at 49 combinations of revenue growth and margin change, so you can see exactly where the plan holds and where it breaks.
What's inside:
Who it's for: practices and FP&A teams stress-testing plans, and owners preparing to face lenders' questions with answers already in hand.
This template is a hand-built preview of what StatimFP&A automates. Join the early-access waitlist at statimfpa.com — founding members receive preferential pricing.
Base, best, worst — and everything in between.
A single-number forecast is a guess wearing a suit. The question that matters isn't "what do we expect?" — it's "what happens if we're wrong?" This template answers it properly. Enter your base-year P&L once, set growth, margin and cost-inflation drivers for best and worst cases, and get three complete scenario P&Ls side by side — plus a colour-shaded sensitivity grid showing operating profit at 49 combinations of revenue growth and margin change, so you can see exactly where the plan holds and where it breaks.
What's inside:
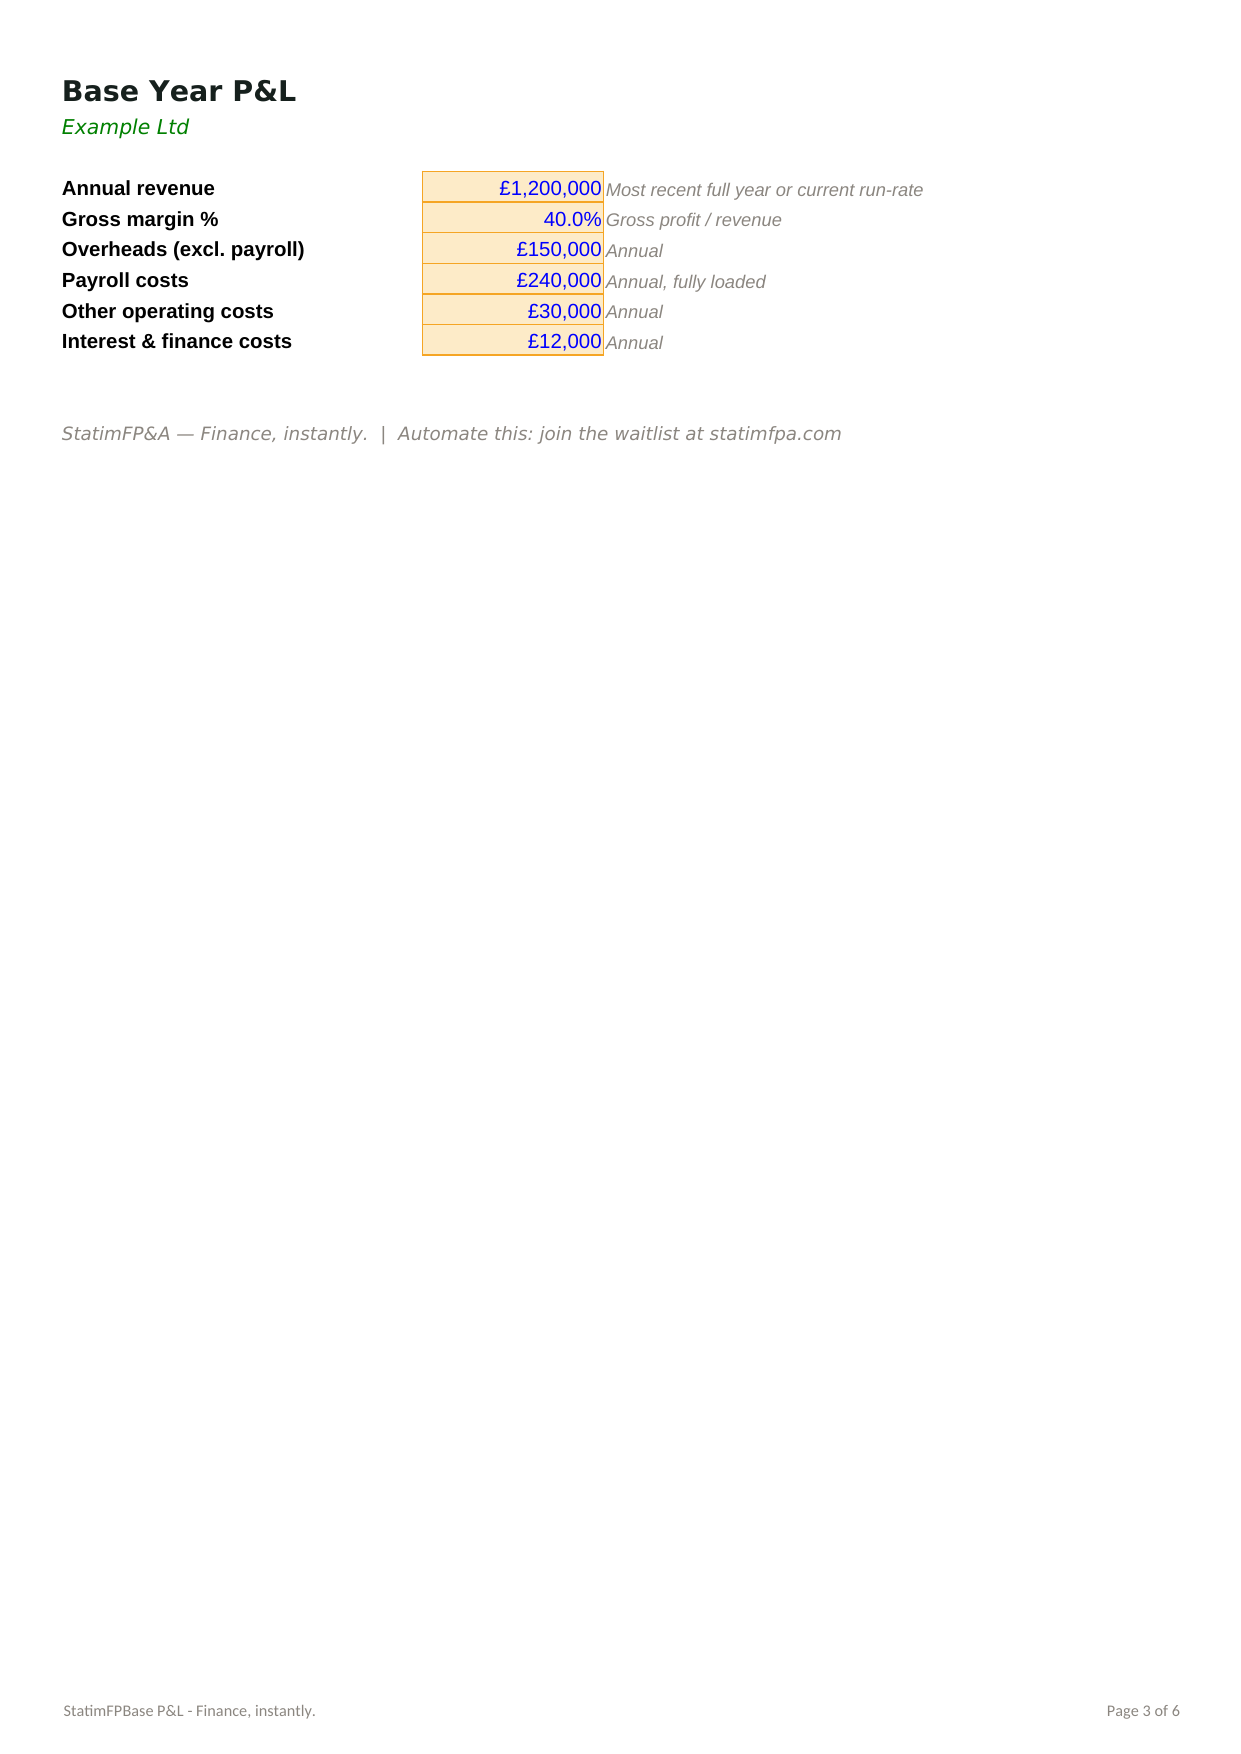
- Base P&L tab: six inputs and you're running — no rebuilding your accounts line by line
- Driver-based scenarios: growth %, margin points, overhead inflation and payroll change — tweak a driver, and the whole scenario recalculates
- A full P&L per scenario, including proper tax logic (no tax charged on losses — a detail many templates get wrong)
- A 7×7 sensitivity grid with heat-map shading — green where the plan is strong, red where it's fragile — the single most persuasive page you can put in front of a lender
- A net profit by scenario chart for the summary slide
Who it's for: practices and FP&A teams stress-testing plans, and owners preparing to face lenders' questions with answers already in hand.
This template is a hand-built preview of what StatimFP&A automates. Join the early-access waitlist at statimfpa.com — founding members receive preferential pricing.
This Best Practice includes
Excel workbook
