Ride Hailing Startup (SaaS)- Financial Excel Model
Originally published: 29/08/2019 10:29
Last version published: 14/10/2019 14:25
Publication number: ELQ-25310-3
View all versions & Certificate
certified

Ride Hailing Startup (SaaS)- Financial Excel Model

A simple Financial Model specifically designed for Ride-Hailing service providers, who are seeking funds from Investors.

Description
In this Financial Model, we are having detailed
1. Users Acquisitions
2. Facebook and Referral programs Analysis
3. Cost details
4. Start-up Cost Analysis
5. CAC/ CLV Analysis
6. Income Statement
7. Dashboard

Startup Cost – This is very crucial information for a SaaS business. Here you can calculate the funds coming from investors and private channels.

Number of Users – This driver shows how many users are coming from online channels such as Facebook, Twitter, etc. Also, you can check the number of users coming from traditional mediums.

Profit & Loss Statement – Income statement helps in estimating a figure for the company, based on the provided data. It consists of two sections, Revenue, and Expenses. For revenue, you can find accounts such as new customers, services provided per month, churn rate, etc. These account names are general and may be changed depending on the SaaS business and its nature.

CLV/CAV – CLV is the customer lifetime value, and CAV is the customer acquisition cost. CLV is an essential driver for any SaaS company because it shows the amount of revenue a customer can generate over the course of the business relationship. CAV and CLV are closely monitored, and their ratio indicates the amount of revenue generated by a single customer against the cost of acquiring that customer. In CAV, you can add different costs based on your specific business.

NPV & IRR – Our financial model consists of NPV & IRR calculations, which are essential in finding out the project viability. Investors usually look at NPV and IRR in order to calculate the feasibility of a project. Two similar projects are compared and the one yielding the most profit is selected by the investors. Cost of capital is the required rate of return, which is needed in order to persuade investors. Our model has linked cells which make the whole process easier. You can add the data for the next five years and calculate the NPV and ROI of the SaaS startup.

Cost Details – Cost details is the tab which will be filled earliest. Your profit & loss statement tab is linked with the cost detail tab, and any changes you make in the input cell (colored) will automatically change the linked cells of profit & loss statement. This model provides ease in terms of being time effective and accurate.

Online Campaign – This is the last tab of the SaaS financial model. This tab includes the cost from campaigns such as Facebook or Twitter. You can change the medium of the campaign depending on your requirements. This tab will provide you with the total advertising cost per month and also per user. The input cells in this tab are impression % on population, % download expected, and cost per

Facebook click. Furthermore, you can change the expected growth rate based on your projections. This way, you can provide the cost of campaigns in the best way possible.
Dashboard – The first tab in this financial model is the Dashboard. This is creating illustrations for key indicators such as, MMR, Startup Cost Analysis, and Cashflow Analysis. These illustrations are in the form of different charts and graphs.

About Us
Oak Financial Model is a combination of financial and data analytics. For this, we have strong skills in math, financial analysis, accountancy, management performance indicators, and organize this data into the dashboard for clients.

Our Mission
Our mission is to be the industry leader in our business domain, which comes after an in-depth analysis of the market situation and ever-changing business trends. We believe that financial and business consultancy requires a complete understanding of the continuous changes in the market and economy and its effects on business.

Our Vision
Our Vision is to be reputed as the best Financial & Management Services Consultants by providing top-notch services and to create goodwill based on an excellent performance.

Our Core Values
Our business motto is derived from the fact that High Quality surpasses Quantitative work and with that in mind we strive for a disciplined approach to analyze the business situations and identify the best solutions to achieve the financial plans. In the same time, we help in opening new doors by providing our state of the art financial services, and management tools.

This Best Practice includes
1 Excel Model

Acquire business license for $250.00

Add to cart

Add to bookmarks

Discuss

Further information

the objective of this financial model is to analyze
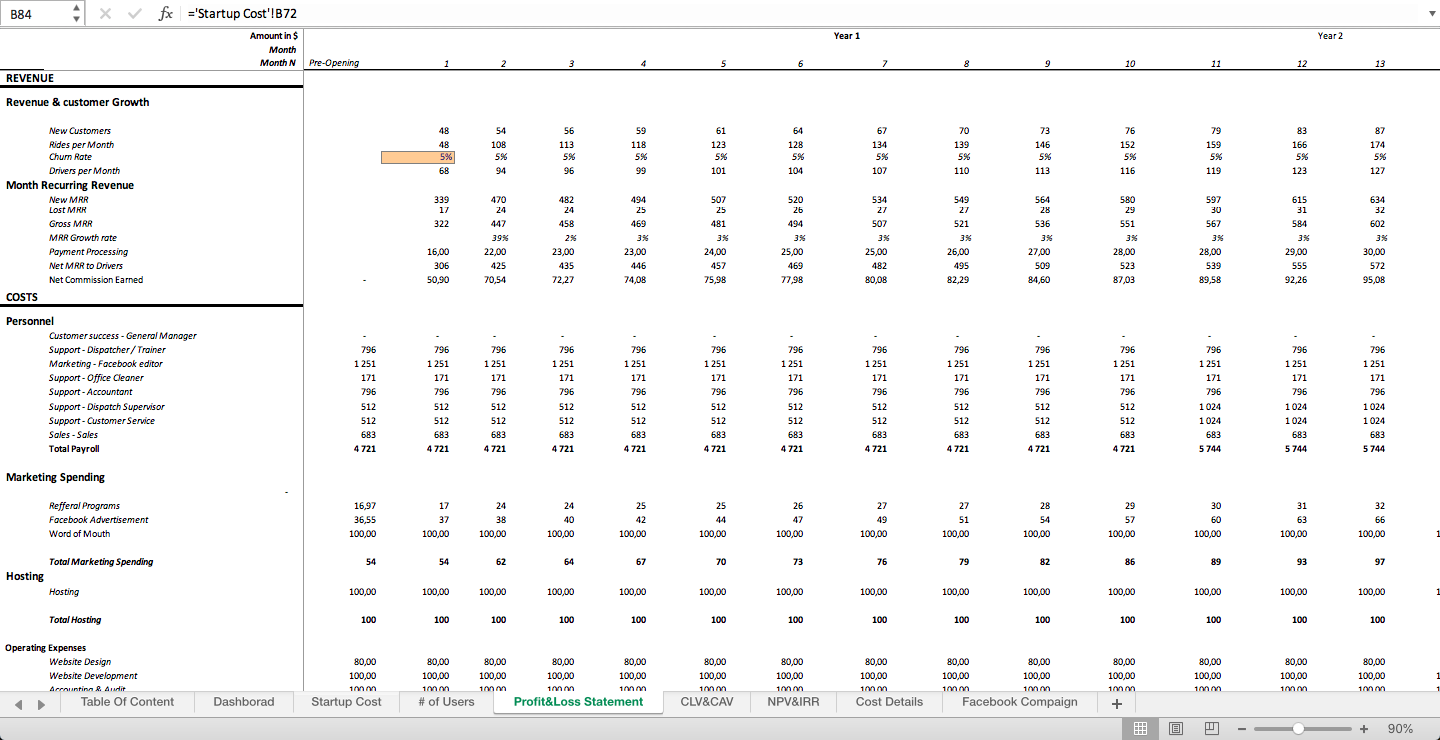
1. The per Ride Cost and its REvneu to drivers and Service providers
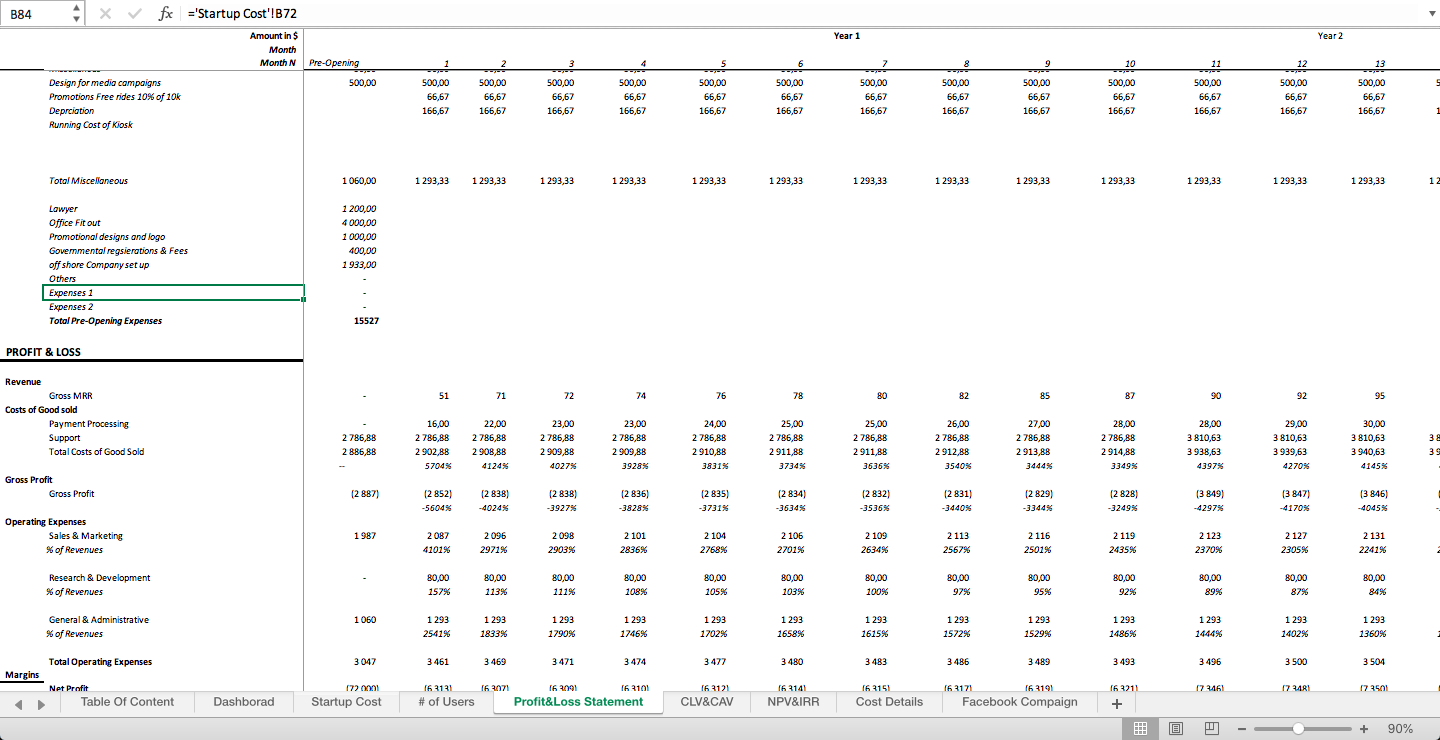
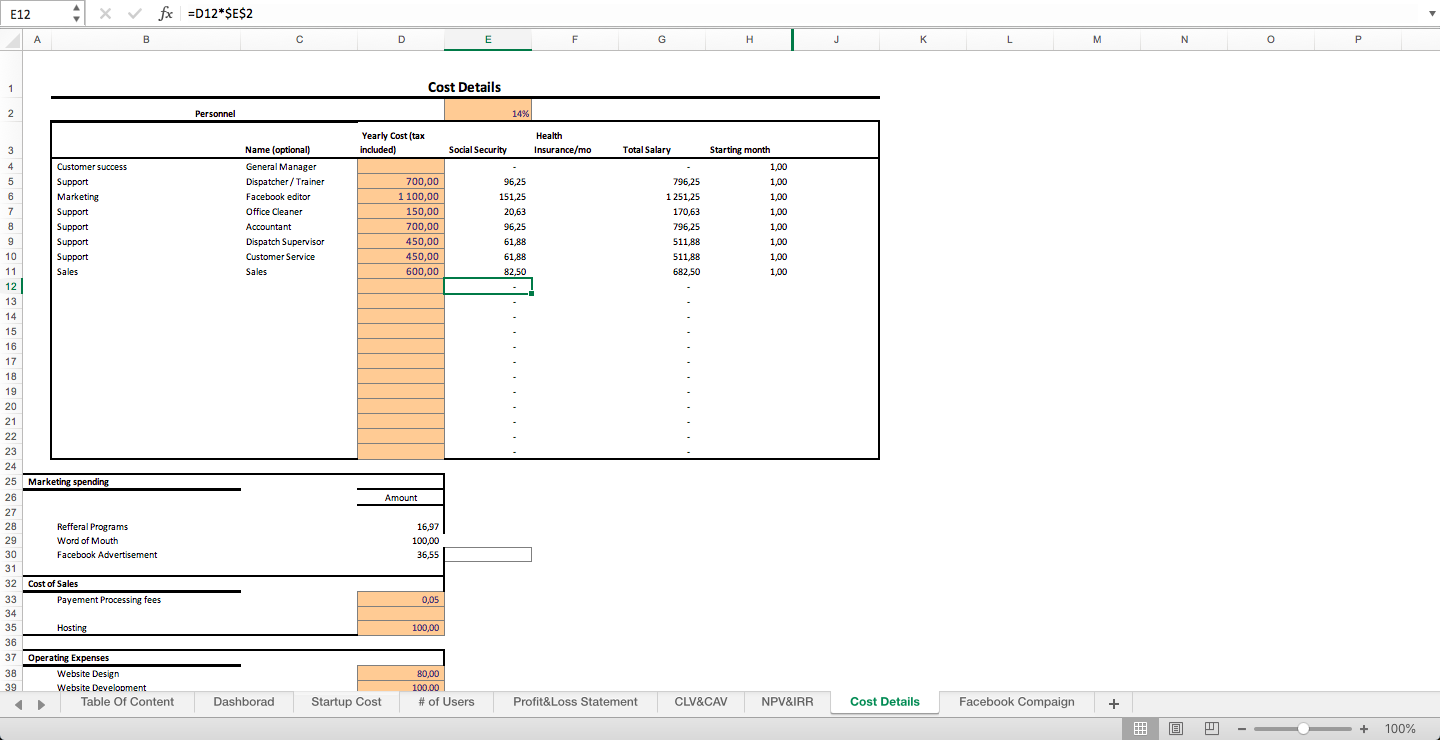
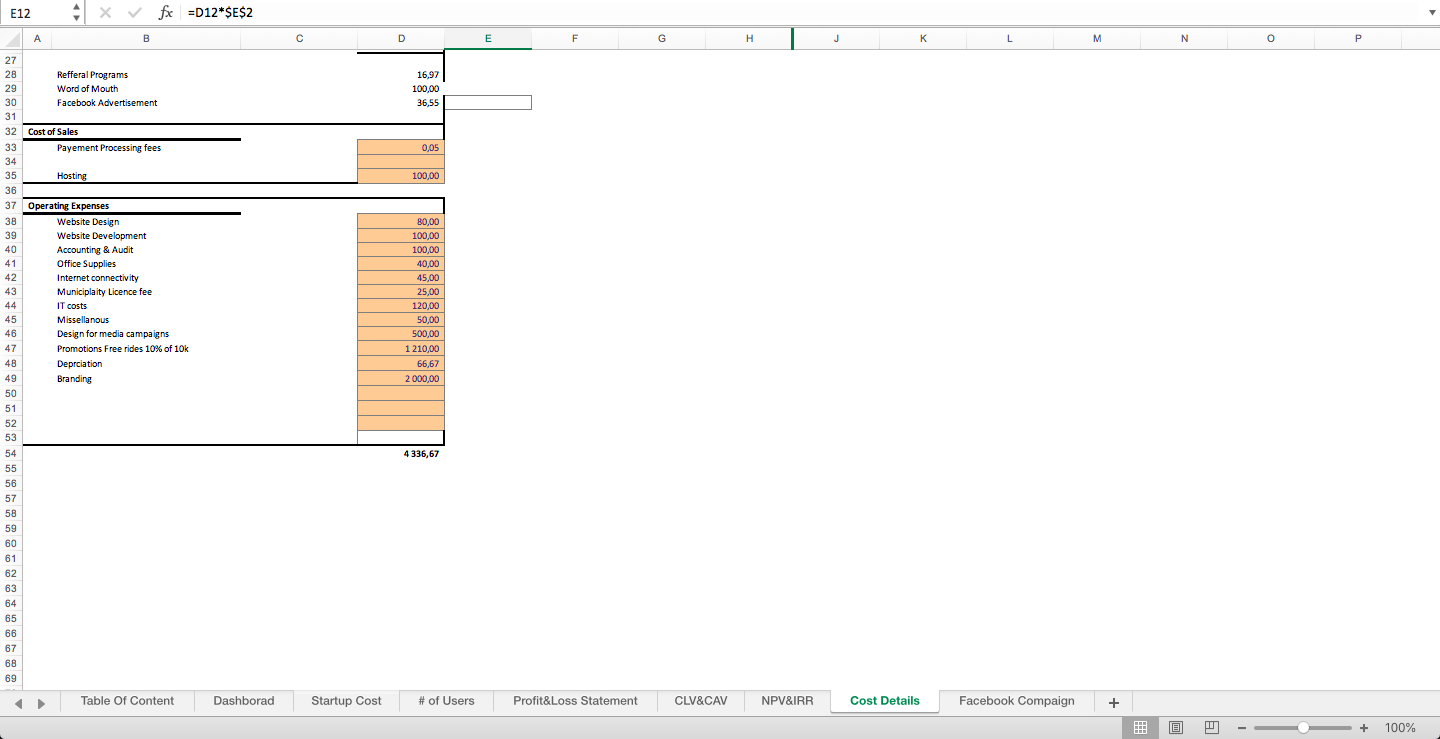
2. Analyze the Startup Cost
3. How much funding is required
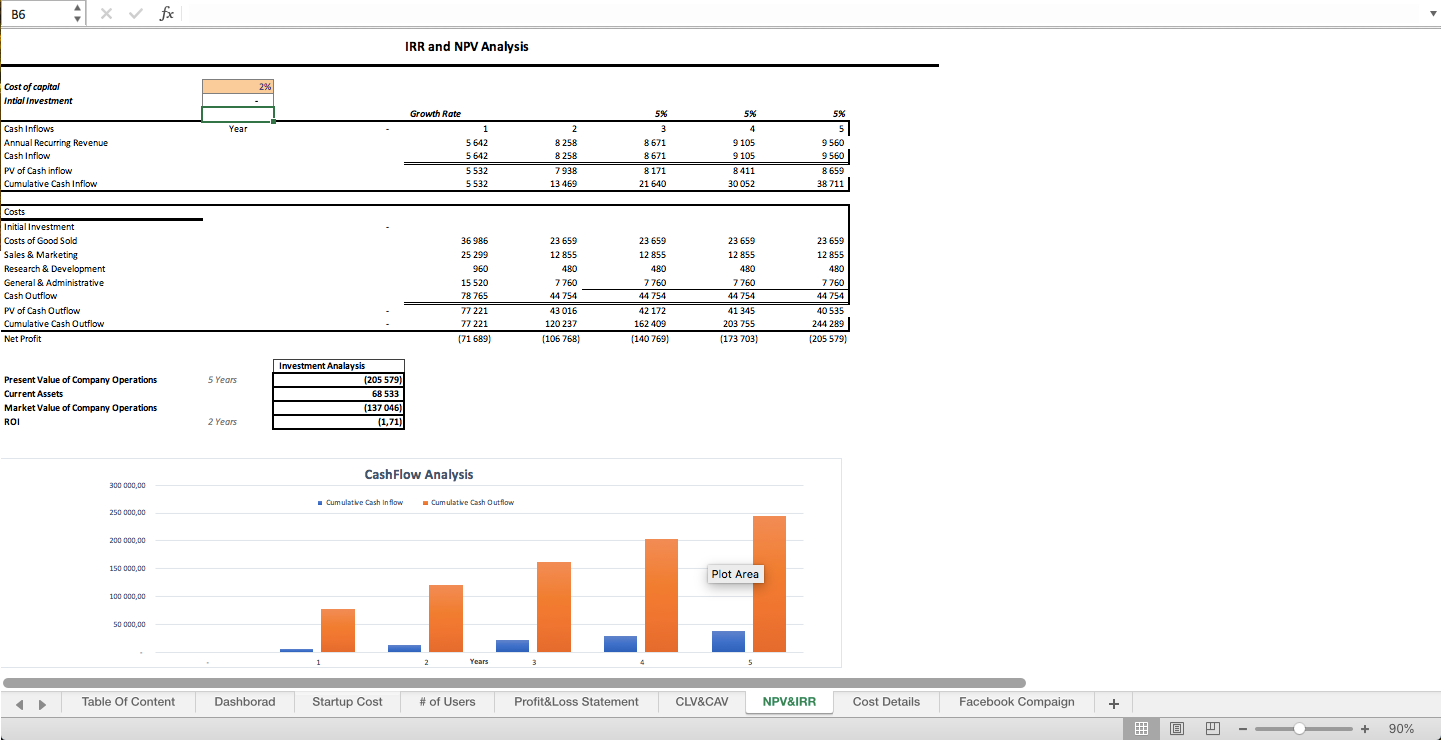
4. What is the NPV and IRR of the Ride HAiling Startup
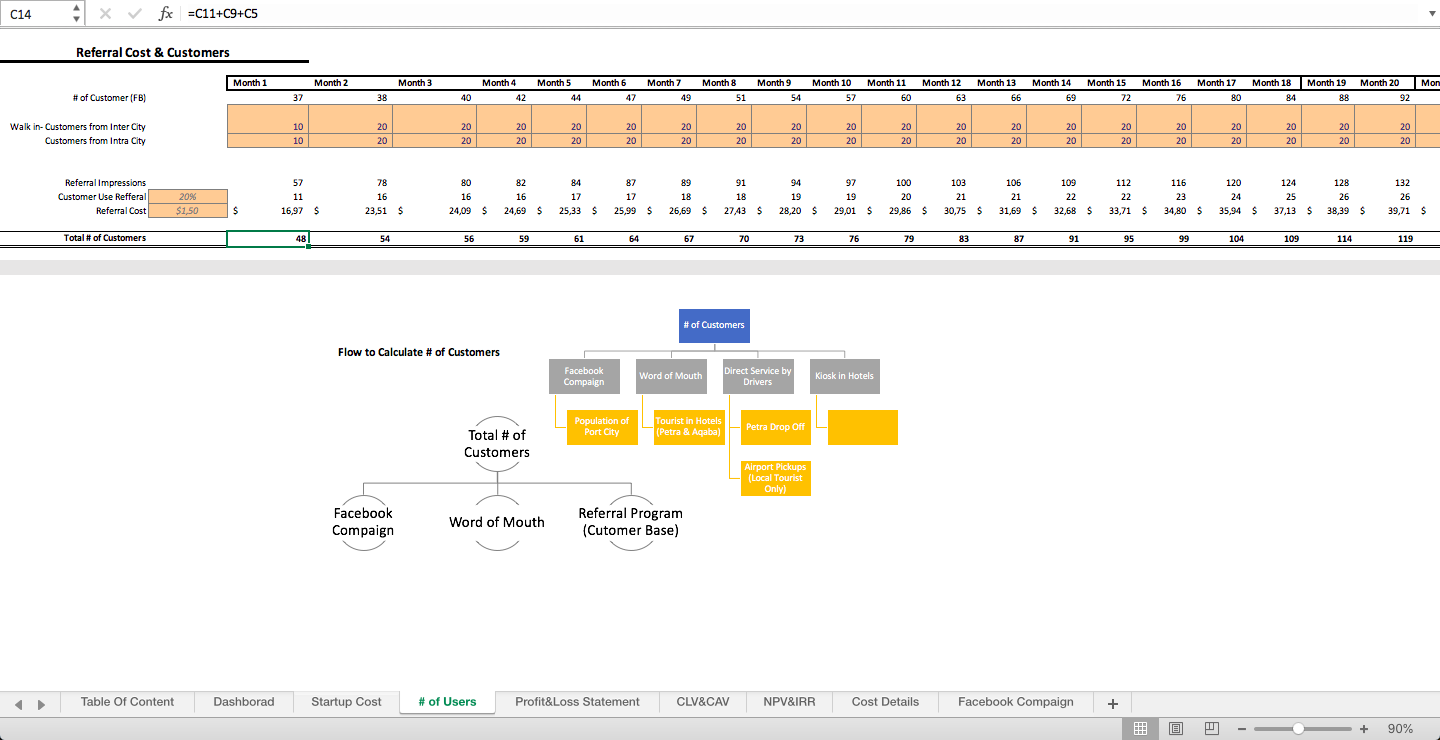
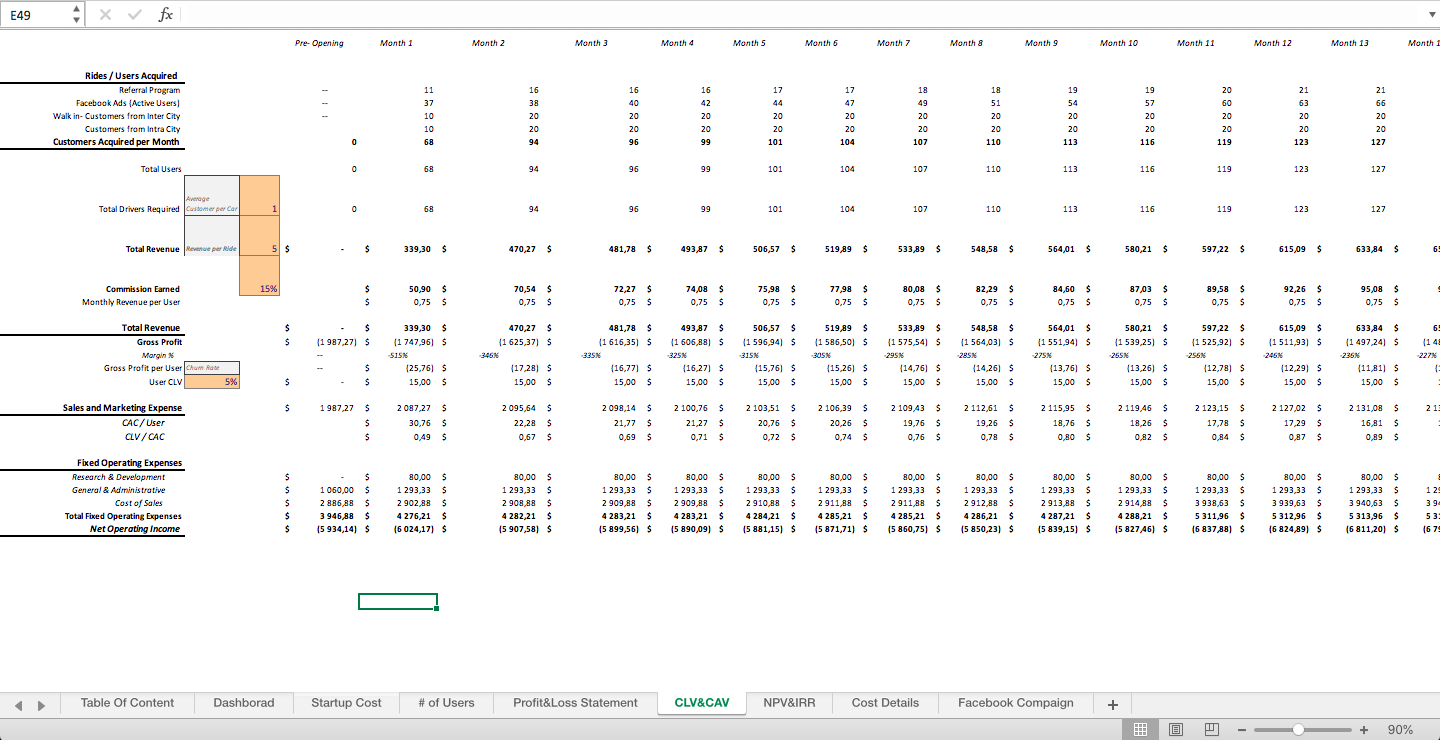
5. What are the CAC and CLV of the Riders
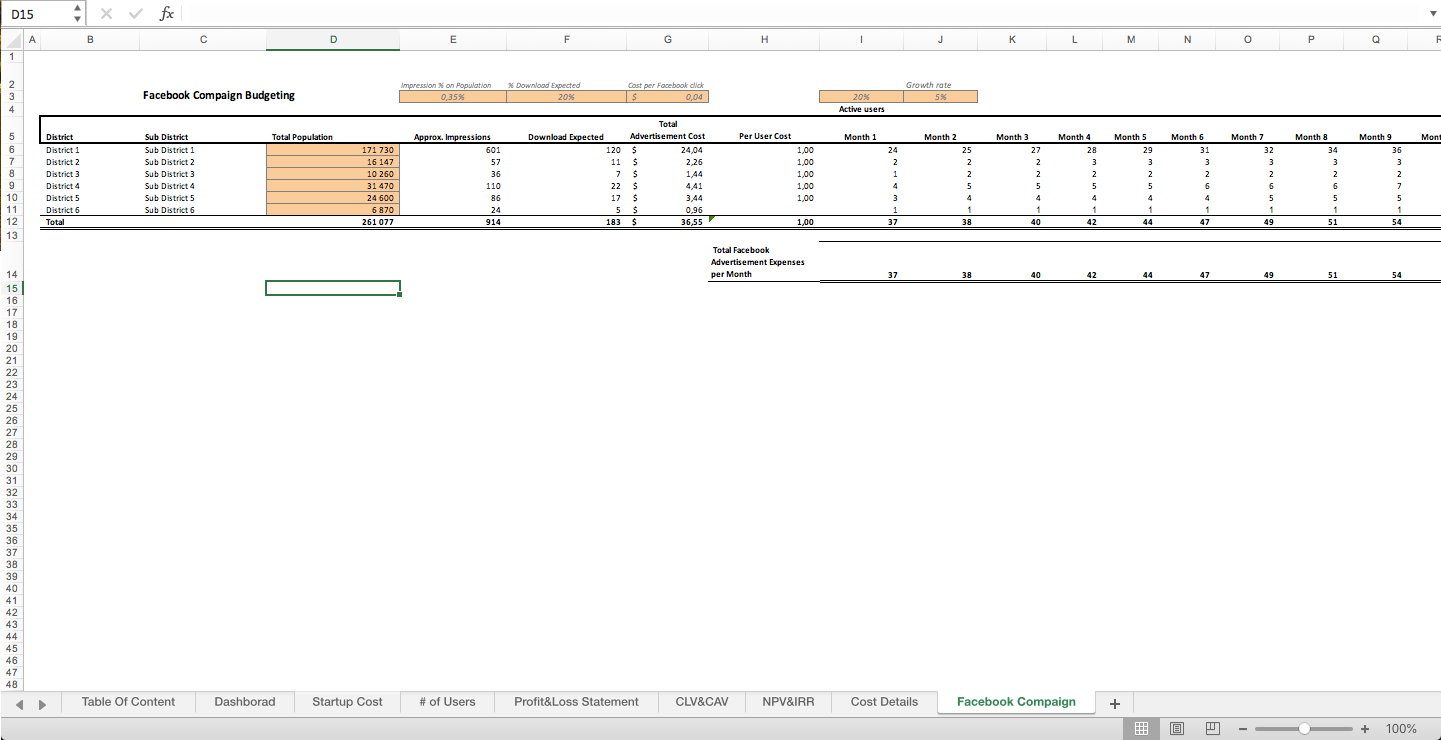
6. How many startups will be able to give equity share to an investor?

This Financial Model is specially designed for the RIDE-HAILING Services Provider who are seeking fund from an investor.


0.0 / 5 (0 votes)

please wait...