


Originally published: 09/05/2023 08:07
Publication number: ELQ-92252-1
View all versions & Certificate
Publication number: ELQ-92252-1
View all versions & Certificate

Nuts & Snacks Financial Model & Presentation
The financial model for a retail nuts, snacks, and coffee business is a tool that outlines the expected financial performance of the business + Presentation.
Description
The financial model for a retail nuts, snacks, and coffee business is a comprehensive tool that outlines the expected financial performance of the business on a monthly basis. The model takes into account various inputs such as the cost of goods sold, revenue projections, overhead expenses, and capital expenditures to provide a detailed analysis of the financial health of the business.
This financial model template will enable you to:
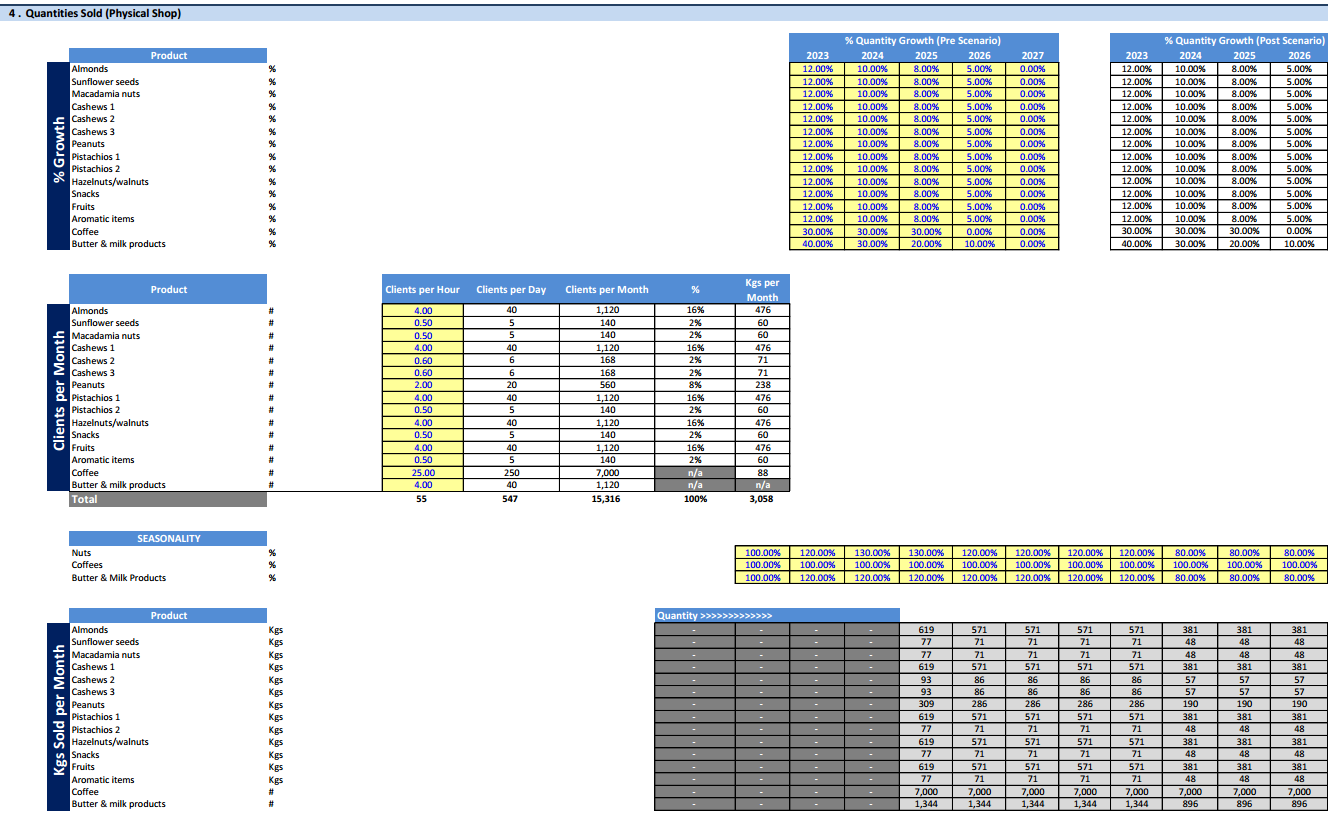
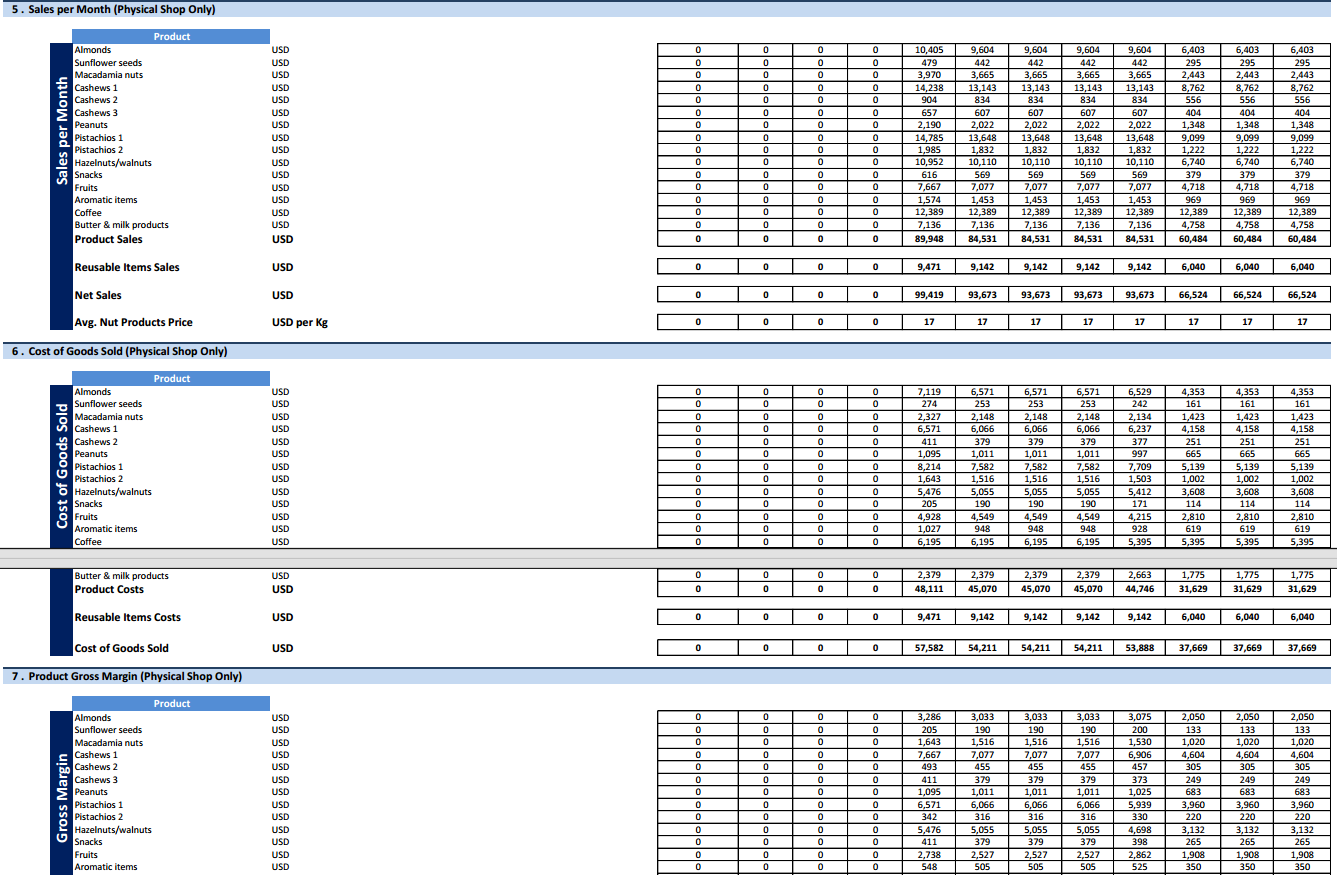
- Plan your in store sales
- Seasonality mechanism per month to account for fluctuations in your business
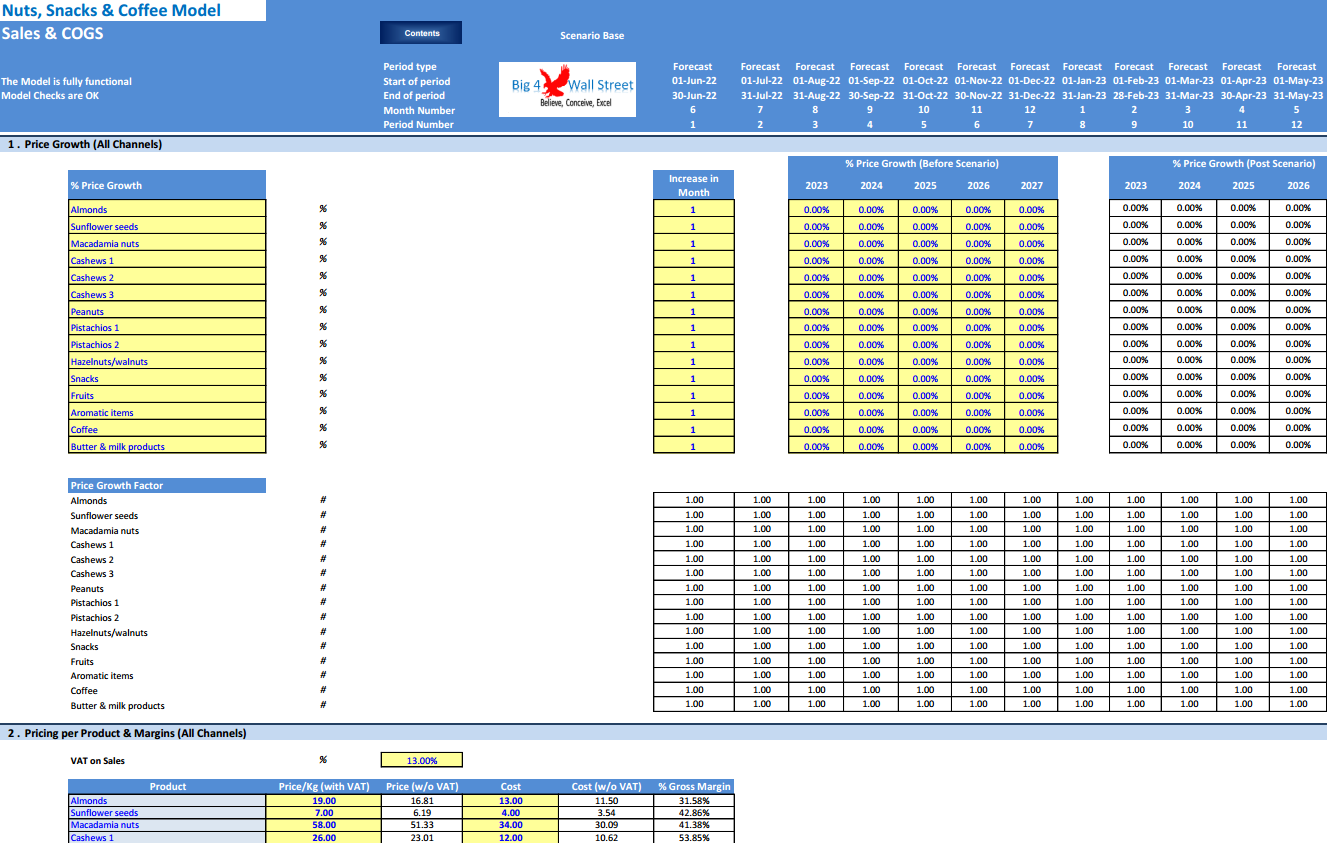
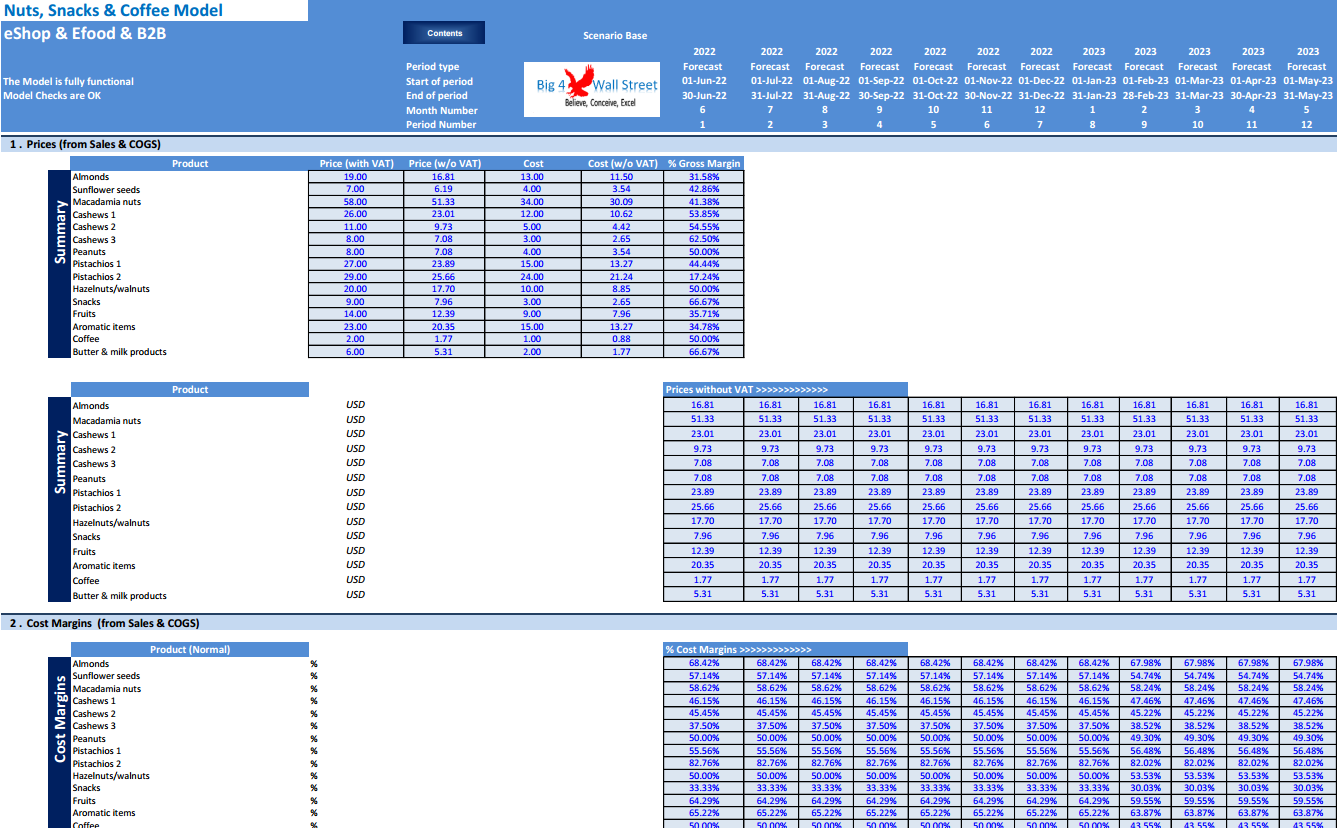
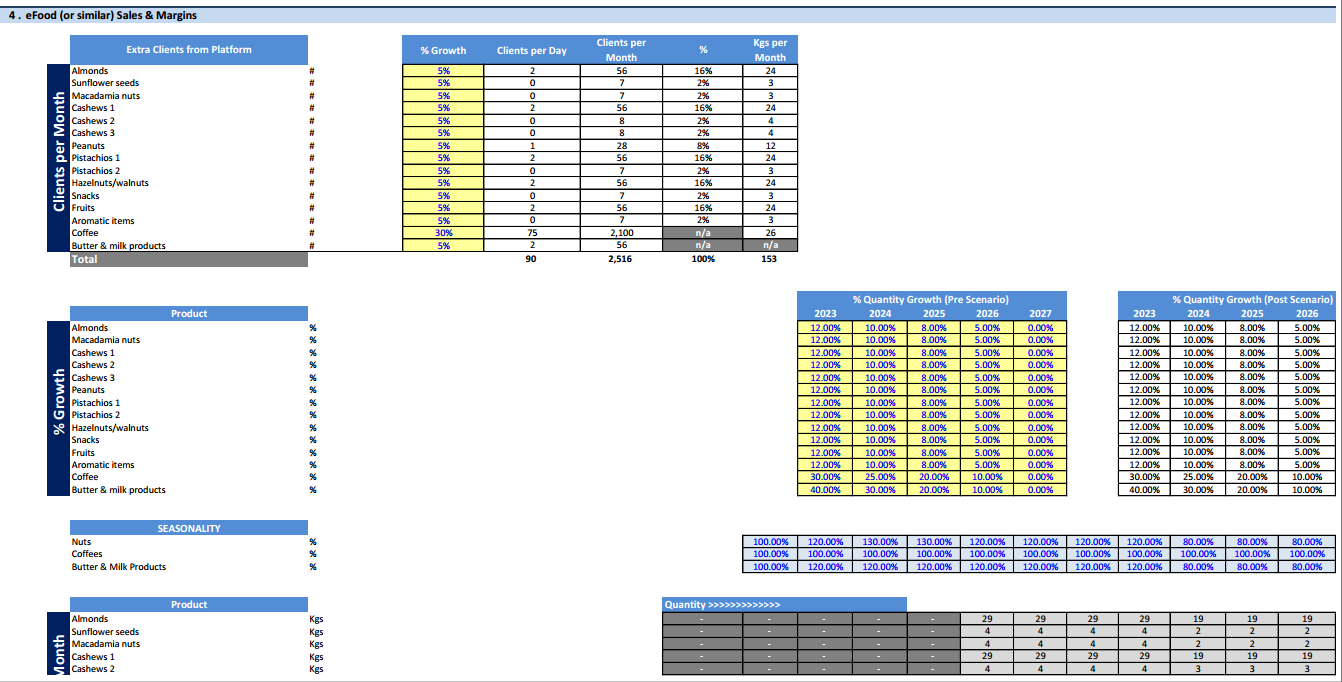
- Setting up products, pricing, sales mix and costs by product.
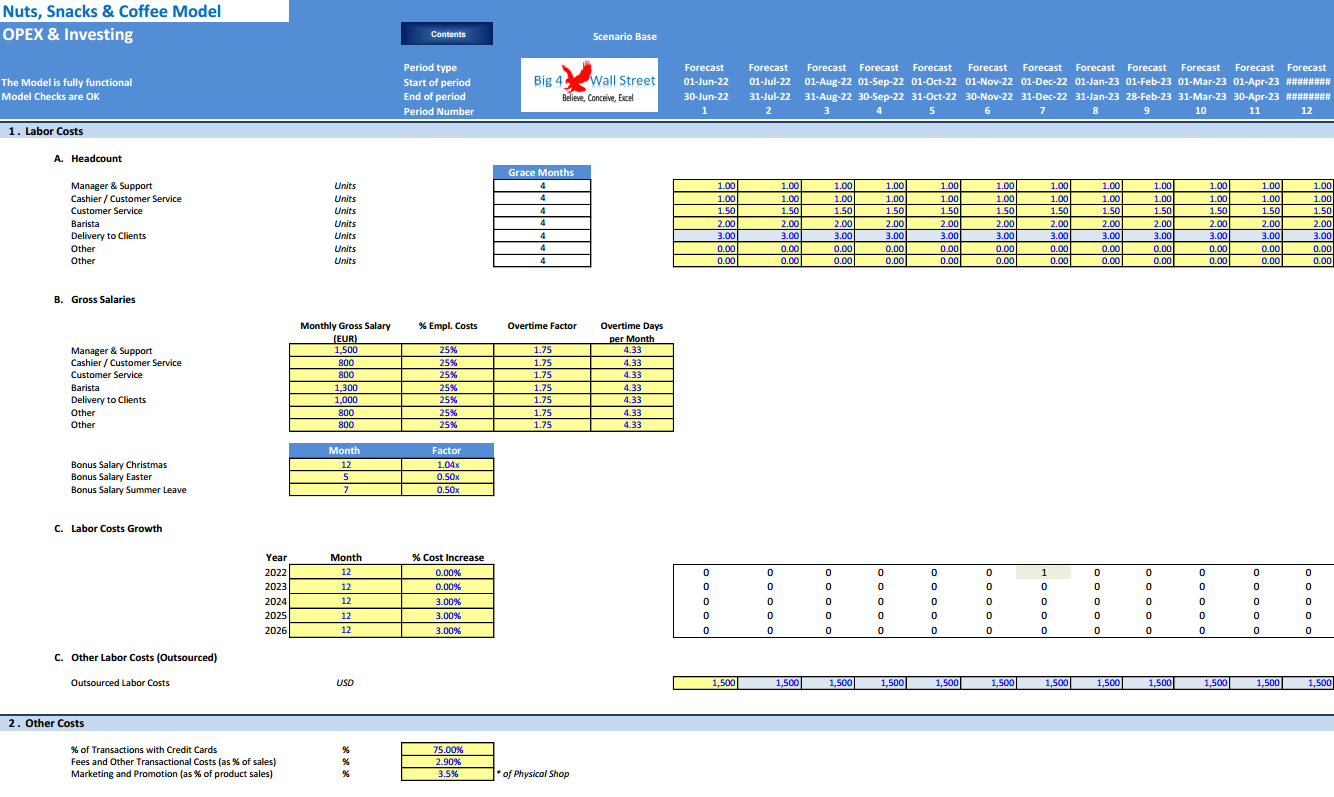
- Forecasting variable costs, labor costs and fixed costs
- Set the initial investment amount and the refurbishments / equipment needed
- Set the relevant currency and timing
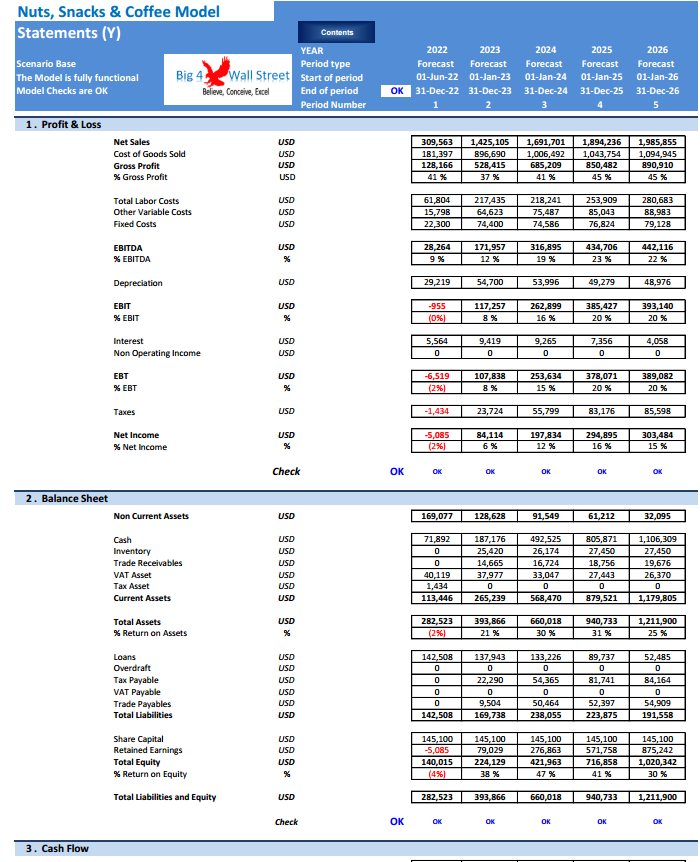
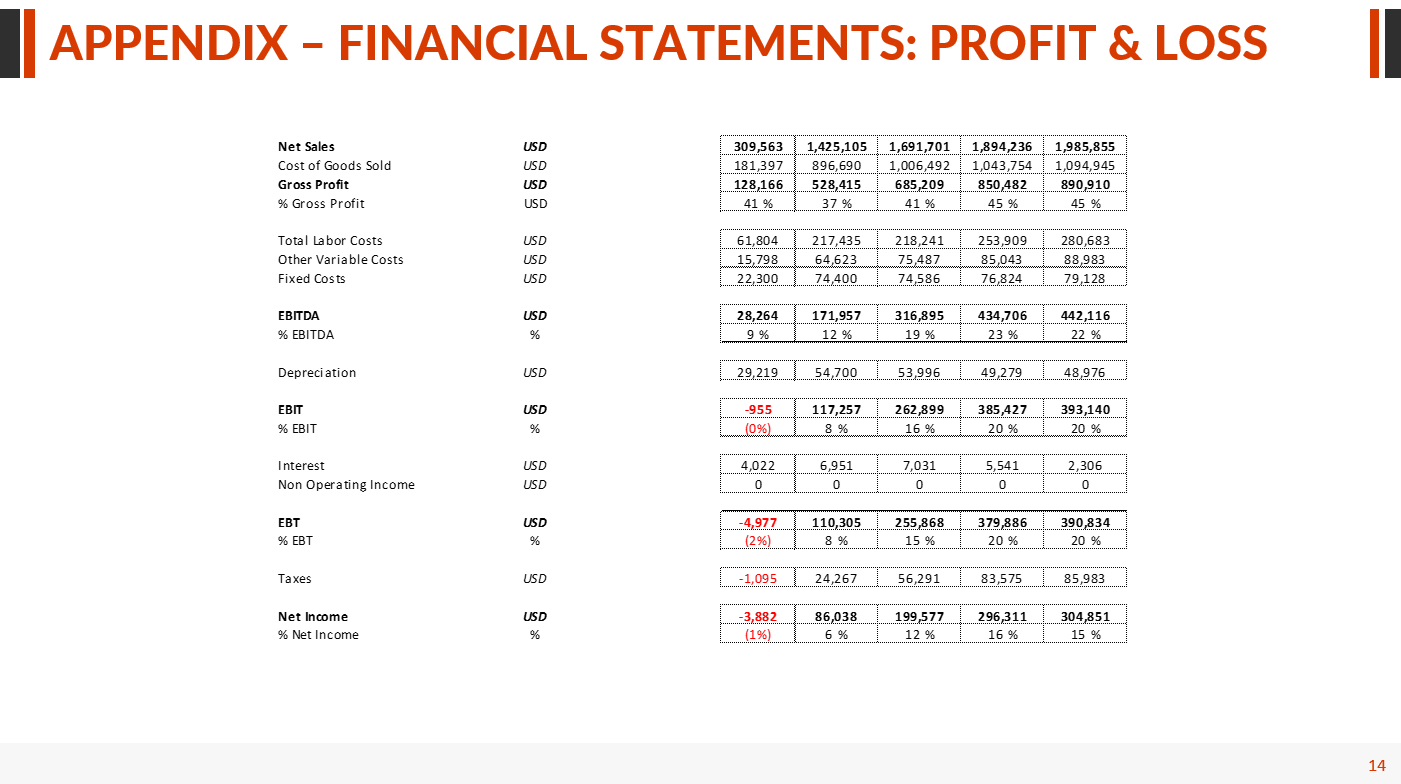
- Create the three financial statements (Profit and Loss, Balance Sheet and Cash Flow) on a monthly basis
- Financial Ratios to check the viability of your business
- Printable model as PDF for your investors
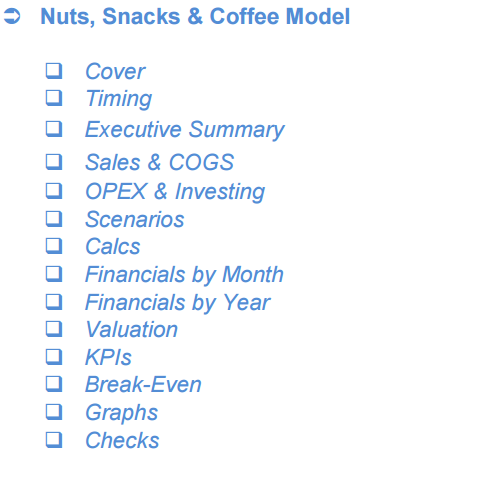
So a quick overview of the model, in the contents tab you can see the structure of the model and by clicking on any of the headlines to be redirected to the relevant worksheet.
On the timing tab you are able to feed the general information for the model such as: model name, responsible, timeline of the model and date and currency conventions.
Additionally there is a description of the color coding of the model in the same tab. Inputs are always depicted with a yellow fill and blue letters, call ups (that is direct links from other cells) are filled in light blue with blue letters while calculations are depicted with white fill and black characters.
There is also a color coding for the various tabs of the model. Yellow tabs are mostly assumptions tabs, grey tabs are calculations tabs, blue tabs are outputs tabs (that is effectively results or graphs) and finally light blue tabs are admin tabs (for example: the cover page, contents and checks).
The financial model includes the three primary financial statements - Profit and Loss, Balance Sheet, and Cash Flow Statement - which provide a complete picture of the company's financial performance. These statements are updated on a monthly basis and are used to assess the company's profitability, liquidity, and overall financial health.
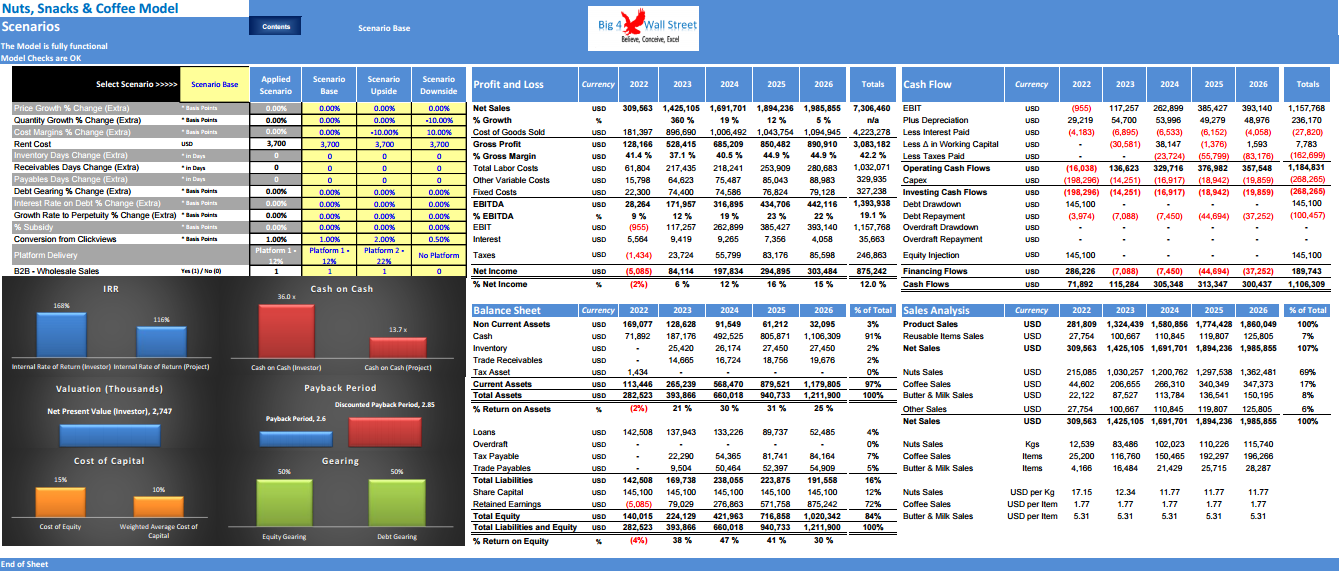
The financial model also includes multiple scenarios that test the sensitivity of the business to changes in key variables, such as pricing, volume, and cost of goods sold. This allows management to make informed decisions regarding pricing, rent, and operations based on different potential outcomes.
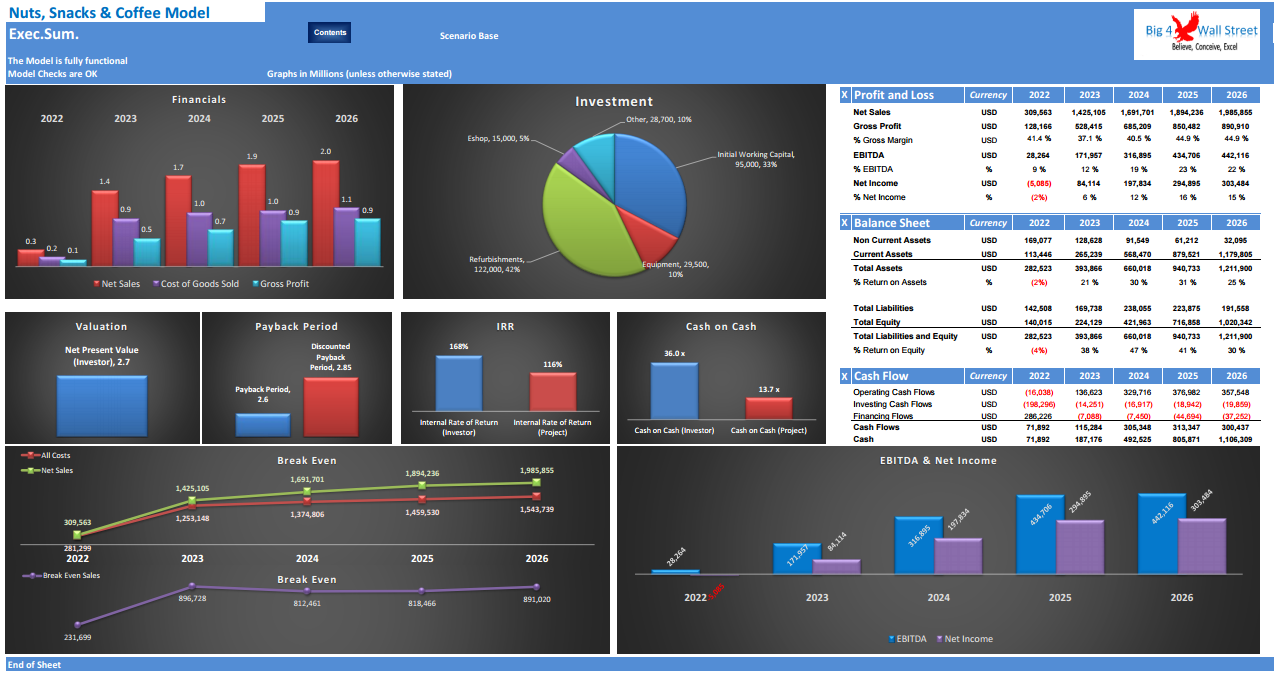
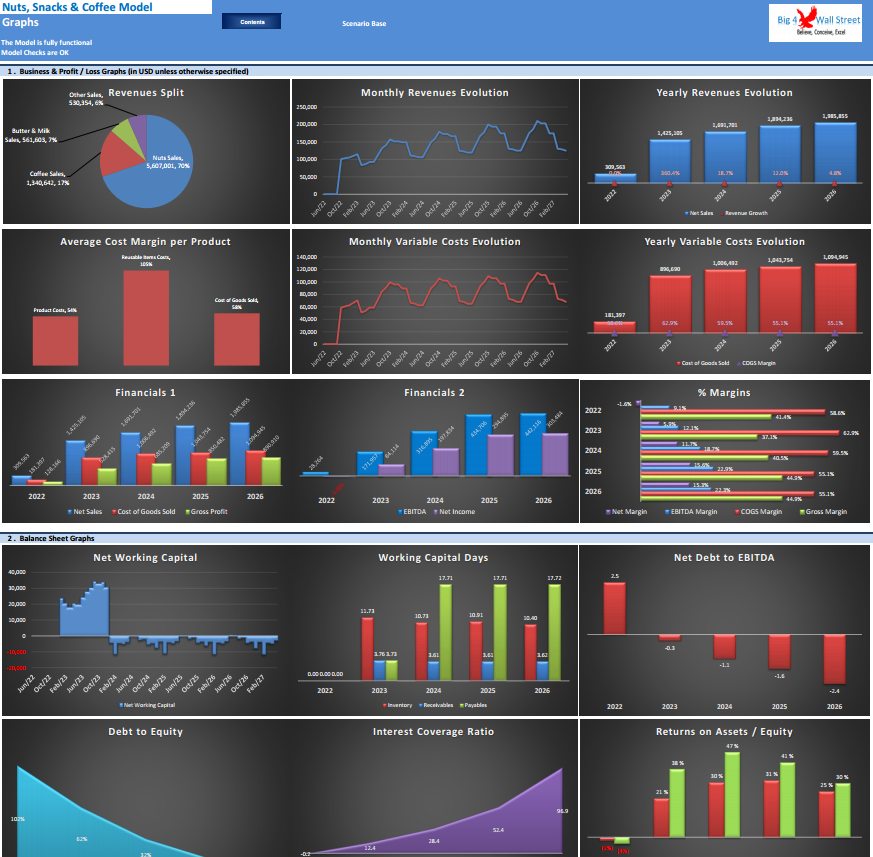
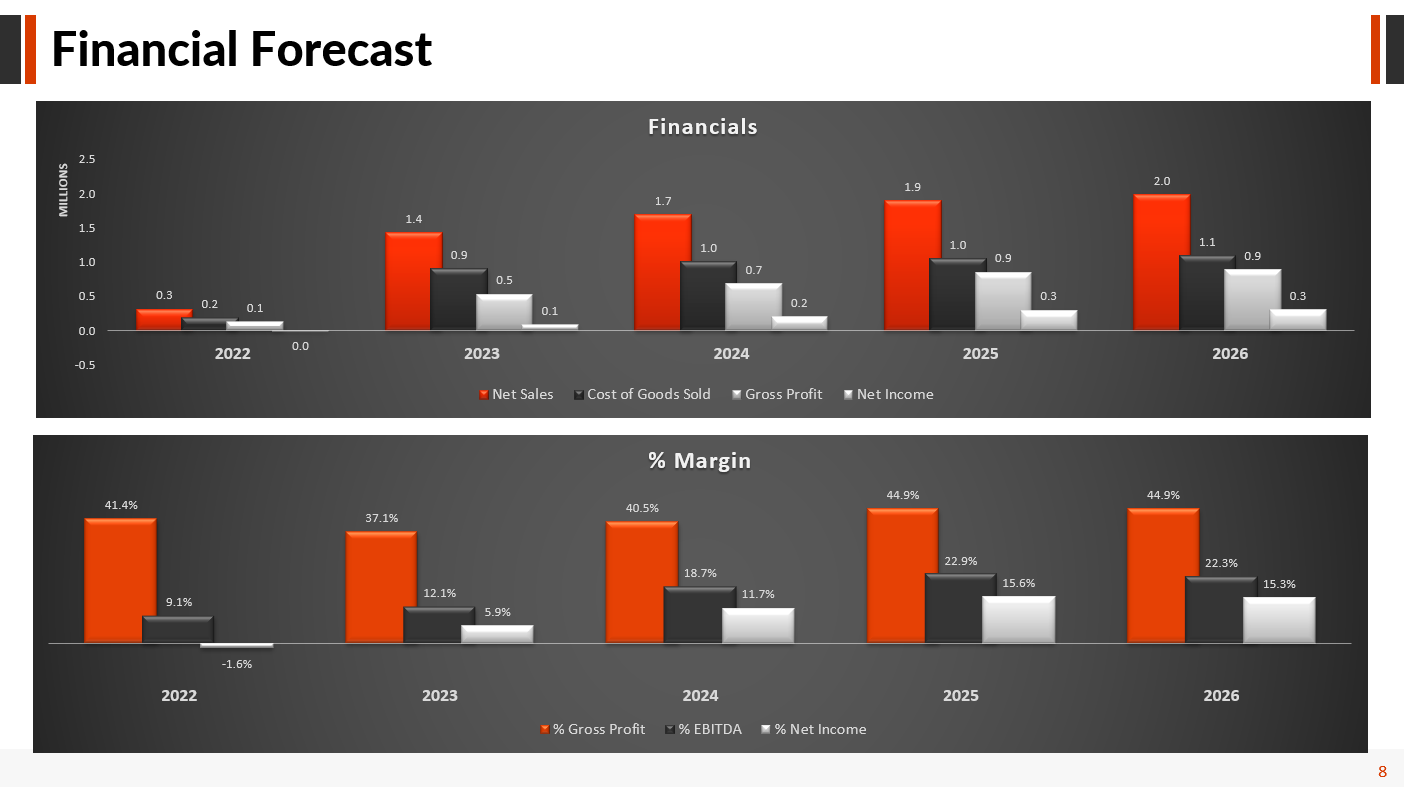
An executive summary is included in the financial model, which provides a high-level overview of the company's financial performance and highlights key metrics such as revenue, profit, and cash flow. Graphs are also included to visually represent key financial data, making it easier for stakeholders to understand the company's performance.
Moving on to the inputs tab, you can adjust the various assumptions of the model based on the specifications and requirements of your business.
On the calculation tab, all calculations are performed instantly without the need of an excel macro. The calculations follow the same logical flow as the in the inputs tab. As already mentioned no inputs from the use are needed here, as all the inputs are fed in the yellow cells on the inputs tab only.
On the Financial Statements tabs you can see the resulting income statement, balance sheet as well as the cash flow of the company and or project.
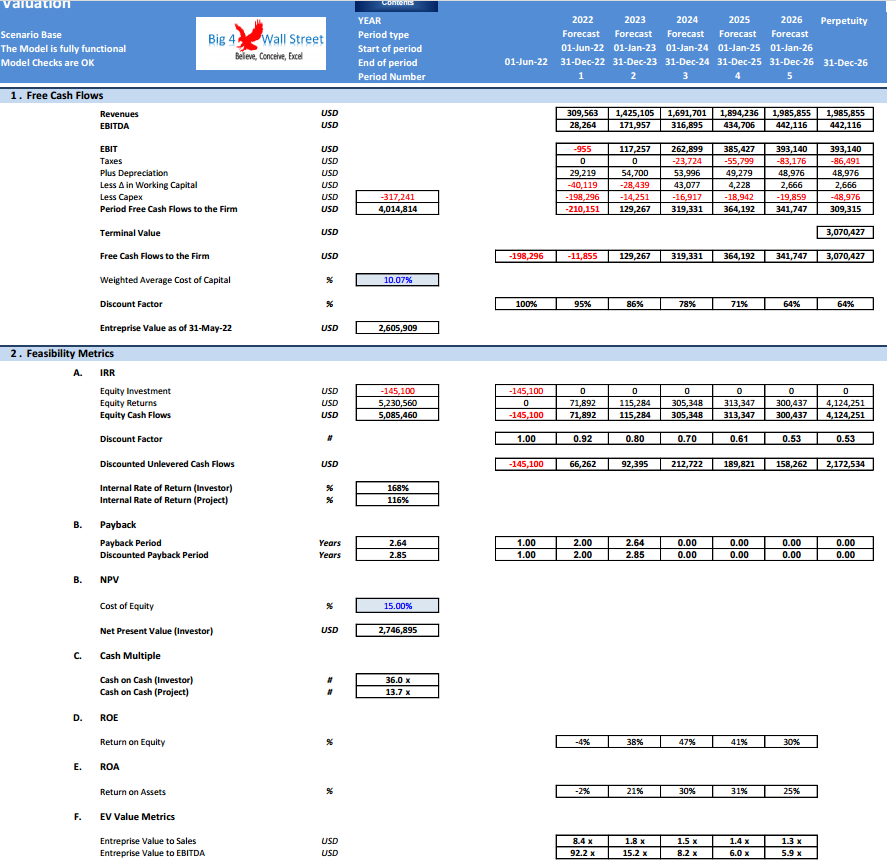
In the Valuation tab, the valuation of the company is performed. In the same tab you can also find some feasibility metrics such as Return on Equity, Return on Assets, Net Present Value, Internal Rate of Return and Cash on Cash Multiple.
Additionally, the financial model includes a range of financial ratios and key performance indicators (KPIs) that can be used to assess the company's financial health and compare it to industry benchmarks.
A break-even analysis is also included in the financial model, which calculates the point at which the business's revenue equals its costs. This allows management to determine how much revenue is required to cover fixed and variable costs and achieve profitability.
The graphs that are included in the financial model are also incredibly valuable. The graphs help visualize key data points and identify trends.
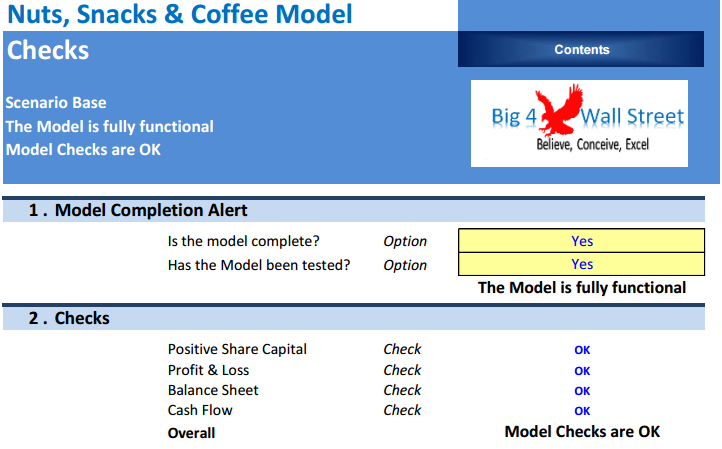
Finally the checks tab where the most critical checks are aggregated in this page. Whenever you see an error message in any page, you should consult this page to see where the error is coming from.
By leveraging the insights provided by the financial model, the company can develop effective strategies that drive revenue, maximize profits, and build a sustainable business for the future.
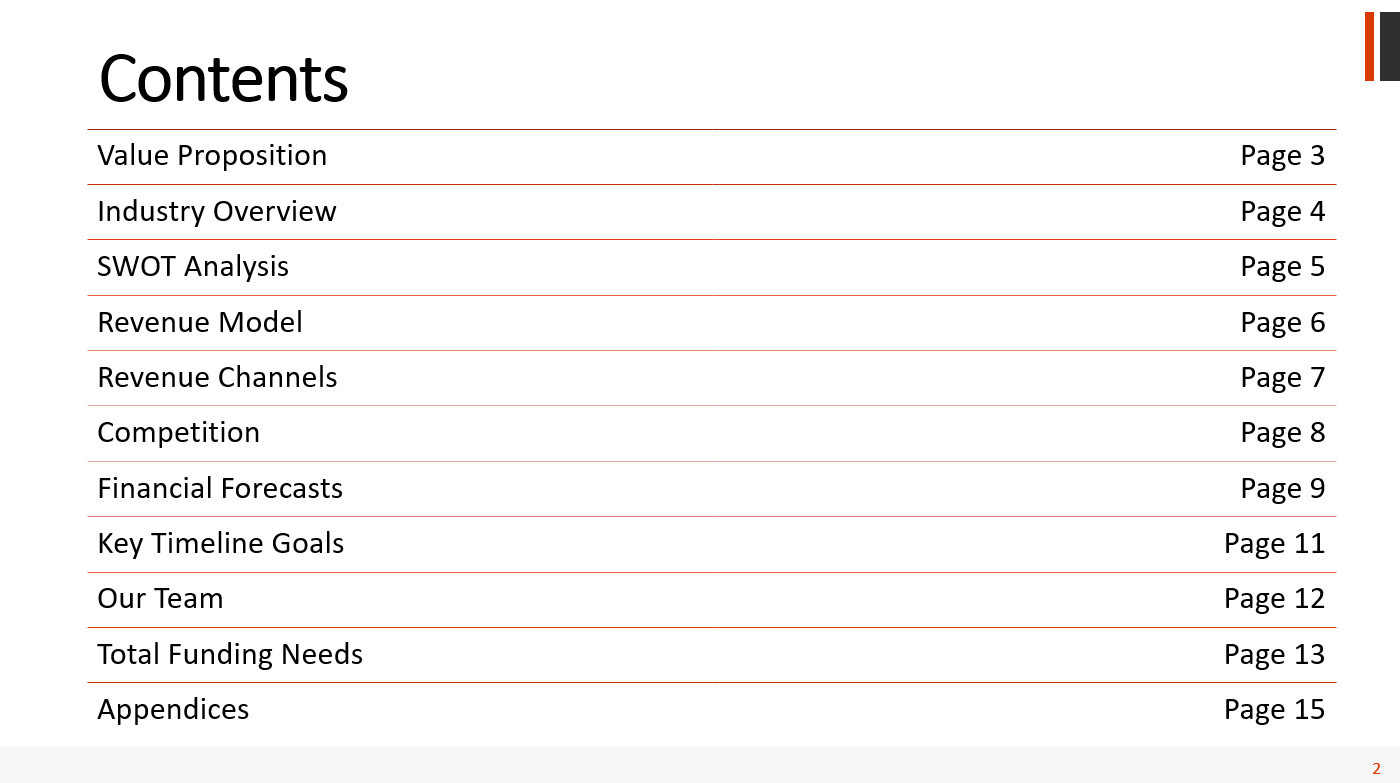
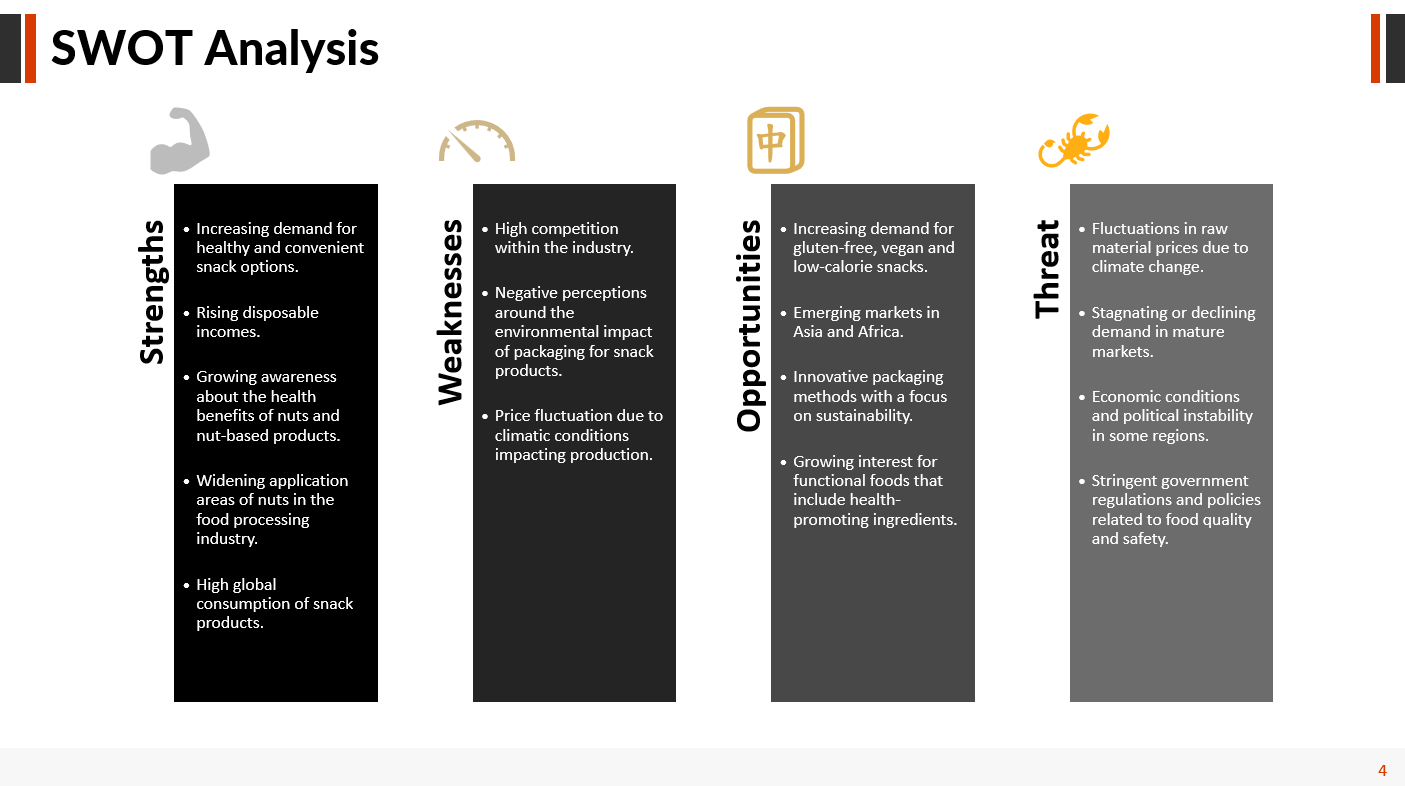
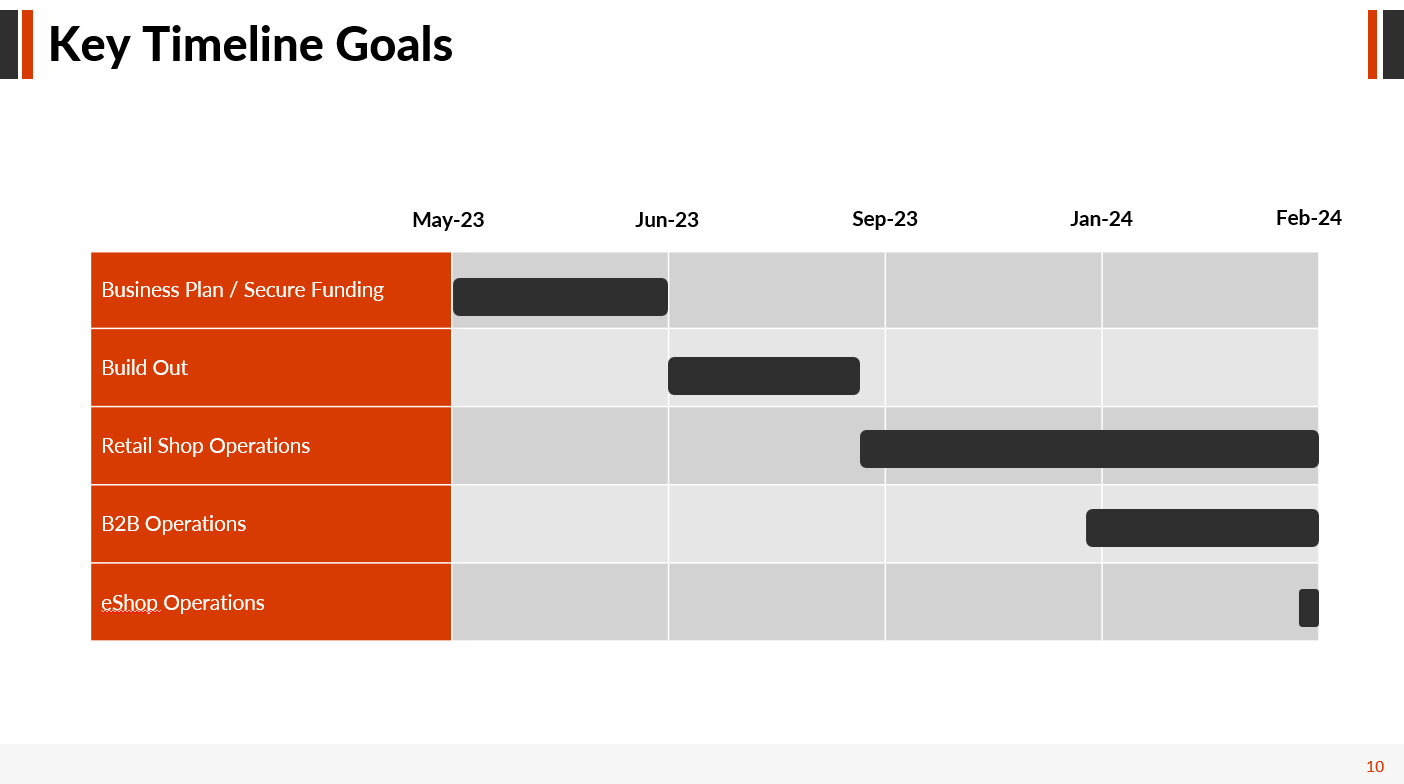
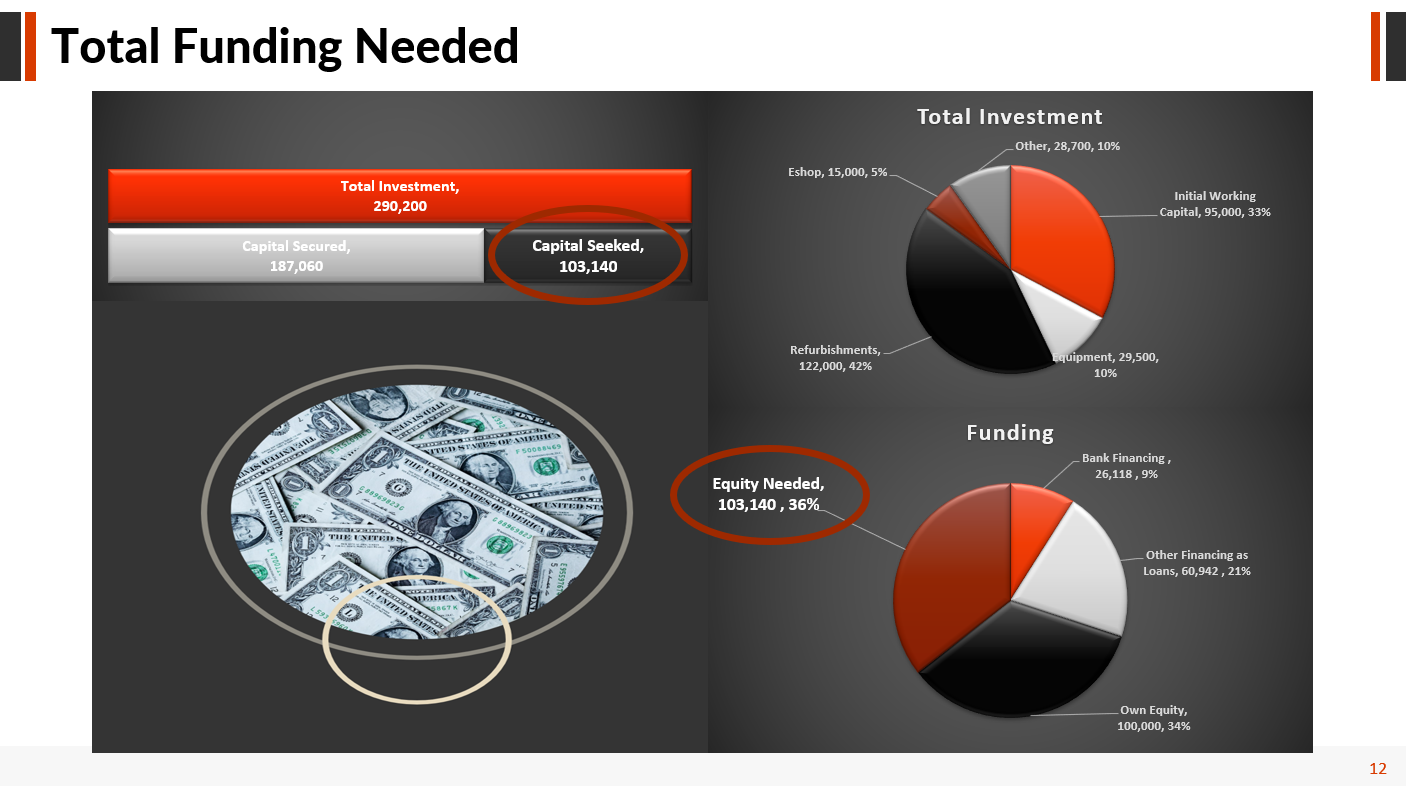
The presentation is for a retail shop selling nuts, snacks, and coffee, with the addition of online website sales through a platform and B2B sales. The plan includes an industry overview, SWOT analysis, revenue model, revenue channels, competition, financial projections, timeline of the project, team, funding needs and appendices.
The financial model for a retail nuts, snacks, and coffee business is a comprehensive tool that outlines the expected financial performance of the business on a monthly basis. The model takes into account various inputs such as the cost of goods sold, revenue projections, overhead expenses, and capital expenditures to provide a detailed analysis of the financial health of the business.
This financial model template will enable you to:
- Plan your in store sales
- Seasonality mechanism per month to account for fluctuations in your business
- Setting up products, pricing, sales mix and costs by product.
- Forecasting variable costs, labor costs and fixed costs
- Set the initial investment amount and the refurbishments / equipment needed
- Set the relevant currency and timing
- Create the three financial statements (Profit and Loss, Balance Sheet and Cash Flow) on a monthly basis
- Financial Ratios to check the viability of your business
- Printable model as PDF for your investors
So a quick overview of the model, in the contents tab you can see the structure of the model and by clicking on any of the headlines to be redirected to the relevant worksheet.
On the timing tab you are able to feed the general information for the model such as: model name, responsible, timeline of the model and date and currency conventions.
Additionally there is a description of the color coding of the model in the same tab. Inputs are always depicted with a yellow fill and blue letters, call ups (that is direct links from other cells) are filled in light blue with blue letters while calculations are depicted with white fill and black characters.
There is also a color coding for the various tabs of the model. Yellow tabs are mostly assumptions tabs, grey tabs are calculations tabs, blue tabs are outputs tabs (that is effectively results or graphs) and finally light blue tabs are admin tabs (for example: the cover page, contents and checks).
The financial model includes the three primary financial statements - Profit and Loss, Balance Sheet, and Cash Flow Statement - which provide a complete picture of the company's financial performance. These statements are updated on a monthly basis and are used to assess the company's profitability, liquidity, and overall financial health.
The financial model also includes multiple scenarios that test the sensitivity of the business to changes in key variables, such as pricing, volume, and cost of goods sold. This allows management to make informed decisions regarding pricing, rent, and operations based on different potential outcomes.
An executive summary is included in the financial model, which provides a high-level overview of the company's financial performance and highlights key metrics such as revenue, profit, and cash flow. Graphs are also included to visually represent key financial data, making it easier for stakeholders to understand the company's performance.
Moving on to the inputs tab, you can adjust the various assumptions of the model based on the specifications and requirements of your business.
On the calculation tab, all calculations are performed instantly without the need of an excel macro. The calculations follow the same logical flow as the in the inputs tab. As already mentioned no inputs from the use are needed here, as all the inputs are fed in the yellow cells on the inputs tab only.
On the Financial Statements tabs you can see the resulting income statement, balance sheet as well as the cash flow of the company and or project.
In the Valuation tab, the valuation of the company is performed. In the same tab you can also find some feasibility metrics such as Return on Equity, Return on Assets, Net Present Value, Internal Rate of Return and Cash on Cash Multiple.
Additionally, the financial model includes a range of financial ratios and key performance indicators (KPIs) that can be used to assess the company's financial health and compare it to industry benchmarks.
A break-even analysis is also included in the financial model, which calculates the point at which the business's revenue equals its costs. This allows management to determine how much revenue is required to cover fixed and variable costs and achieve profitability.
The graphs that are included in the financial model are also incredibly valuable. The graphs help visualize key data points and identify trends.
Finally the checks tab where the most critical checks are aggregated in this page. Whenever you see an error message in any page, you should consult this page to see where the error is coming from.
By leveraging the insights provided by the financial model, the company can develop effective strategies that drive revenue, maximize profits, and build a sustainable business for the future.
The presentation is for a retail shop selling nuts, snacks, and coffee, with the addition of online website sales through a platform and B2B sales. The plan includes an industry overview, SWOT analysis, revenue model, revenue channels, competition, financial projections, timeline of the project, team, funding needs and appendices.
This Best Practice includes
1 Excel and 1 Presentation
