Originally published: 13/03/2020 08:32
Publication number: ELQ-48948-1
View all versions & Certificate
Publication number: ELQ-48948-1
View all versions & Certificate

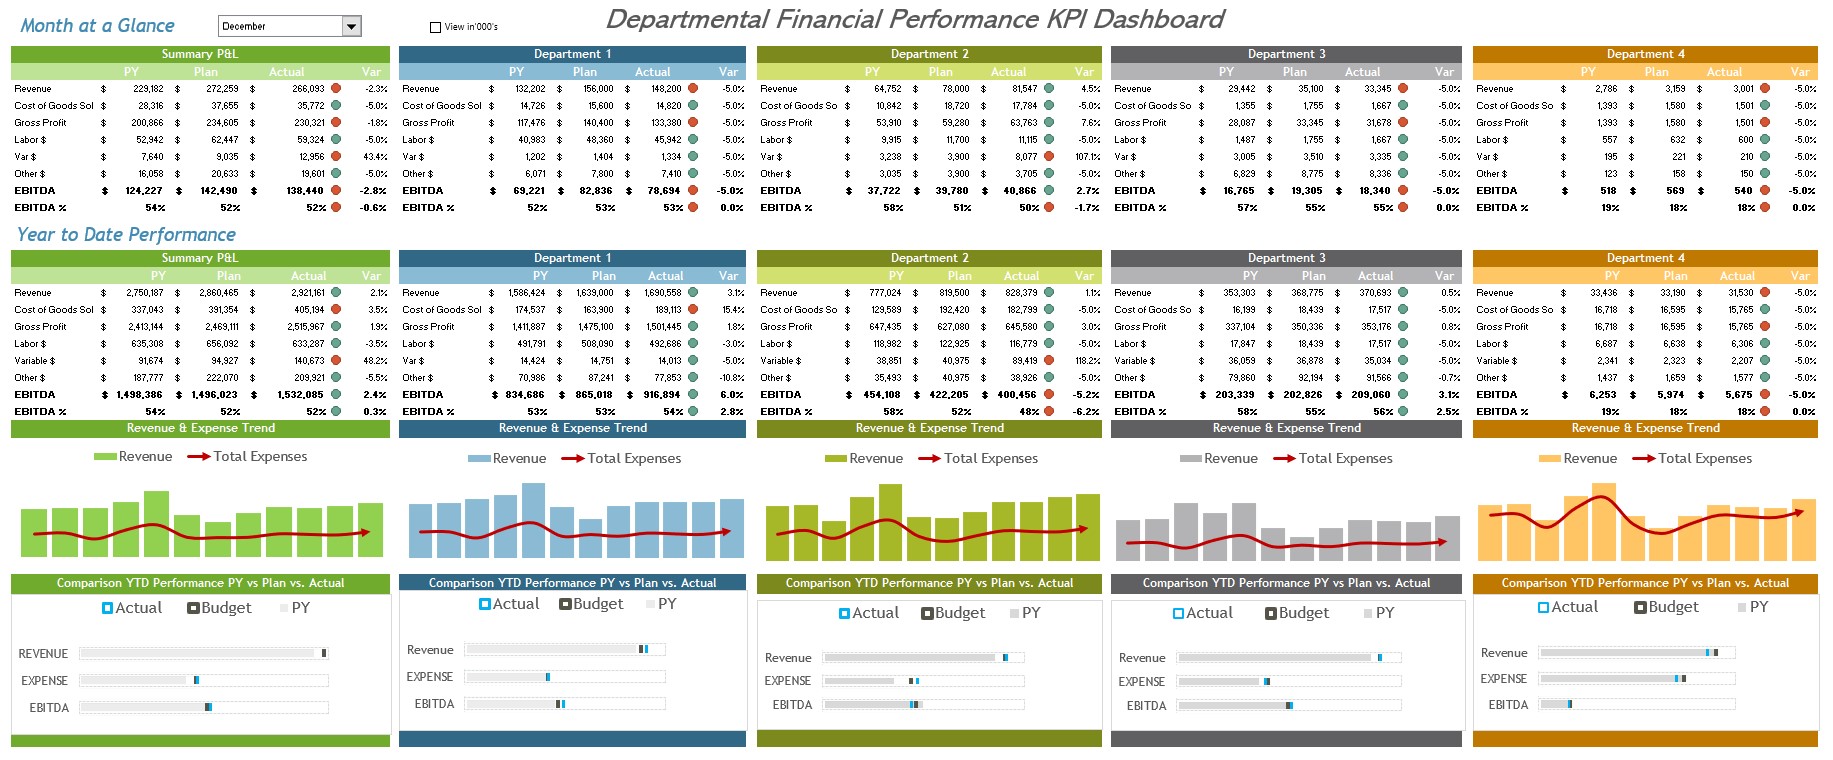
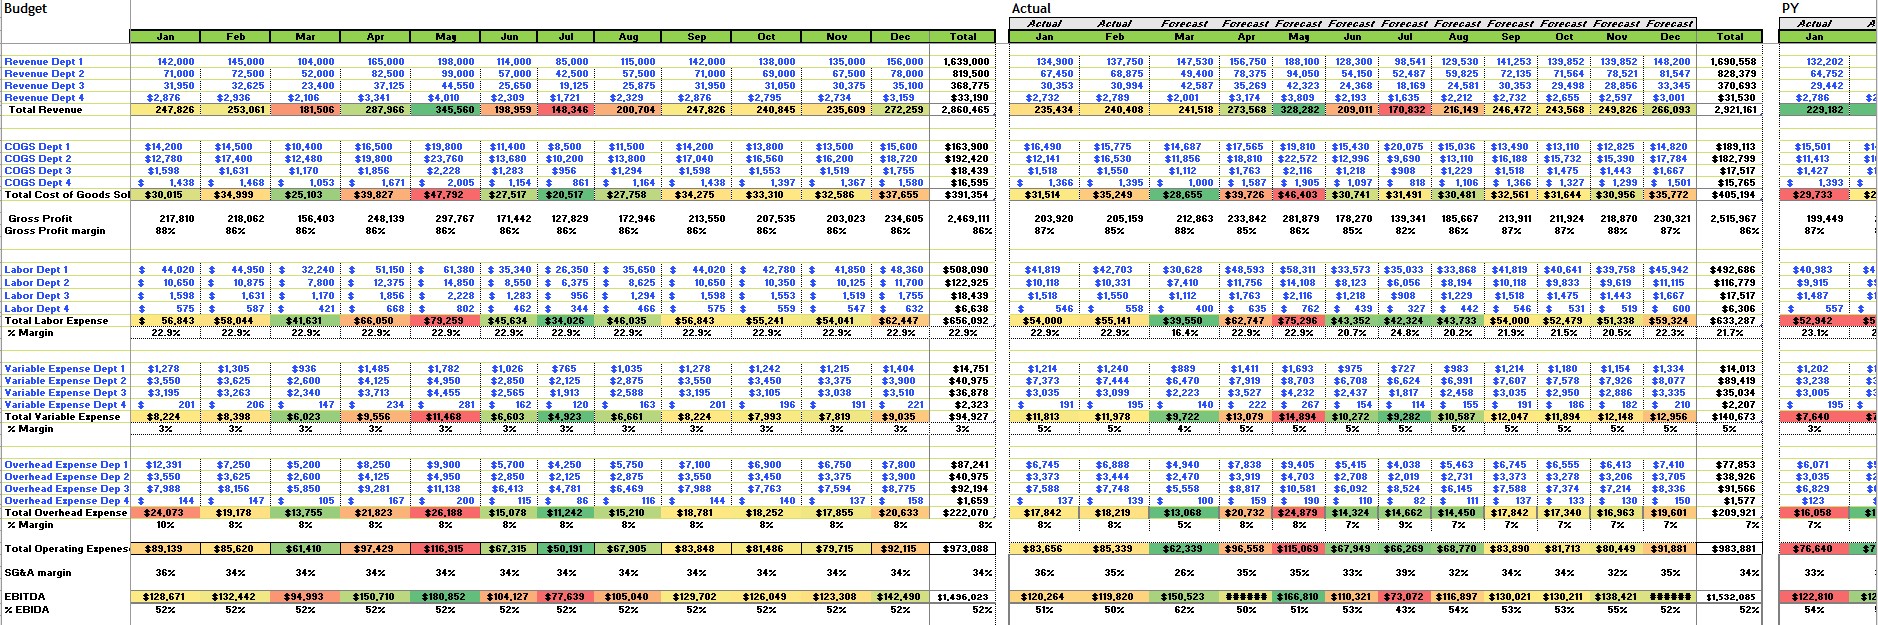
Departmental Performance KPI (Key Performance Indicator) Dashboard.
An easy-to-use Departmental Financial Performance KPI Dashboard in Microsoft Excel.
