Trade Show & Field Marketing ROI Terminal — B2B Event Revenue Attribution Sheet
Originally published: 22/12/2025 21:45
Last version published: 13/07/2026 20:19
Publication number: ELQ-22055-2
View all versions & Certificate
certified

Trade Show & Field Marketing ROI Terminal — B2B Event Revenue Attribution Sheet

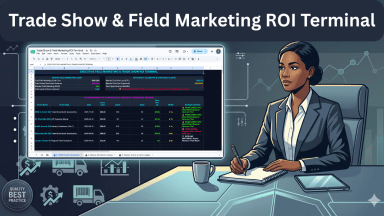
Track trade show sponsor costs, monitor booth lead capture metrics, and eliminate toxic event spend with an automated dark-mode attribution dashboard.

Description

In B2B tech and enterprise sales, Field Marketing and Trade Show sponsorships represent massive, high-risk capital allocations. Companies routinely drop $50,000 to $250,000+ per event to sponsor booths, host executive dinners, or command regional roadshows. Yet, when the board asks for an exact return on investment (ROI), marketing teams are frequently reduced to demonstrating vanity metrics like "booth badge scans" and aggregate attendance logs. Without clear, dollar-for-dollar pipeline attribution, scaling brands remain blind to true event profitability, wasting budget on underperforming venues while missing high-yield opportunities.


To bridge this gap, enterprises spend tens of thousands of dollars annually on specialized event management platforms and bloated CRM attribution modules just to map event costs back to closed-won sales opportunities.


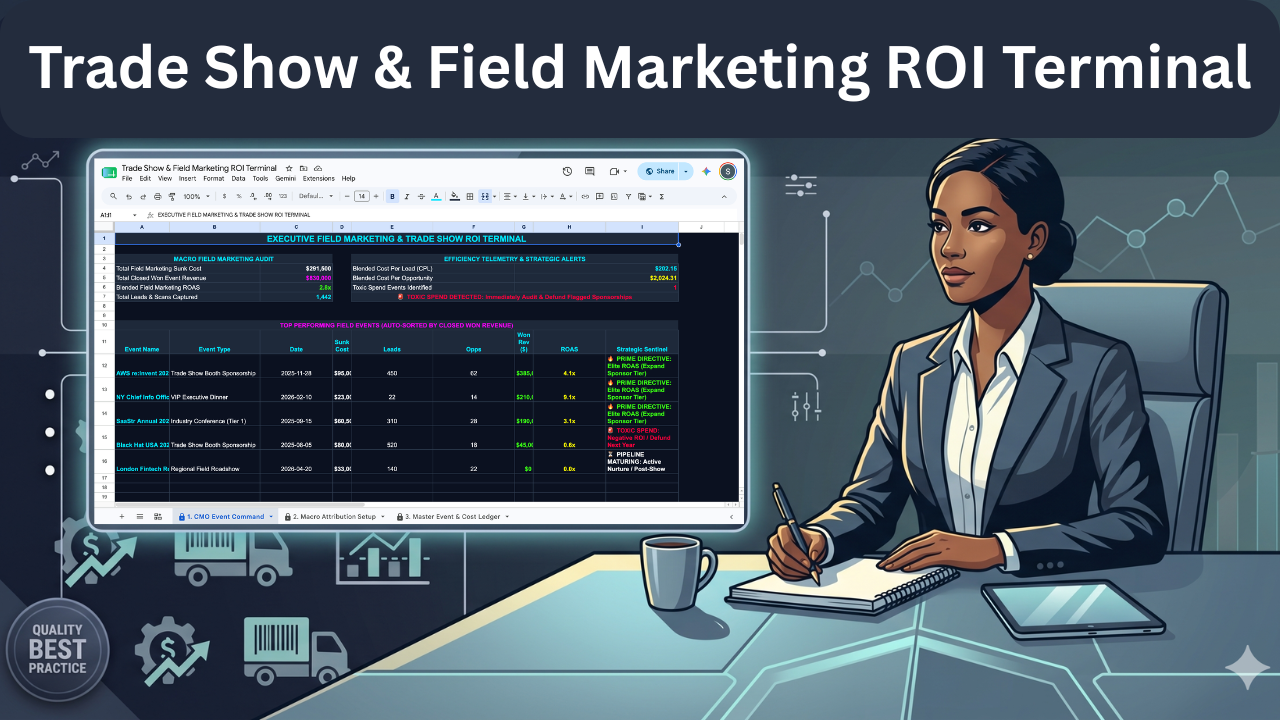
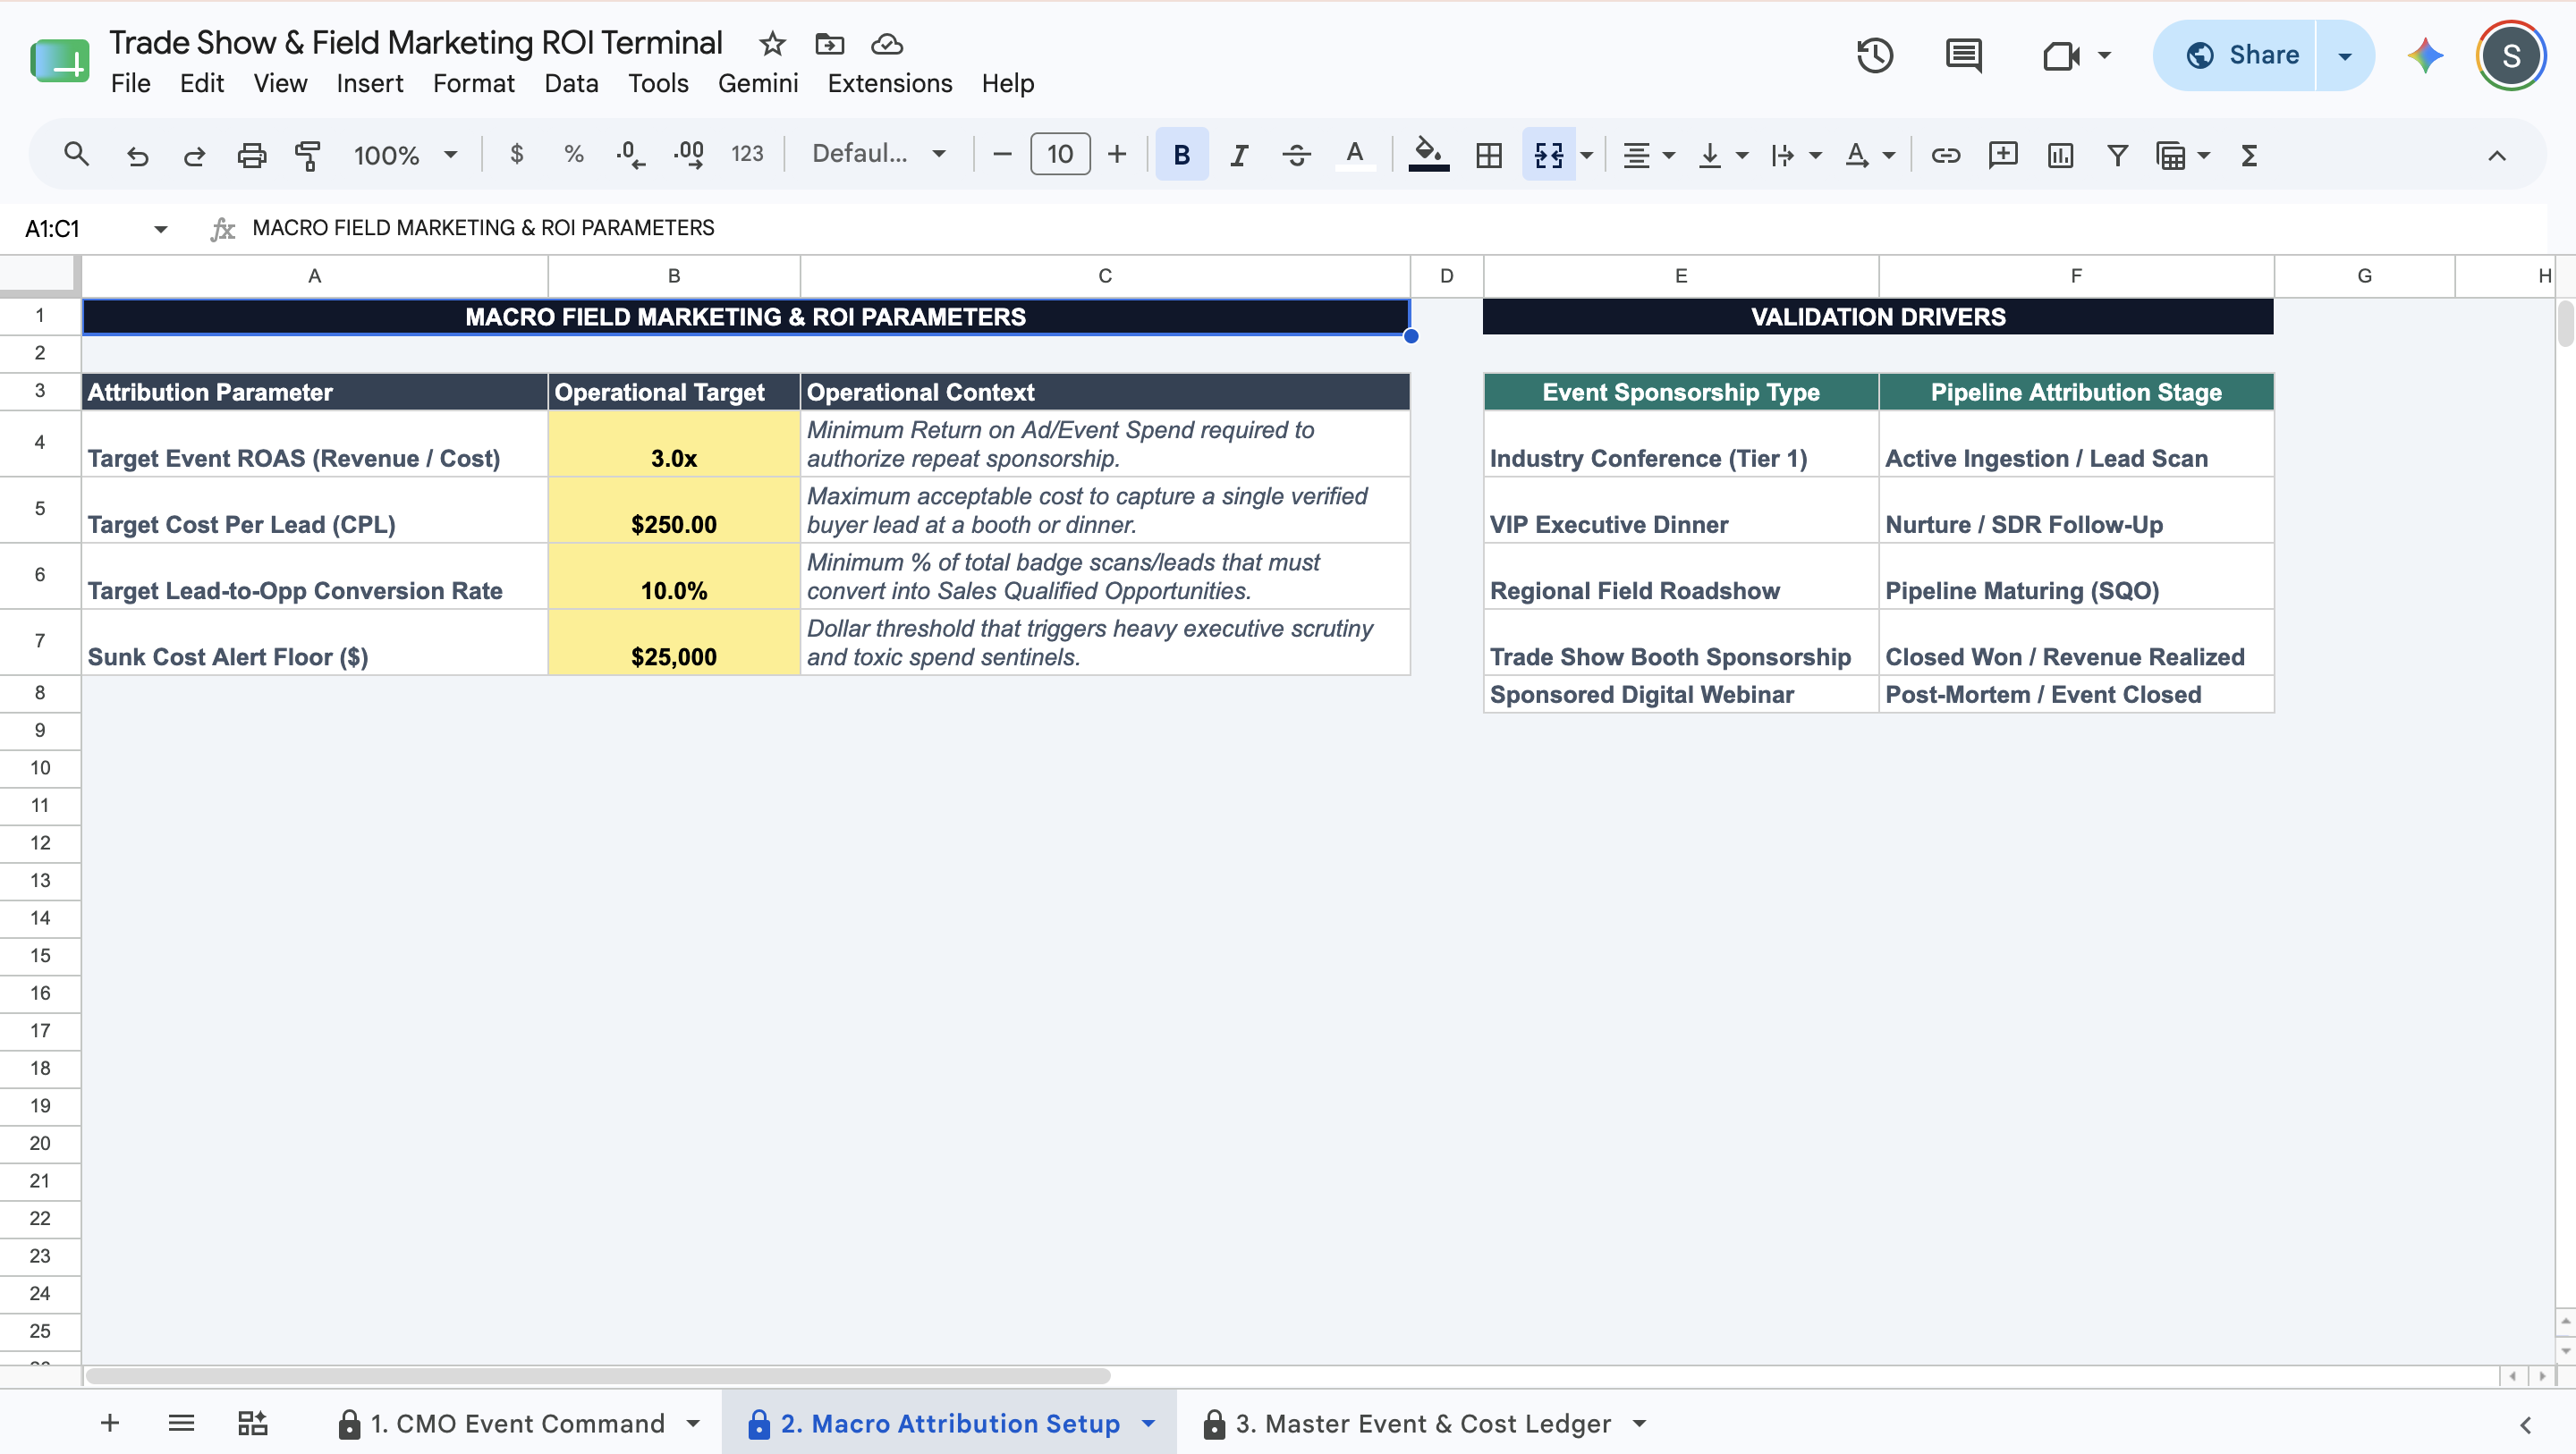
The Trade Show & Field Marketing ROI Terminal completely replaces that software overhead. Built natively and exclusively for Google Sheets, it delivers an institutional-grade event attribution engine. Wrapped in a professional, cybernetic dark-mode interface with high-contrast neon accents, it translates chaotic sponsorship expenditures into an executive marketing command center:


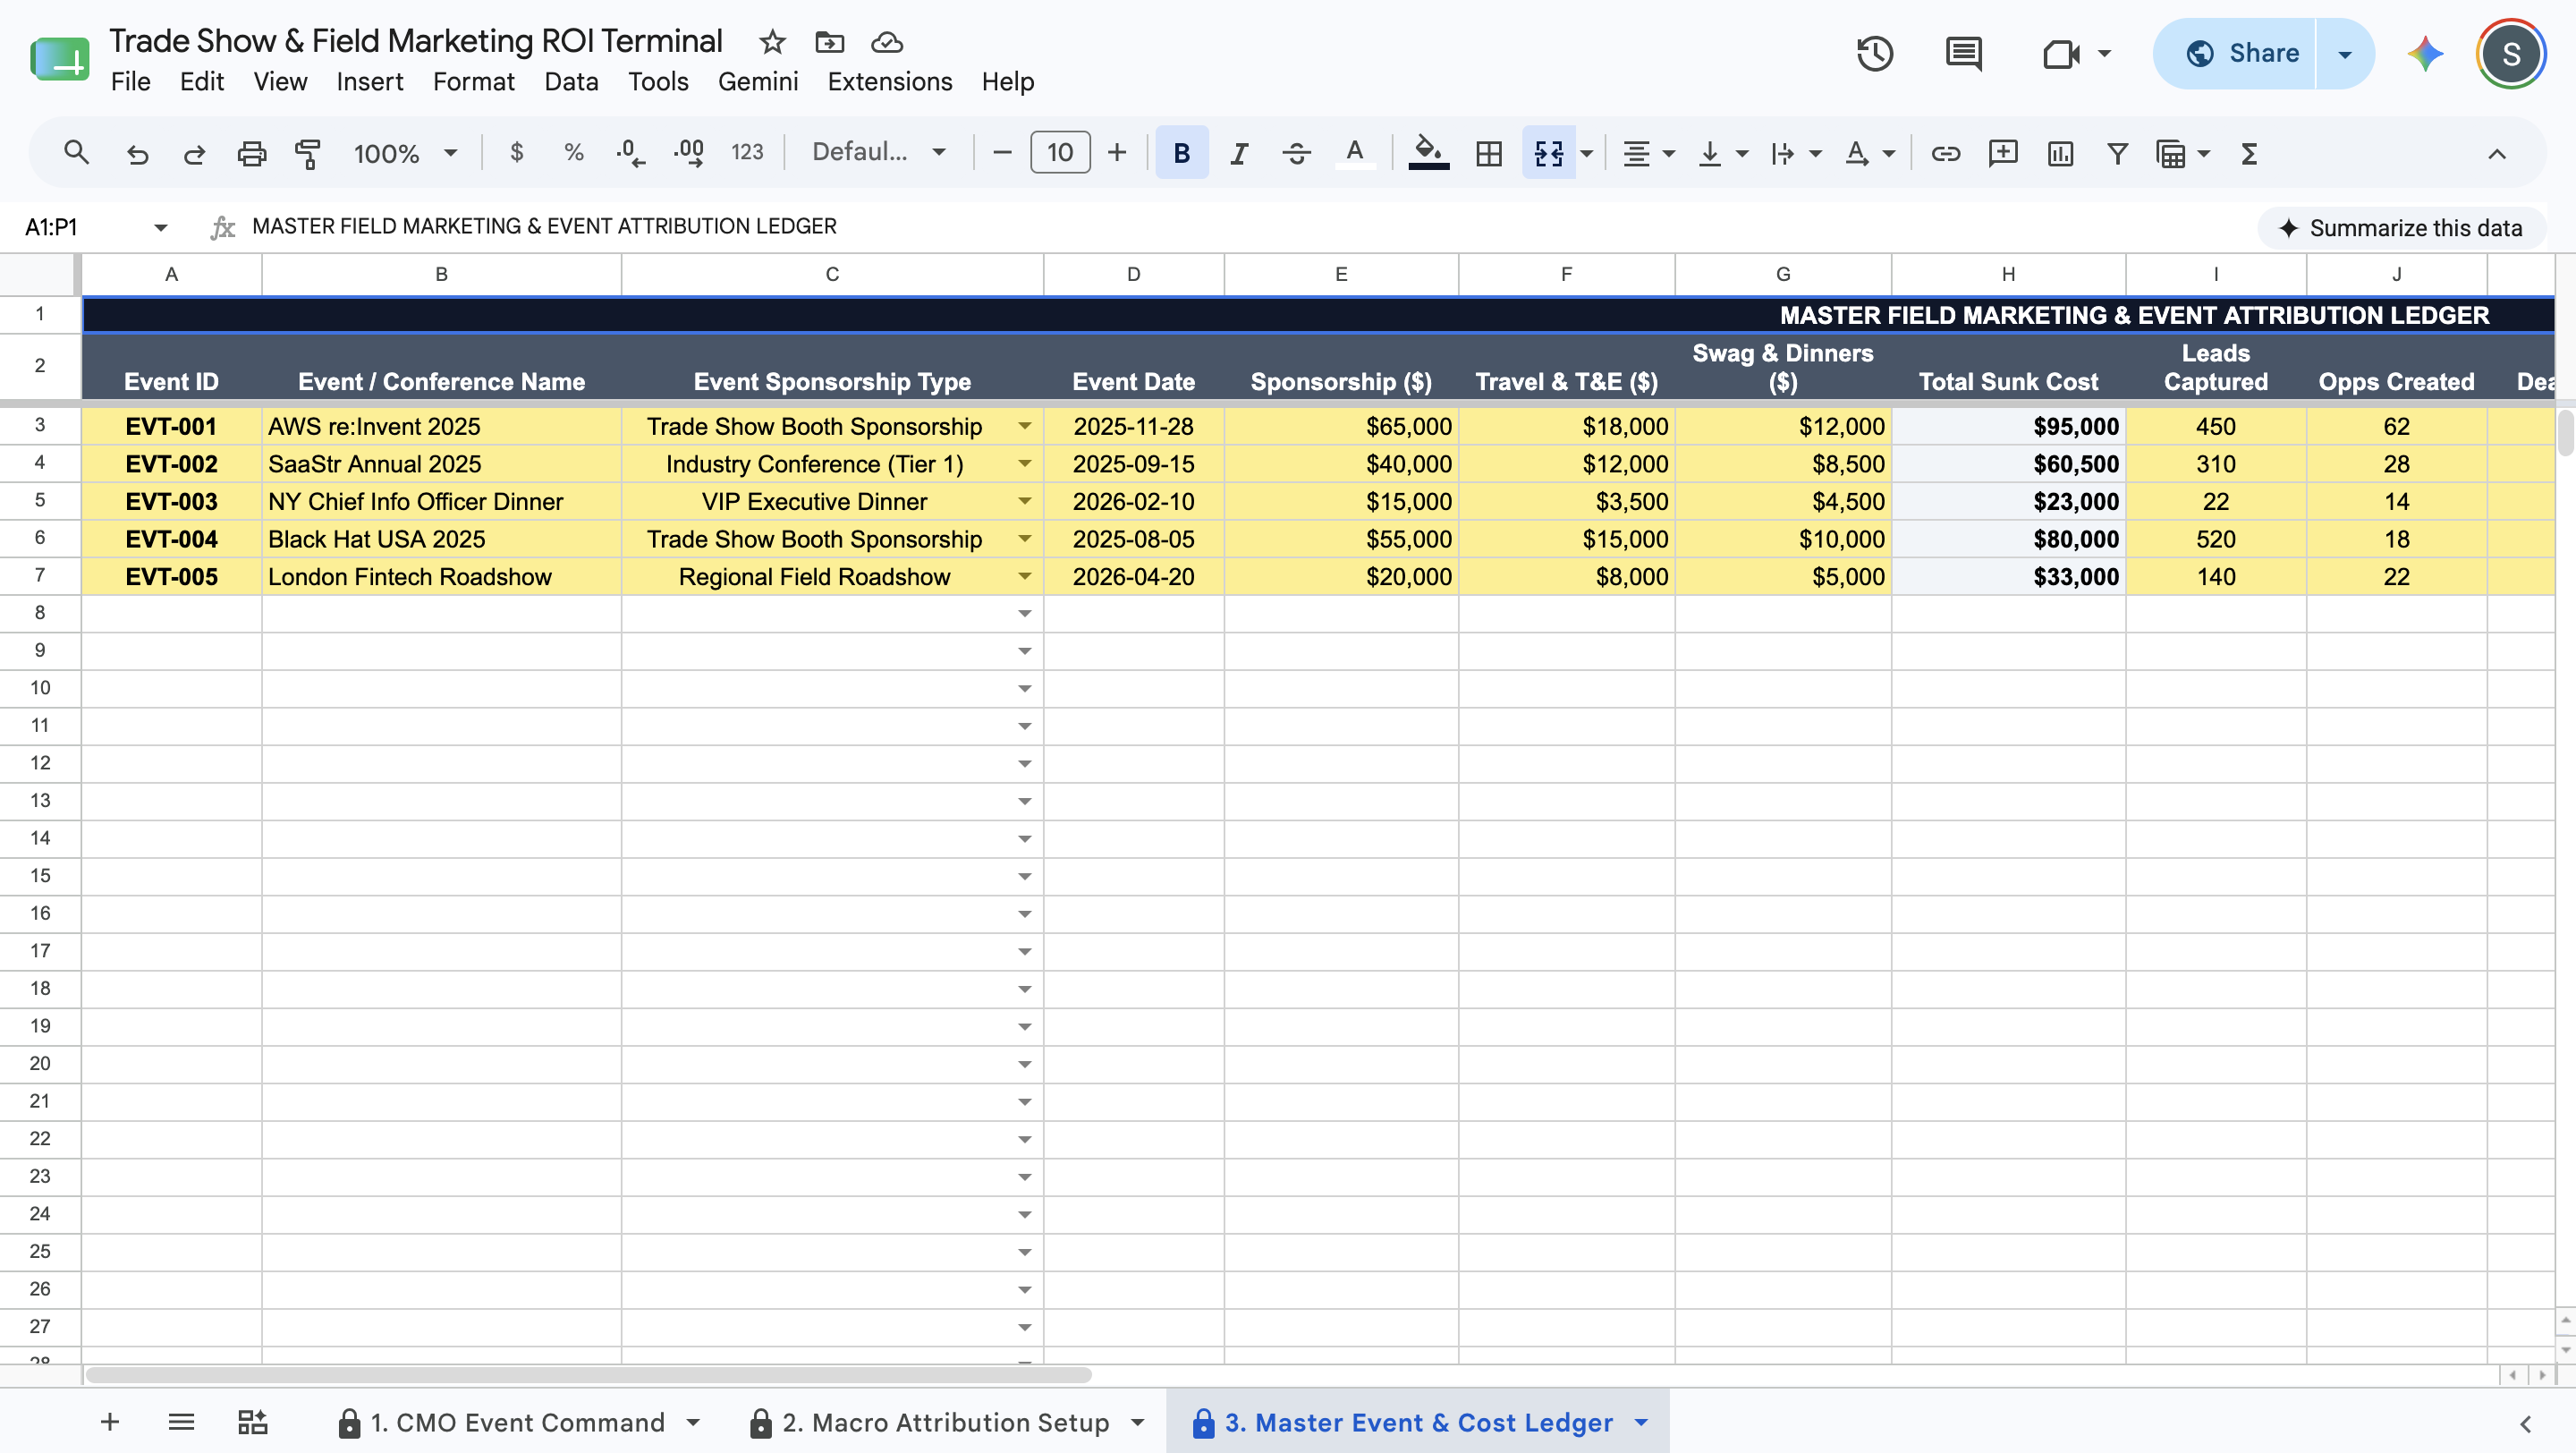
  • Granular Cost & Sunk Expense Ledger: Centralize your field marketing outlays. Track every event by its unique ID, date, and sponsorship classification while parsing costs across core buckets including raw sponsorship fees, travel/T&E, and localized swag or dinner costs.

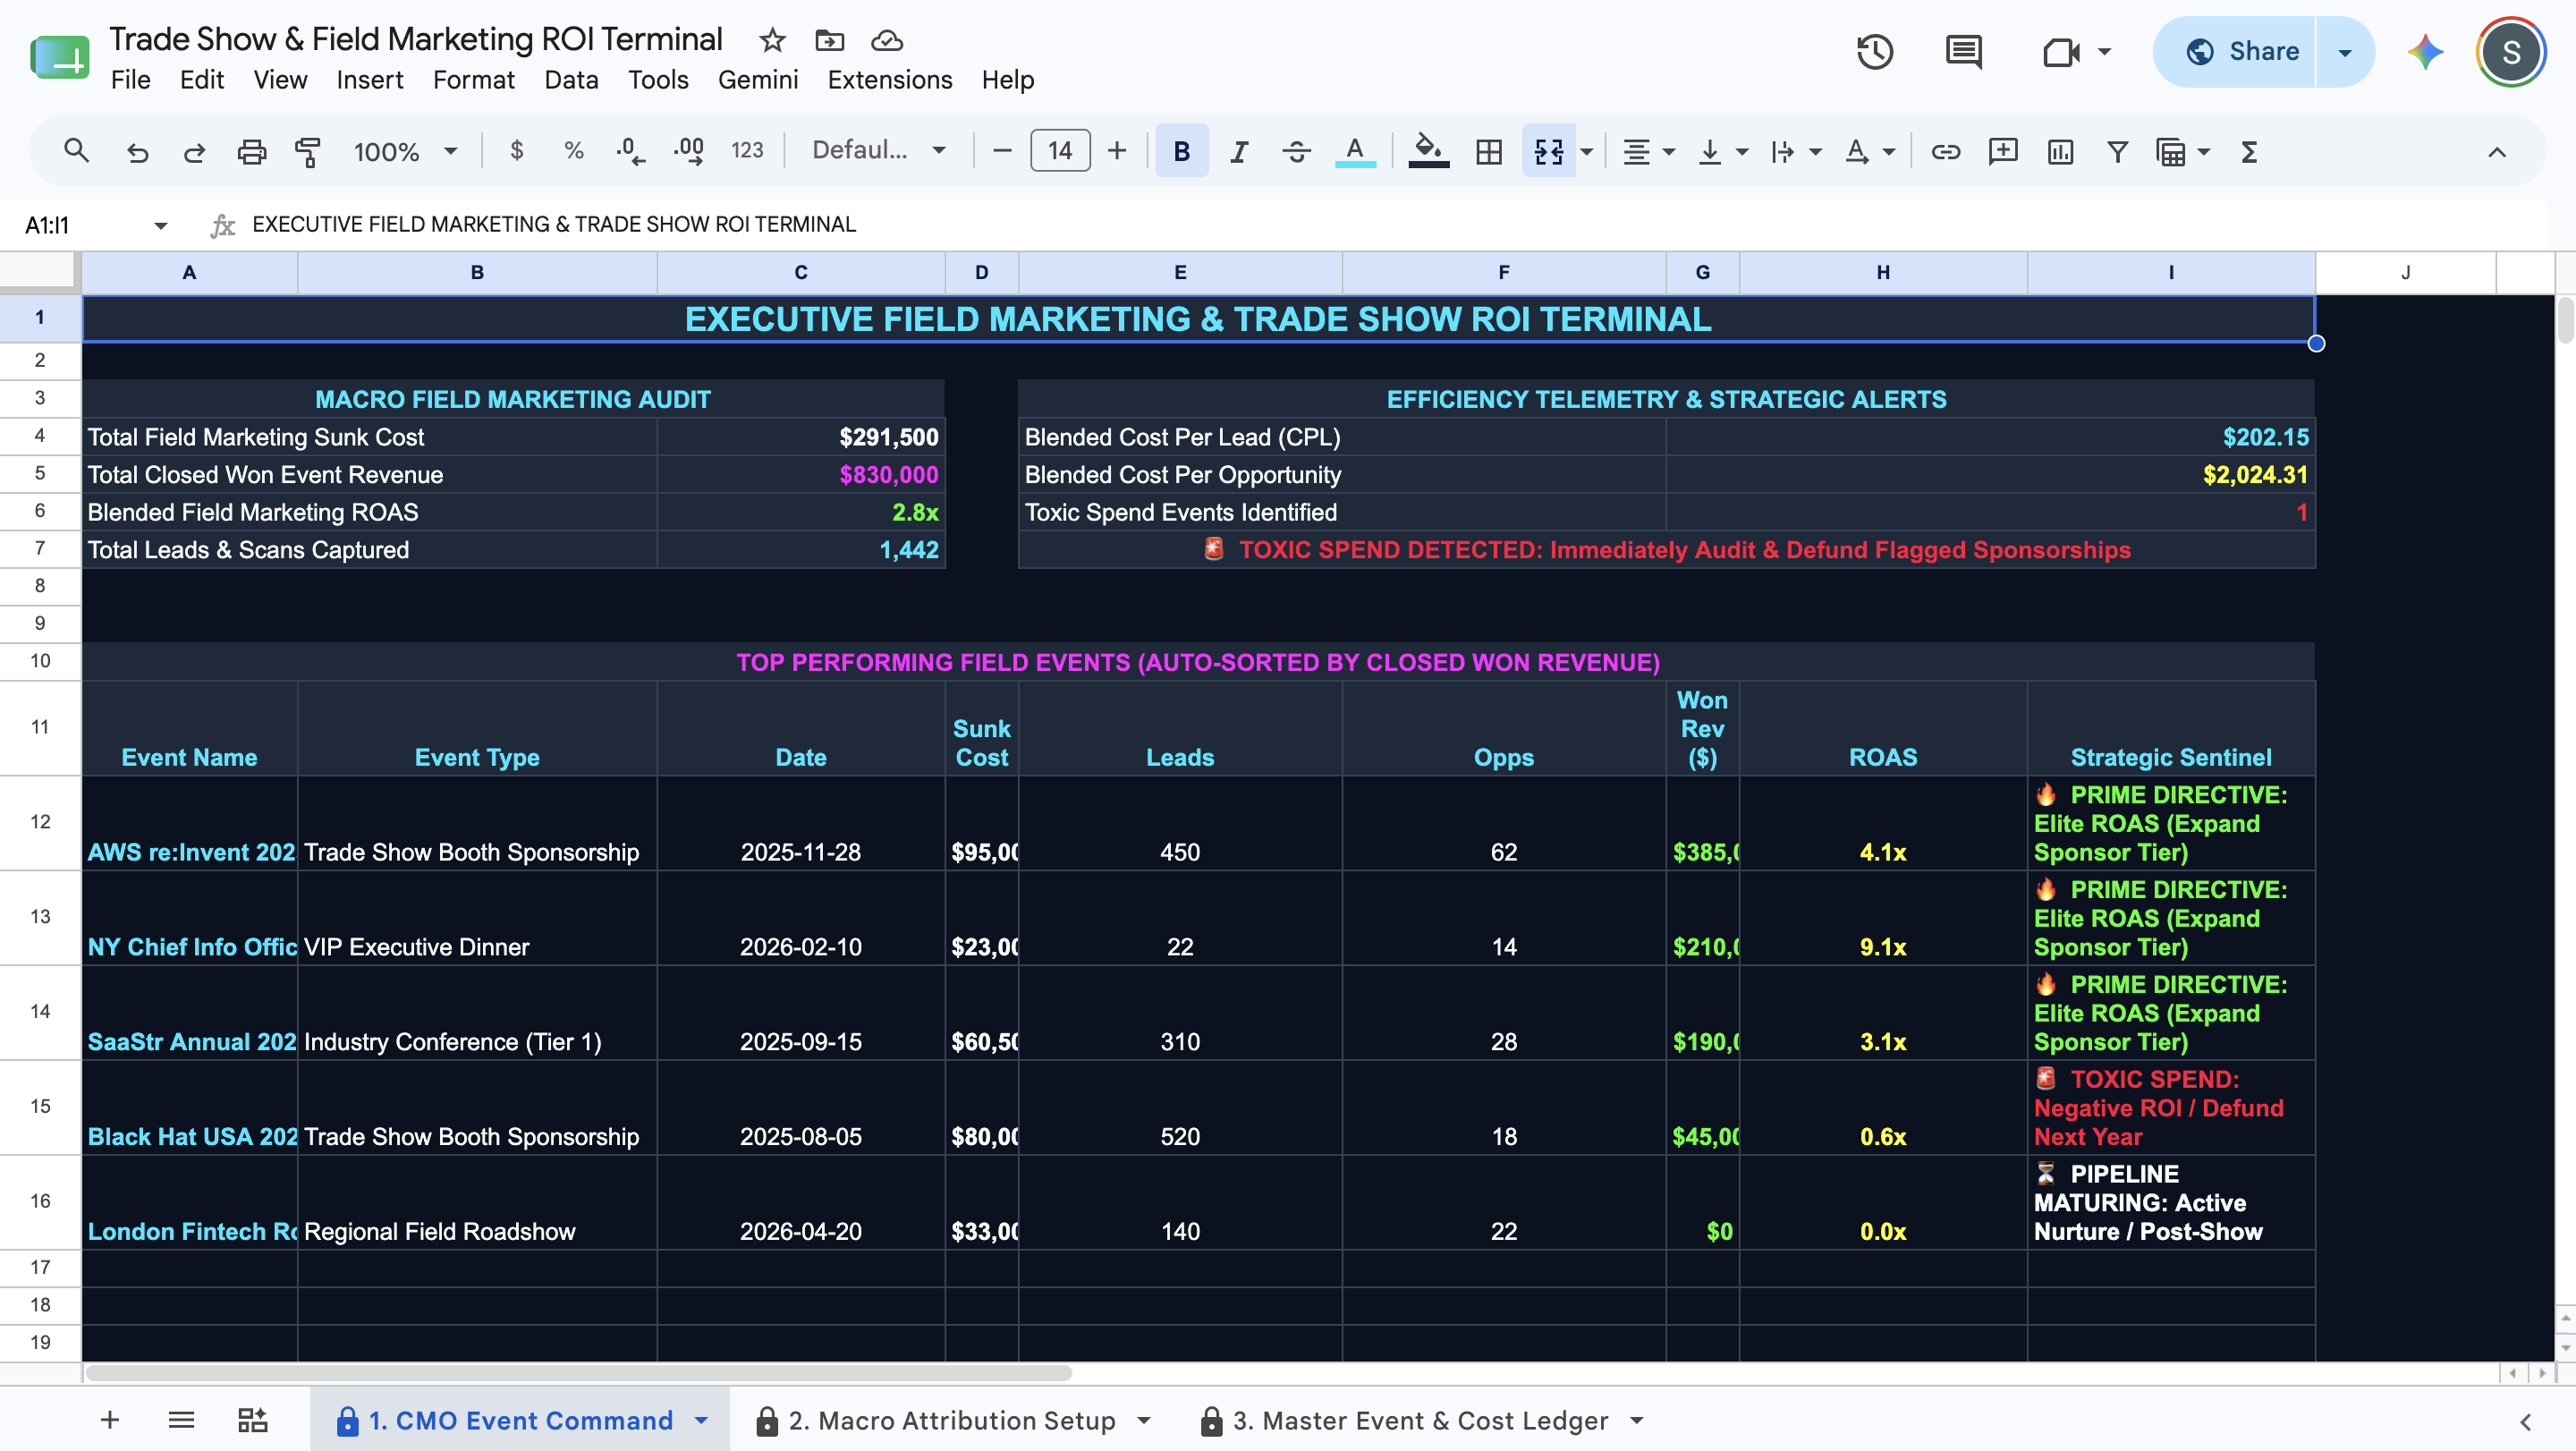
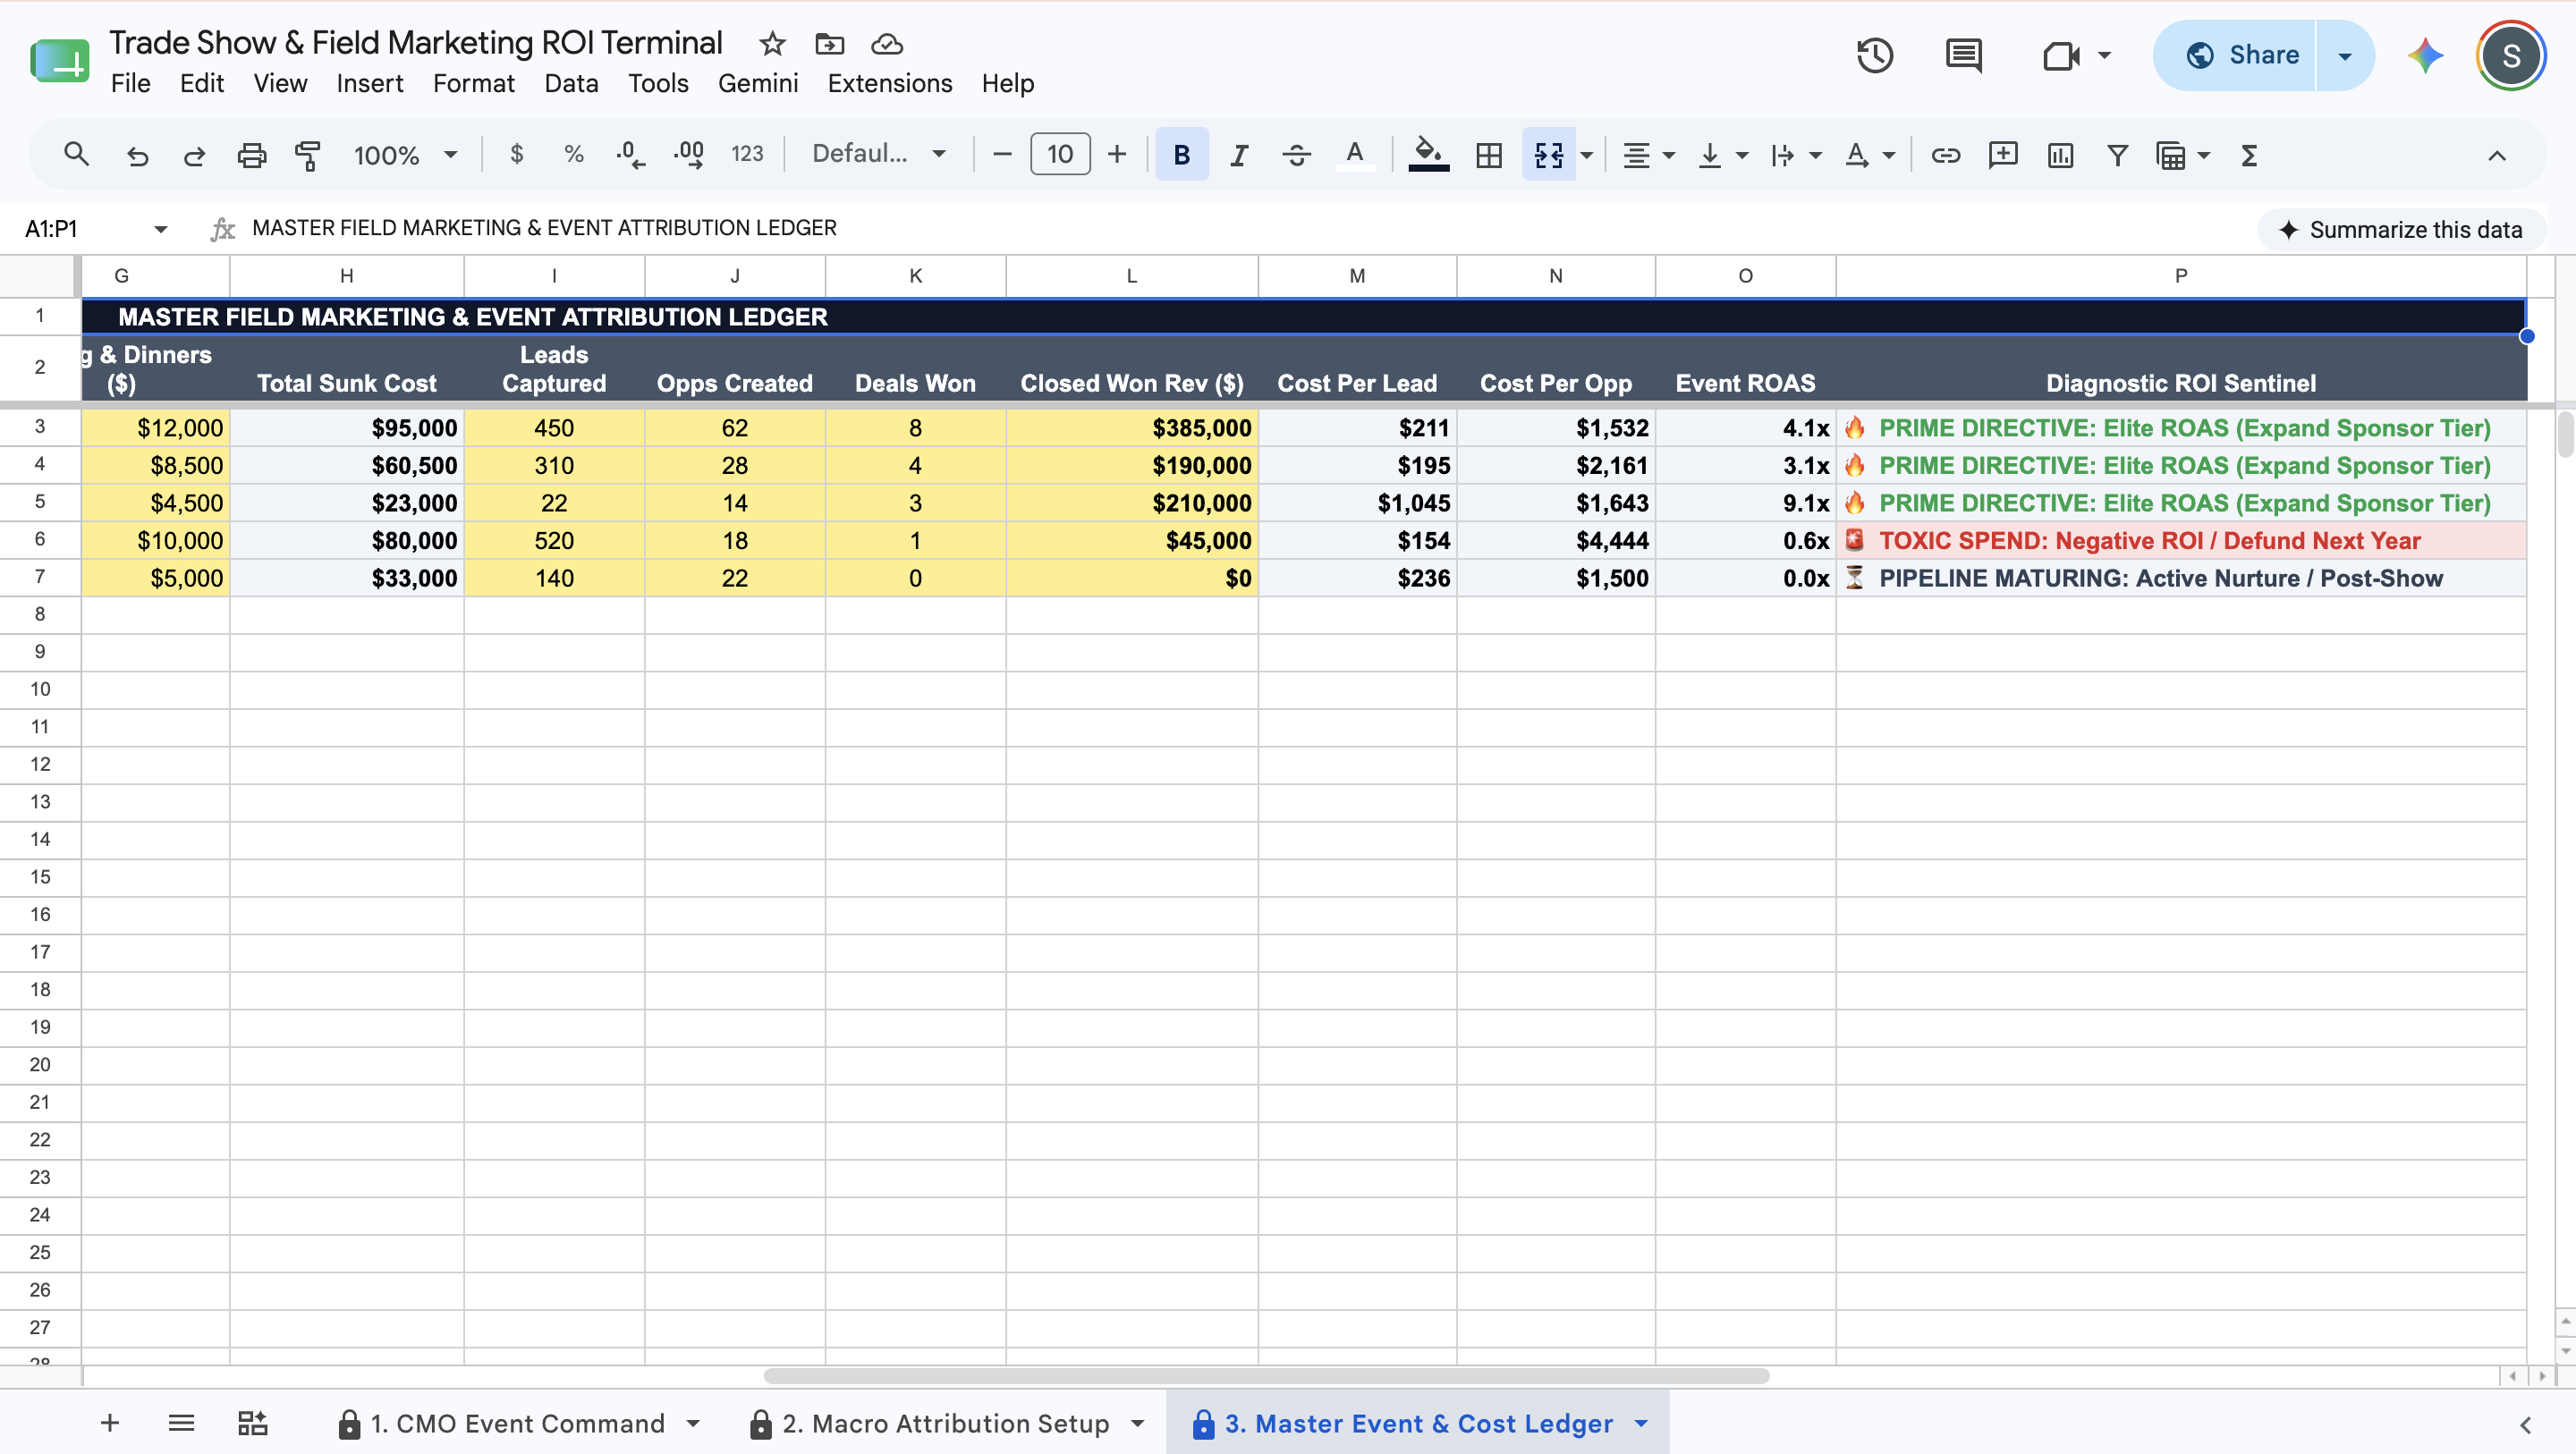
  • The "Trojan Horse" Toxic Spend Interceptor: Protect your discretionary budget. The system continuously evaluates your total event outlays against realized closed-won metrics. If an event clears your high-dollar cost floor but returns a negative ROI, the engine immediately flags it: 🚨 TOXIC SPEND: Negative ROI / Defund Next Year.

  • The Ghost Booth Vanity Detector: Separate real buyers from swag hunters. If an event generates massive lead traffic (>100 badge scans) but fails to convert a baseline percentage into actual Sales Qualified Opportunities (SQOs), the system triggers an alert: ⚠️ GHOST BOOTH: High Traffic / Zero Sales Conversion.

  • Dynamic Sorted Revenue Matrix: Maintain immediate portfolio visibility. The dashboard bypasses traditional manual sorting by leveraging an automated background query array that dynamically filters, aggregates, and ranks your top field events by Closed Won Revenue from largest to smallest.

  • Sponsorship Efficiency Telemetry: View portfolio-wide blended performance metrics in real time. Instantly track your blended Cost Per Lead (CPL), Cost Per Opportunity (CPO), portfolio-wide Event ROAS, and receive an automated high-level health verdict (🟢 HEALTHY PORTFOLIO vs. 🚨 TOXIC SPEND DETECTED).

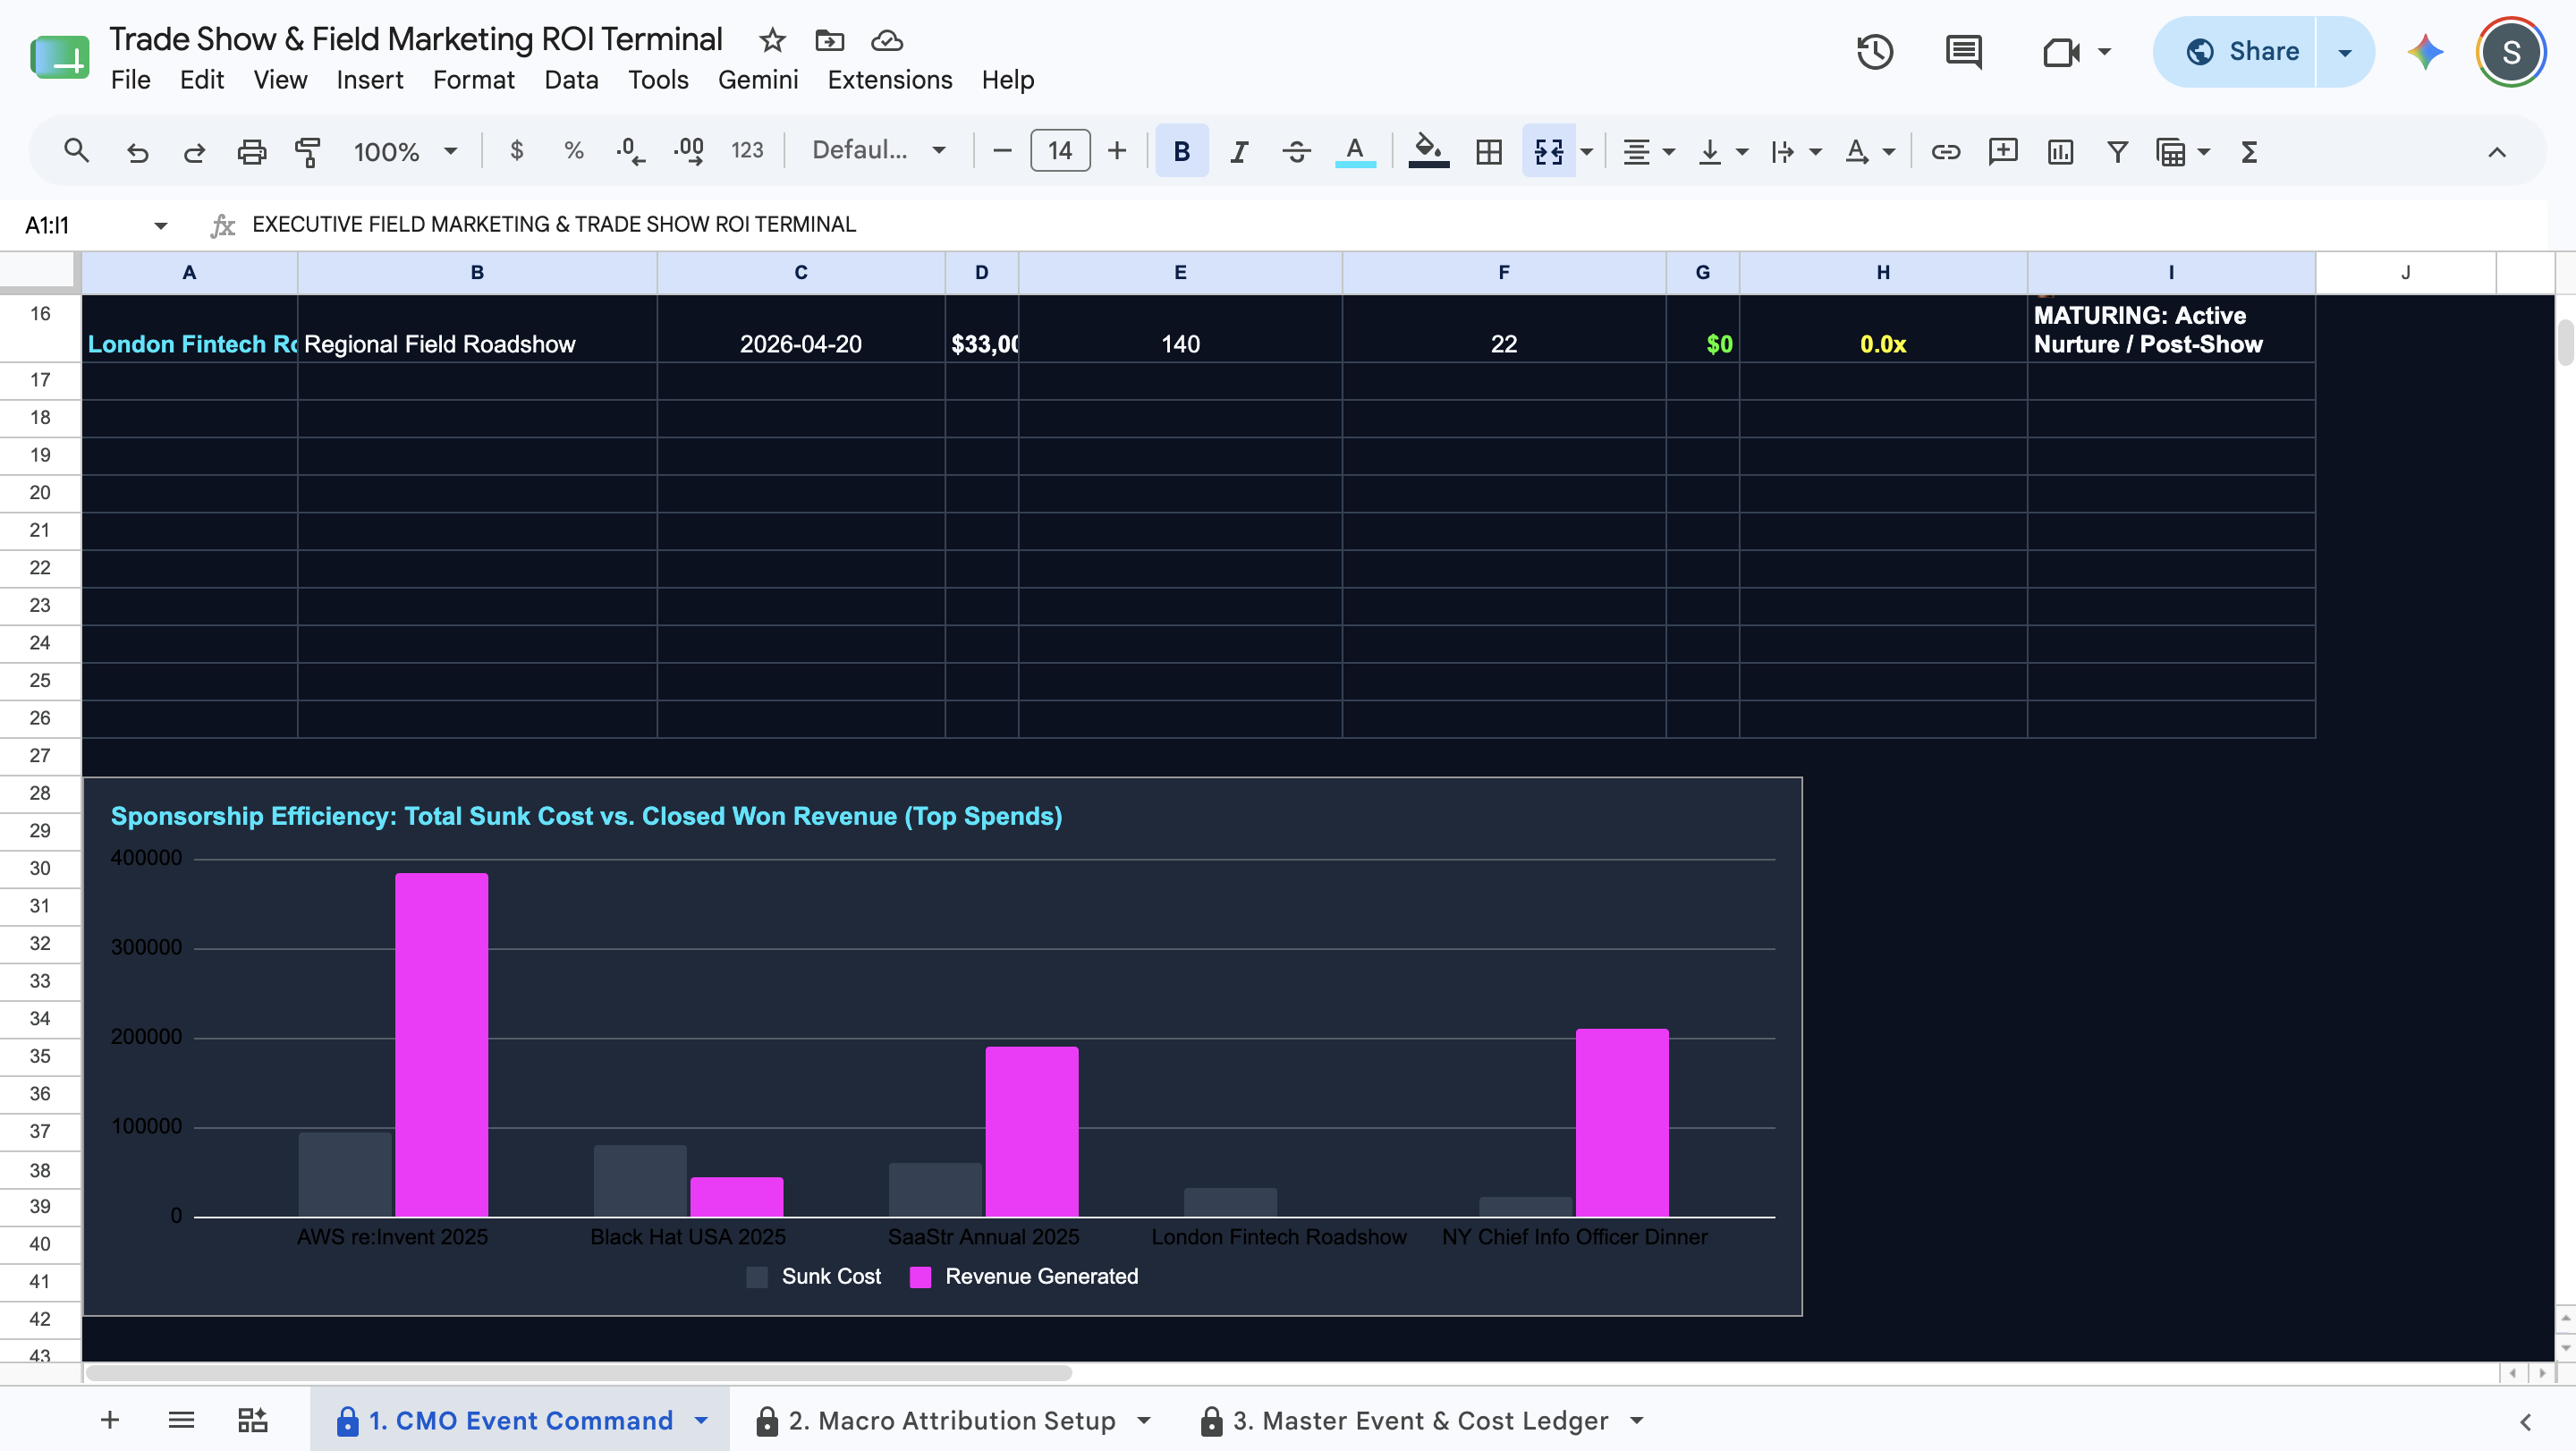
  • Visual Competitive Cost vs. Yield Chart: Drive executive alignment instantly. The integrated dark-mode column chart automatically visualizes your top sponsorships, contrasting Total Sunk Cost directly against Pipeline Revenue Generated for rapid executive analysis.

  • Digitally Shrink-Wrapped Architecture: Engineered strictly as a cloud-native Google Sheet. Only the soft yellow (#FEF08A) input cells are unlocked. Your master database queries, blended portfolio timers, and conditional drop-down validation logic are entirely protected to guarantee zero formula corruption.


Stop guessing your trade show profitability, relying on basic badge scan volumes, or letting toxic event spends drain your annual budget. Establish absolute mathematical control over your field marketing pipeline, identify your highest-yielding customer acquisition channels, and export grid-free PDF marketing summaries directly from your web browser.

This Best Practice includes
1 Google Sheet, 1 User Guide

Acquire business license for $19.00 $1.90

Add to cart

Add to bookmarks

Discuss

Further information

Centralize and track independent field marketing costs across sponsorship fees, travel, swag, and corporate dinners.

Automatically aggregate and tie top-of-funnel booth lead captures directly back to down-funnel Closed Won Revenue data.

Compute live performance markers including Cost Per Lead (CPL), Cost Per Opportunity (CPO), and individual Event ROAS.

Defund low-yield sponsorships by triggering high-visibility "Toxic Spend" sentinels on high-cost, negative-ROI events.

Expose event vanity metrics by automatically flagging high-traffic booths that fail to convert leads into sales pipeline.

Export a clean, grid-free PDF field marketing memorandum to align CMOs, finance directors, and growth investors.

Chief Marketing Officers (CMOs), Field Marketing Leads, and Demand Generation directors managing large discretionary event budgets.

RevOps and Marketing Operations professionals who need a clean, structured repository to attribute pipeline revenue back to specific offline spend.

Bootstrapped B2B tech startups and enterprise agencies looking to ruthlessly optimize their event portfolio without ongoing SaaS overhead.

Consumer-facing B2C ecommerce storefronts or local micro-agencies that rely strictly on digital ad platforms (Meta, Google Ads) for customer acquisition.

Large enterprise teams requiring real-time, bidirectional hardware API integration with electronic physical badge scanners at the booth entrance.

Users seeking a standard Microsoft Excel (.xlsx) file workbook (This asset is built natively and exclusively for Google Sheets to optimize its multi-column dashboard filtering and background query sorting).


0.0 / 5 (0 votes)

please wait...