
Originally published: 18/08/2023 19:30
Publication number: ELQ-34686-1
View all versions & Certificate
Publication number: ELQ-34686-1
View all versions & Certificate

Olive Orchard Business - DCF 10 Year Financial Model
The Olive Orchard Financial Model is a comprehensive tool tailored to analyze the financial aspects of an olive farming venture.
olive oiloliveolive orchardolive oil businessdcfbudgetfinancial modelorchardthree statementsvaluation
Description
The Olive Orchard Financial Model is a comprehensive tool tailored to analyze the financial aspects of an olive farming venture. It encompasses key components such as orchard establishment costs, ongoing maintenance expenses, olive yield projections, product sales, and financial forecasts. This model offers insights into the financial performance of the orchard, enabling informed decision-making, budgeting, resource allocation, and growth planning.
Key Components:
- Orchard Establishment Costs: The model accounts for expenses related to land acquisition, tree planting, irrigation systems, infrastructure development, and initial orchard setup, vehicles, equipment, and other capex items.
- Ongoing Maintenance Expenses: It includes costs for pruning, fertilization, pest control, labor, equipment maintenance, and other operational overheads required to ensure healthy olive tree growth and high yields.
- Olive Yield Projections: The model estimates olive production volumes based on factors like tree maturity, production volume and pricing per bottle, forming the foundation for revenue projections.
Key Benefits:
- Informed Decision Making: The olive orchard financial model empowers orchard managers to make informed decisions regarding orchard financial management, product pricing, and marketing strategies.
- Budgeting and Resource Allocation: By providing a comprehensive overview of costs and potential revenues, the model assists in budgeting, ensuring efficient allocation of resources for optimal orchard performance.
- Growth Planning: The financial forecasts generated by the model support growth planning by allowing stakeholders to assess the potential returns on investments in orchard expansion, new technology adoption, and product diversification.
- Risk Mitigation: By projecting yields and revenues, the model helps in risk assessment and mitigation strategies, enabling proactive measures against potential yield fluctuations and market uncertainties.
In summary, the olive orchard financial model offers a detailed analysis of the financial performance of an olive farming venture. It facilitates informed decision-making, budgeting, growth planning, and risk mitigation, all of which contribute to the success and profitability of the olive orchard operation.
--------------------------------------------------------------------------------------------------------------------
MODEL GUIDELINES
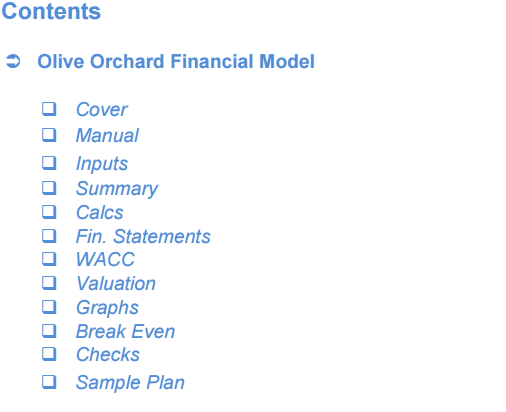
So, a quick overview of the model, in the contents tab you can see the structure of the model and by clicking on any of the headlines to be redirected to the relevant worksheet.
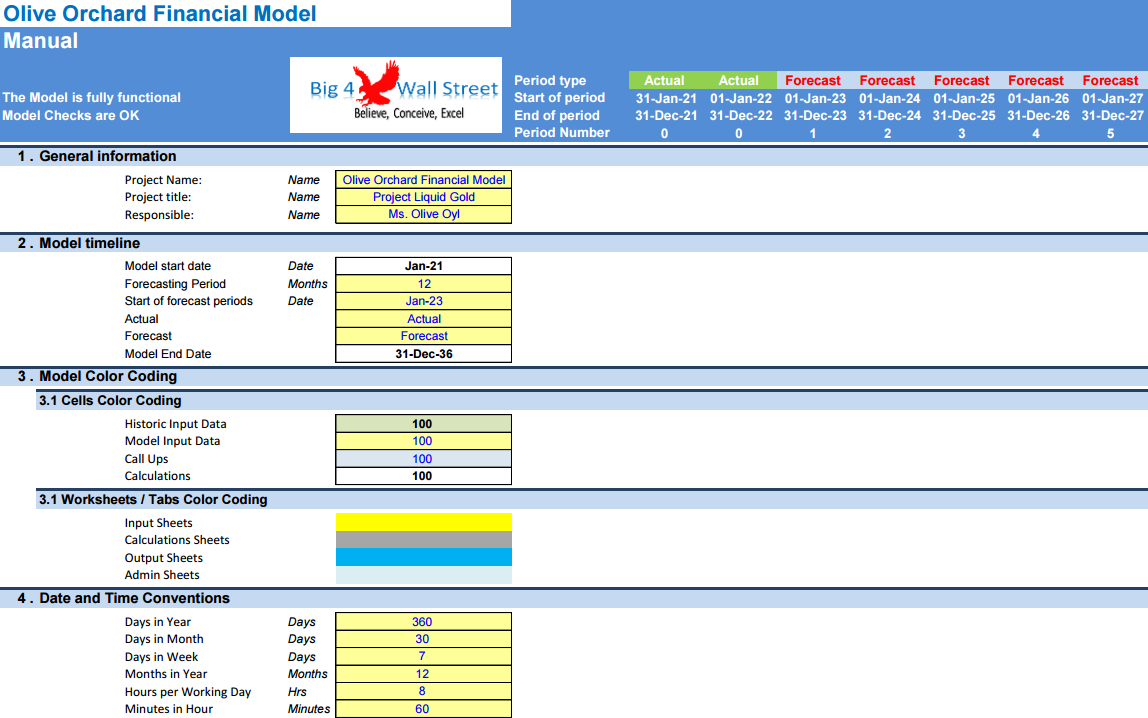
On the manual tab you can feed the general information for the model such as: project name & title, responsible, timeline of the model and date and currency conventions.
Additionally, there is a description of the color coding of the model in the same tab. Inputs are always depicted with a yellow fill and blue letters, call up (that is direct links from other cells) are filled in light blue with blue letters while calculations are depicted with white fill and black characters.
There is also color coding for the various tabs of the model. Yellow tabs are mostly assumptions tabs, grey tabs are calculations tabs, blue tabs are outputs tabs (that is effectively results or graphs) and finally light blue tabs are admin tabs (for example: the cover page, contents, and checks).
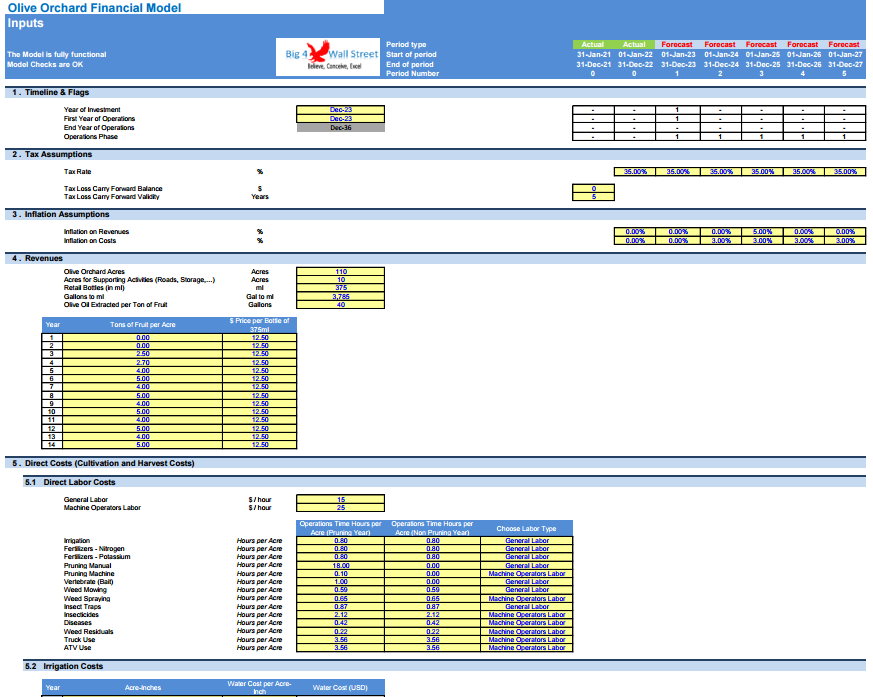
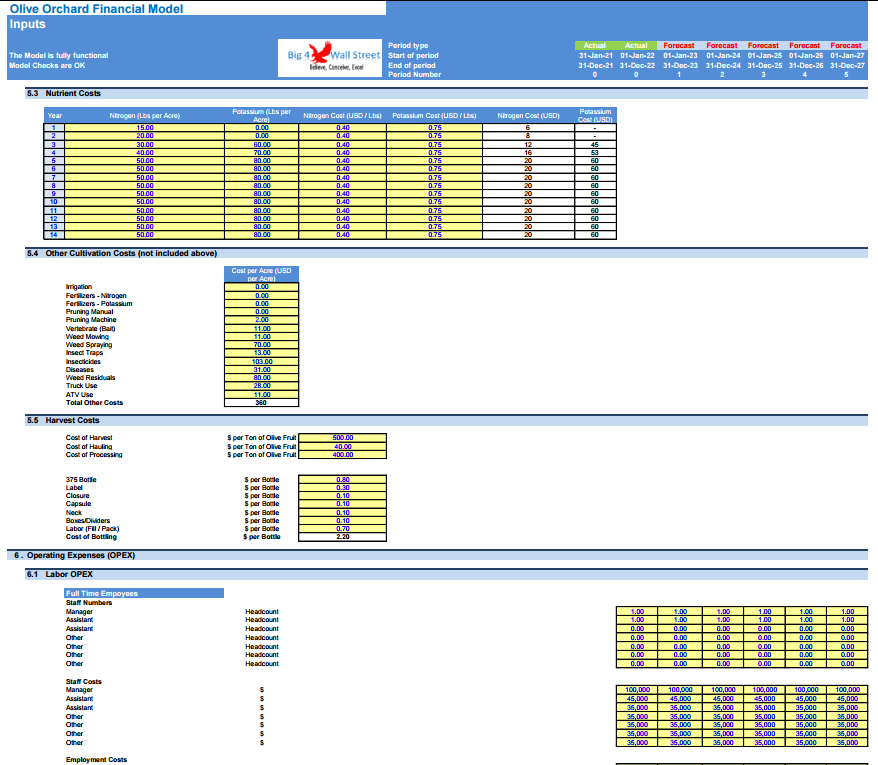
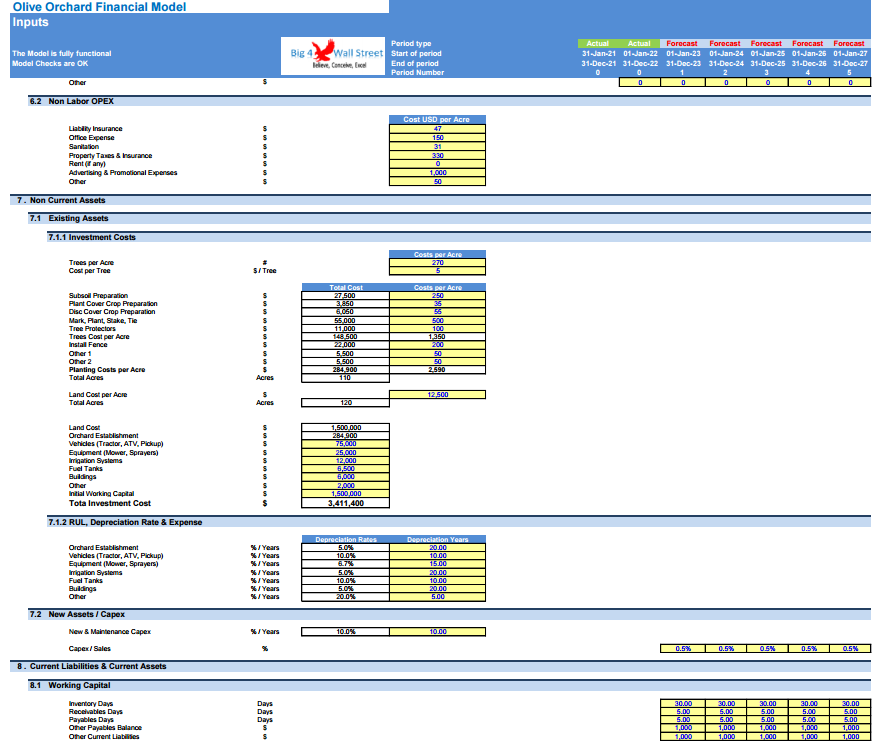
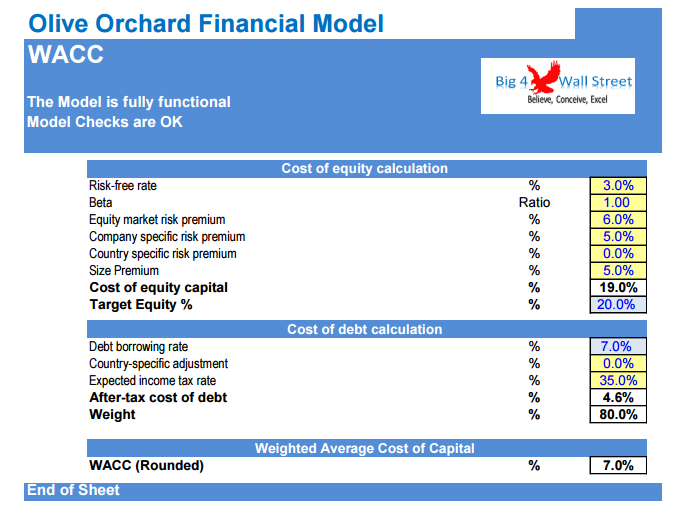
Moving on to the Inputs: detailed inputs for revenues, price of the bottles and olive oil production based on tons of fruit and trees’ maturity, costs splits between direct costs (direct labor costs, cultivation costs, harvest costs) and indirect costs (such as admin staff, outsourced staff, insurance, advertising & promotions as well as other costs), working capital (receivables, payables, and inventory), fixed assets and capex (split into start up investment and new maintenance capex), debt & equity financing as well as valuation assumptions (such as discount rates used in the weighted average cost of capital).
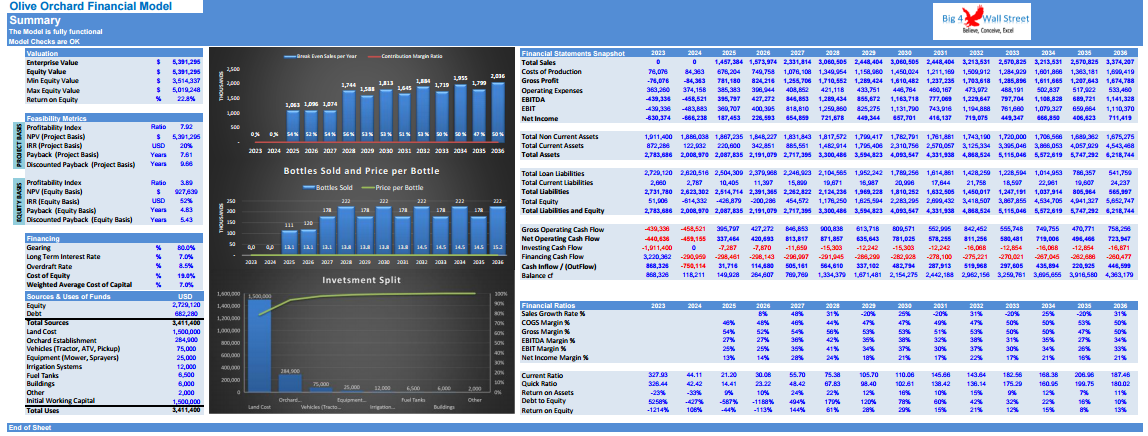
In the summary tab you can see a high-level report with the main metrics and value drivers of the model. It can be readily printed on one page for your convenience.
Calculations: this is where all calculations are performed. The revenues are calculated based on the olive oil production and price per bottle and deducting the operating costs adjusted for inflation the operating profit is resulting. Based on the assets financed and the gearing of the financing the interest and depreciation are occurring. By using the working capital assumptions, the impact of the business cycle is presented. Finally, depending on the level of the investment considered the relevant debt financing is calculated (Long term debt and overdraft).
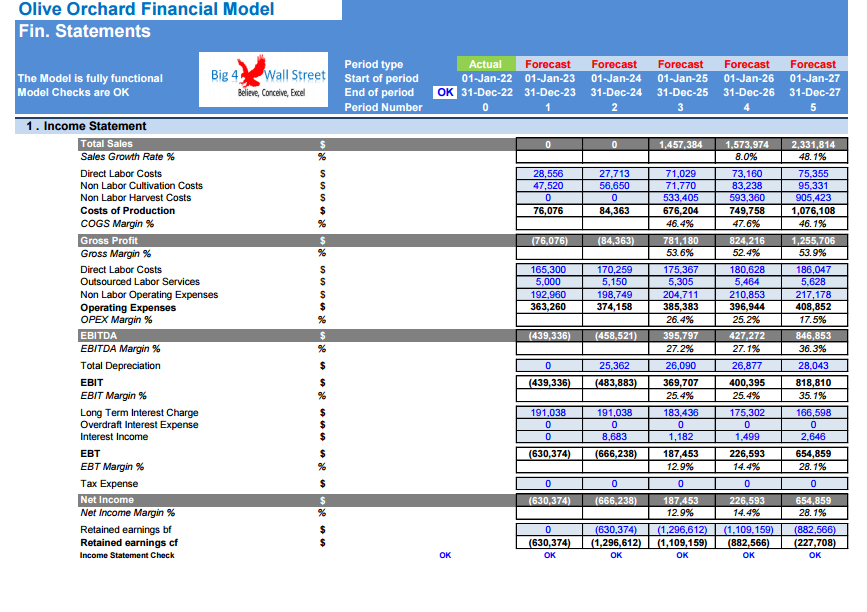
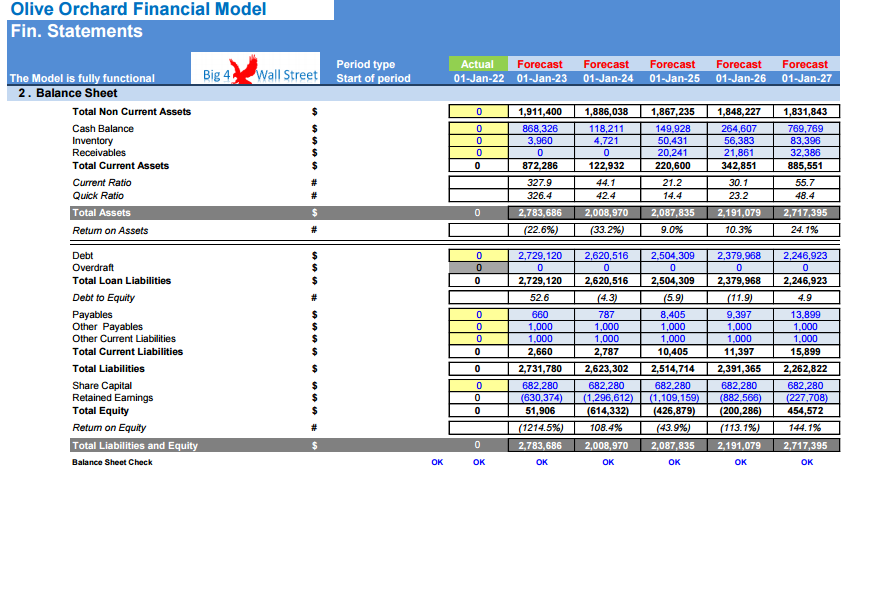
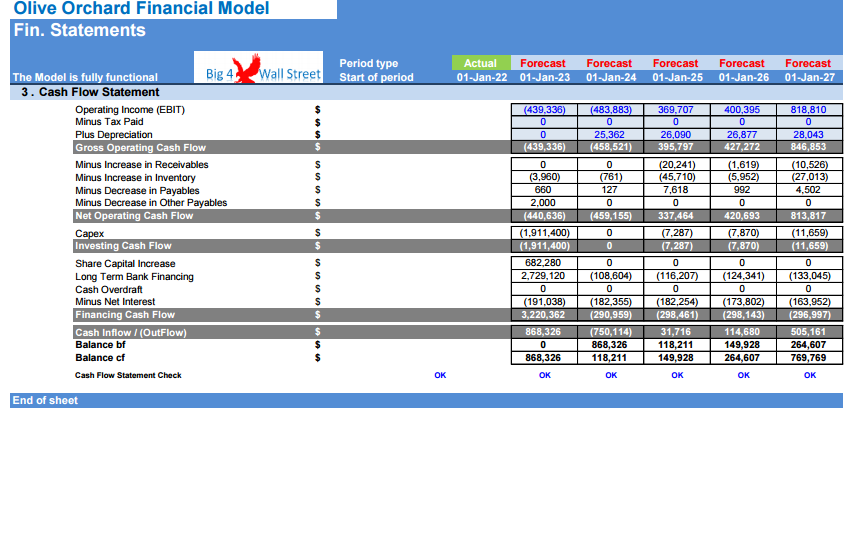
In the Outputs tab: everything is aggregated here into the relevant statements: profit and loss, balance sheet and cash flow.
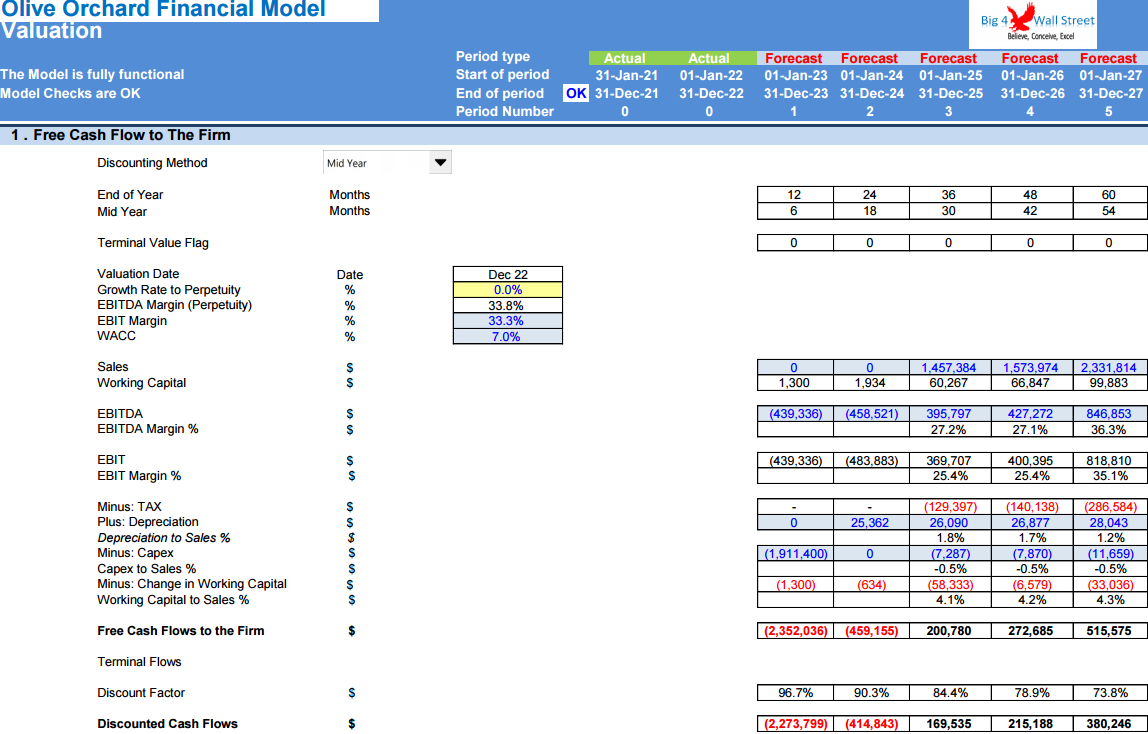
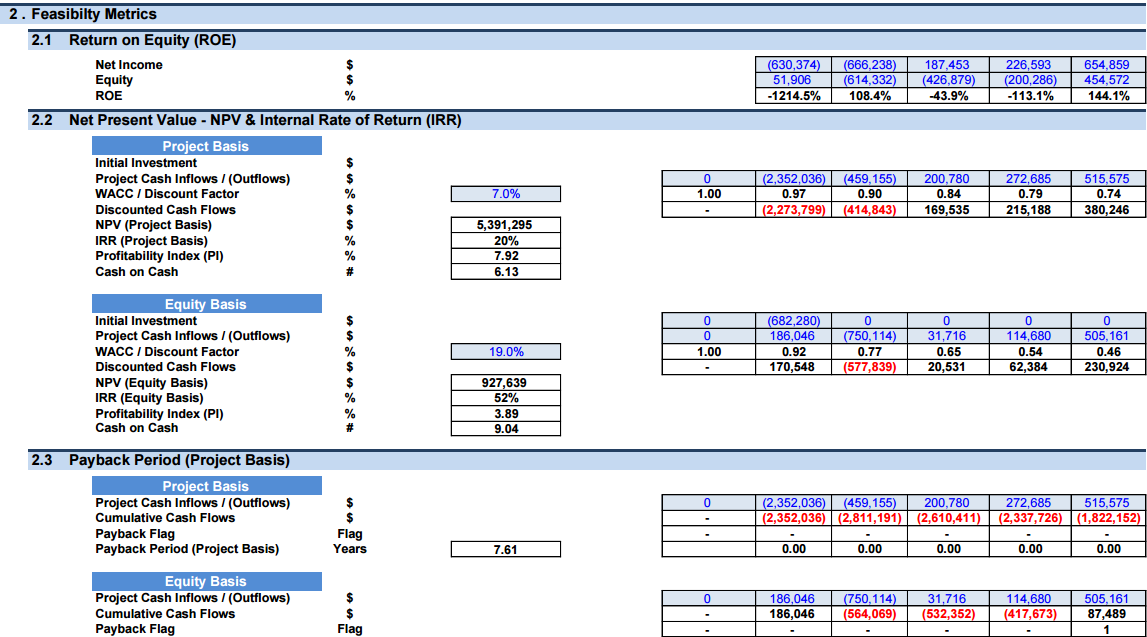
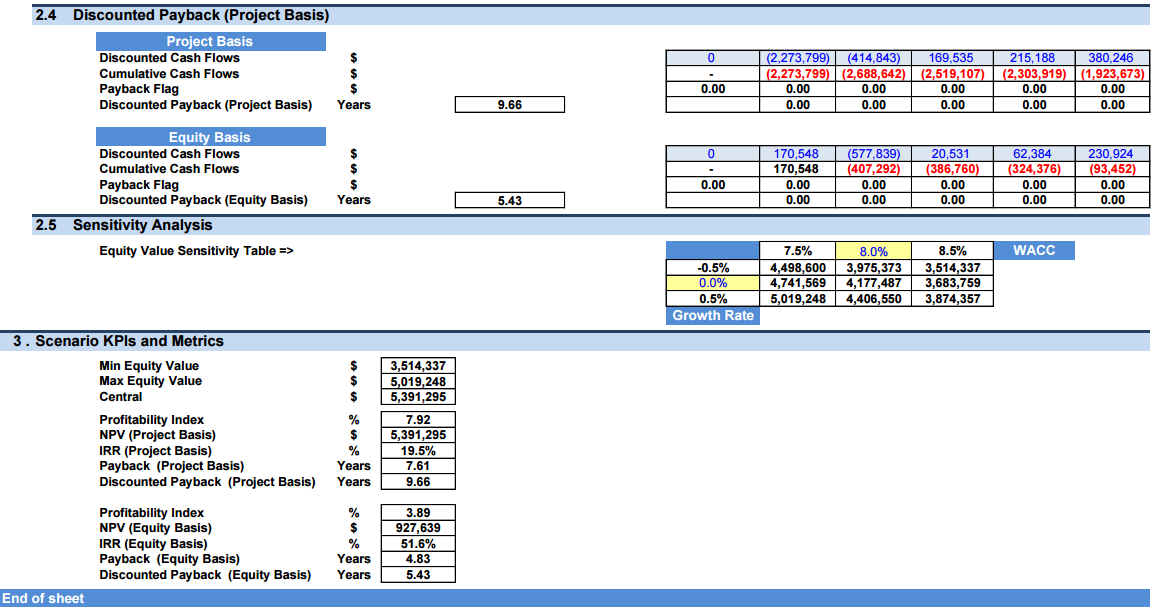
Moving to the Valuation tab, a valuation is performed by using the free cash flows to the firm and then a series of investment metrics are presented (Net Present Value, Internal Rate of Return, Profitability Index, Payback Period, Discounted Payback Period, Sensitivity Analysis).
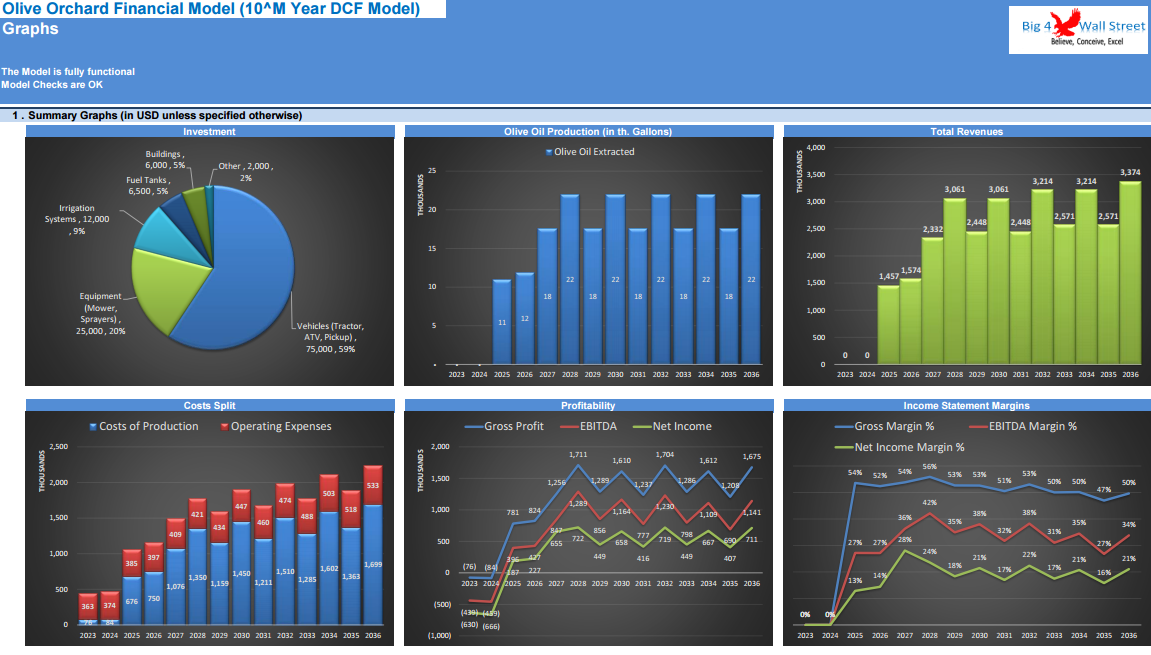
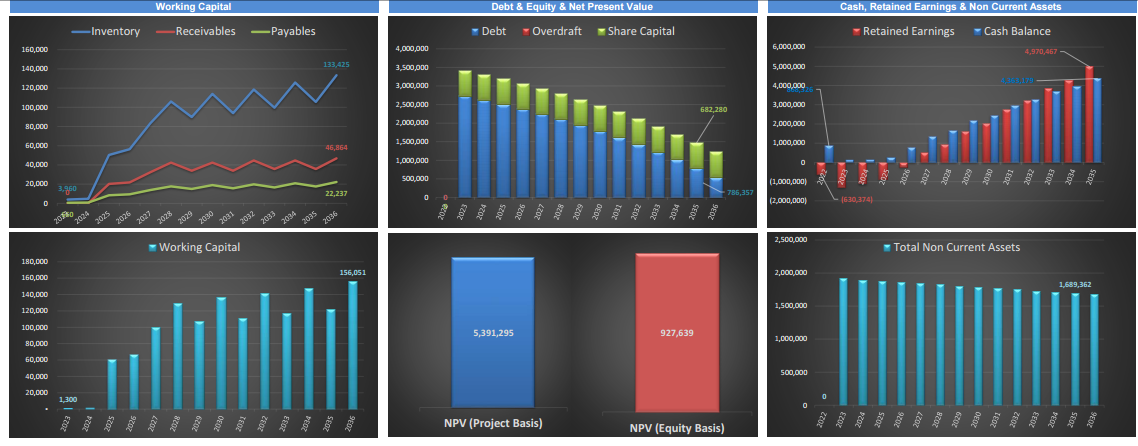
In the Graphs tab: Various graphs present the business metrics, revenues, operating costs, and profitability. Then multiple charts present the working capital, debt & equity along with cash, assets, and cash flows which results in a valuation on a project basis as well as on an equity basis together with the feasibility metrics.
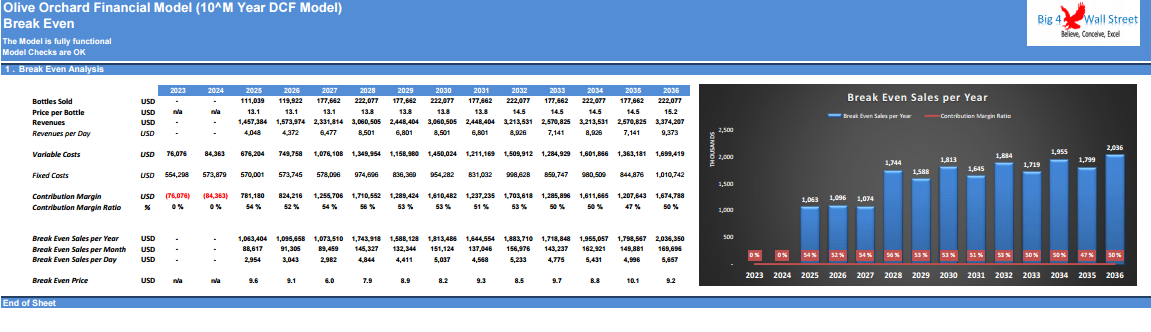
In the Break-Even tab, you can find a break-even analysis and see how many sales you need to break even.
Sample Plan: a sample short business plan wording is also provided which you can use as a base for writing your own business plan.
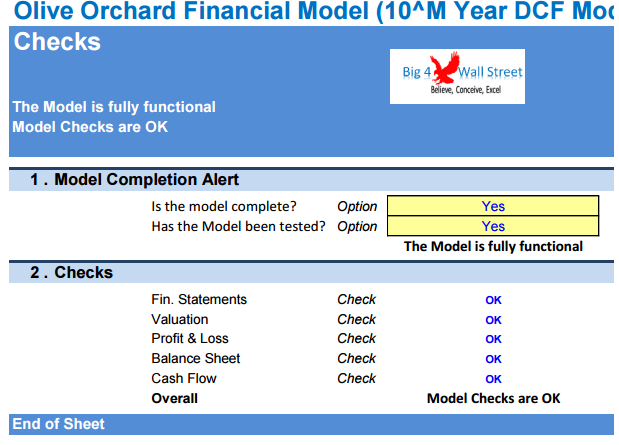
Checks: A dedicated worksheet that makes sure that everything is working as it should!
Important Notice: Yellow indicates inputs and assumptions that the user can change, blue cells are used for called up cells, and white cells with black characters indicates calculation cells.
The Olive Orchard Financial Model is a comprehensive tool tailored to analyze the financial aspects of an olive farming venture. It encompasses key components such as orchard establishment costs, ongoing maintenance expenses, olive yield projections, product sales, and financial forecasts. This model offers insights into the financial performance of the orchard, enabling informed decision-making, budgeting, resource allocation, and growth planning.
Key Components:
- Orchard Establishment Costs: The model accounts for expenses related to land acquisition, tree planting, irrigation systems, infrastructure development, and initial orchard setup, vehicles, equipment, and other capex items.
- Ongoing Maintenance Expenses: It includes costs for pruning, fertilization, pest control, labor, equipment maintenance, and other operational overheads required to ensure healthy olive tree growth and high yields.
- Olive Yield Projections: The model estimates olive production volumes based on factors like tree maturity, production volume and pricing per bottle, forming the foundation for revenue projections.
Key Benefits:
- Informed Decision Making: The olive orchard financial model empowers orchard managers to make informed decisions regarding orchard financial management, product pricing, and marketing strategies.
- Budgeting and Resource Allocation: By providing a comprehensive overview of costs and potential revenues, the model assists in budgeting, ensuring efficient allocation of resources for optimal orchard performance.
- Growth Planning: The financial forecasts generated by the model support growth planning by allowing stakeholders to assess the potential returns on investments in orchard expansion, new technology adoption, and product diversification.
- Risk Mitigation: By projecting yields and revenues, the model helps in risk assessment and mitigation strategies, enabling proactive measures against potential yield fluctuations and market uncertainties.
In summary, the olive orchard financial model offers a detailed analysis of the financial performance of an olive farming venture. It facilitates informed decision-making, budgeting, growth planning, and risk mitigation, all of which contribute to the success and profitability of the olive orchard operation.
--------------------------------------------------------------------------------------------------------------------
MODEL GUIDELINES
So, a quick overview of the model, in the contents tab you can see the structure of the model and by clicking on any of the headlines to be redirected to the relevant worksheet.
On the manual tab you can feed the general information for the model such as: project name & title, responsible, timeline of the model and date and currency conventions.
Additionally, there is a description of the color coding of the model in the same tab. Inputs are always depicted with a yellow fill and blue letters, call up (that is direct links from other cells) are filled in light blue with blue letters while calculations are depicted with white fill and black characters.
There is also color coding for the various tabs of the model. Yellow tabs are mostly assumptions tabs, grey tabs are calculations tabs, blue tabs are outputs tabs (that is effectively results or graphs) and finally light blue tabs are admin tabs (for example: the cover page, contents, and checks).
Moving on to the Inputs: detailed inputs for revenues, price of the bottles and olive oil production based on tons of fruit and trees’ maturity, costs splits between direct costs (direct labor costs, cultivation costs, harvest costs) and indirect costs (such as admin staff, outsourced staff, insurance, advertising & promotions as well as other costs), working capital (receivables, payables, and inventory), fixed assets and capex (split into start up investment and new maintenance capex), debt & equity financing as well as valuation assumptions (such as discount rates used in the weighted average cost of capital).
In the summary tab you can see a high-level report with the main metrics and value drivers of the model. It can be readily printed on one page for your convenience.
Calculations: this is where all calculations are performed. The revenues are calculated based on the olive oil production and price per bottle and deducting the operating costs adjusted for inflation the operating profit is resulting. Based on the assets financed and the gearing of the financing the interest and depreciation are occurring. By using the working capital assumptions, the impact of the business cycle is presented. Finally, depending on the level of the investment considered the relevant debt financing is calculated (Long term debt and overdraft).
In the Outputs tab: everything is aggregated here into the relevant statements: profit and loss, balance sheet and cash flow.
Moving to the Valuation tab, a valuation is performed by using the free cash flows to the firm and then a series of investment metrics are presented (Net Present Value, Internal Rate of Return, Profitability Index, Payback Period, Discounted Payback Period, Sensitivity Analysis).
In the Graphs tab: Various graphs present the business metrics, revenues, operating costs, and profitability. Then multiple charts present the working capital, debt & equity along with cash, assets, and cash flows which results in a valuation on a project basis as well as on an equity basis together with the feasibility metrics.
In the Break-Even tab, you can find a break-even analysis and see how many sales you need to break even.
Sample Plan: a sample short business plan wording is also provided which you can use as a base for writing your own business plan.
Checks: A dedicated worksheet that makes sure that everything is working as it should!
Important Notice: Yellow indicates inputs and assumptions that the user can change, blue cells are used for called up cells, and white cells with black characters indicates calculation cells.
This Best Practice includes
1 Excel
