


Originally published: 08/06/2023 07:56
Publication number: ELQ-39085-1
View all versions & Certificate
Publication number: ELQ-39085-1
View all versions & Certificate

Serviced Apartments Excel Financial Model
The model will update the calculation based on your entered data.
Our mission is to be the industrial leader and pioneer in our business domainFollow 17
Description
The rise of multinational businesses has led to an increase in global business travel and the need for long-term accommodation. Travelers now seek accommodations that offer ample space, a pleasant environment, convenience, and additional amenities. This trend presents a promising opportunity for startups or businesses in the early stages of establishing serviced apartments. Our Serviced Apartments Financial Model Excel template serves as an excellent tool to assist you in comprehending the financial aspects of your serviced apartment business, attracting investments, and effectively utilizing funds to generate profits.
The profitability of the serviced apartments industry is expected to grow in the future due to the escalating demand, fueled by the projected rise in global business travel spending. With the increasing popularity of serviced apartments, more individuals are entering the market, resulting in intense competition. To succeed in this competitive landscape, new serviced apartment startups must embrace innovation, such as designing unique facilities and engaging activities for their guests. Developed by an Oak Business Consultant, our serviced apartments financial model Excel template is designed to help you analyze your competition and stay abreast of market trends.
The Serviced Apartments Financial Model Excel Template contains the following Sheets.
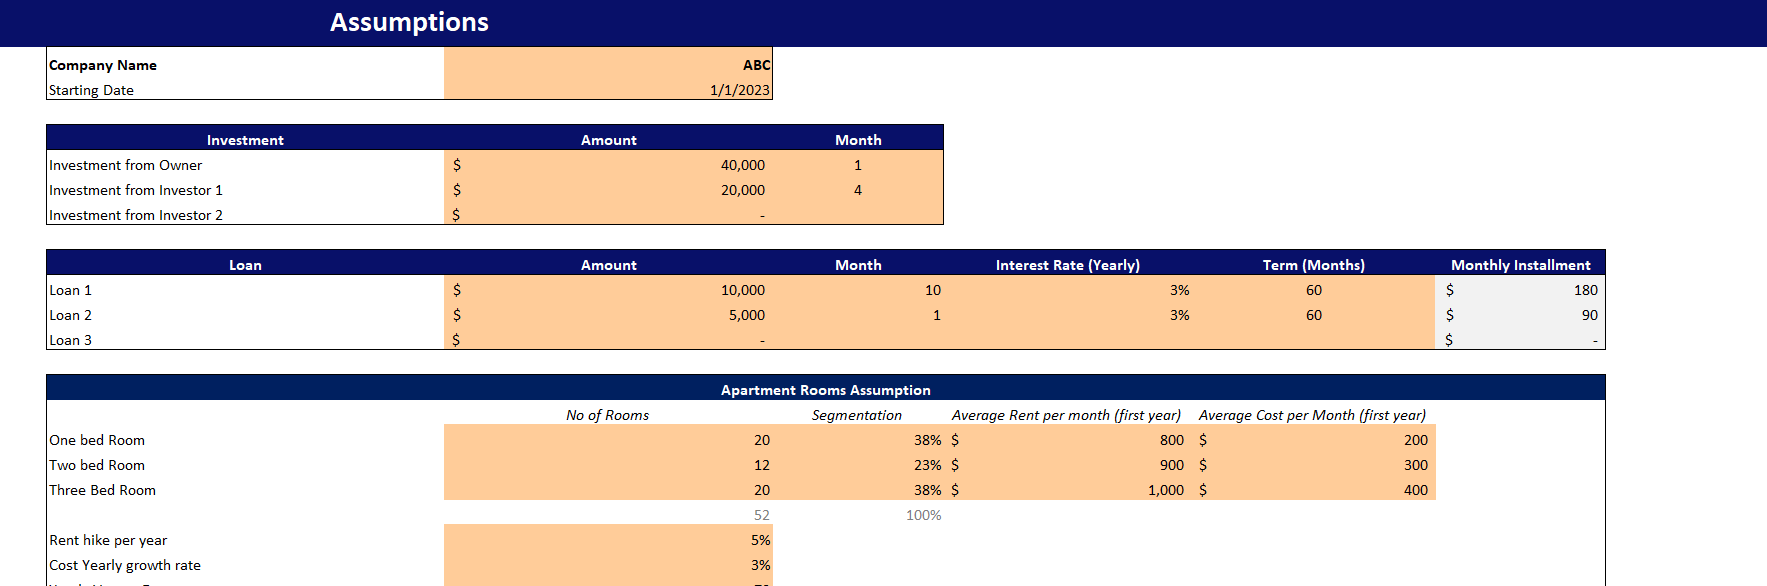
Assumptions
The Assumption contains Serviced Apartment’s investments, loans, revenue, and cost assumptions. You have to enter the data in peach-filled columns to get accurate results for your company.
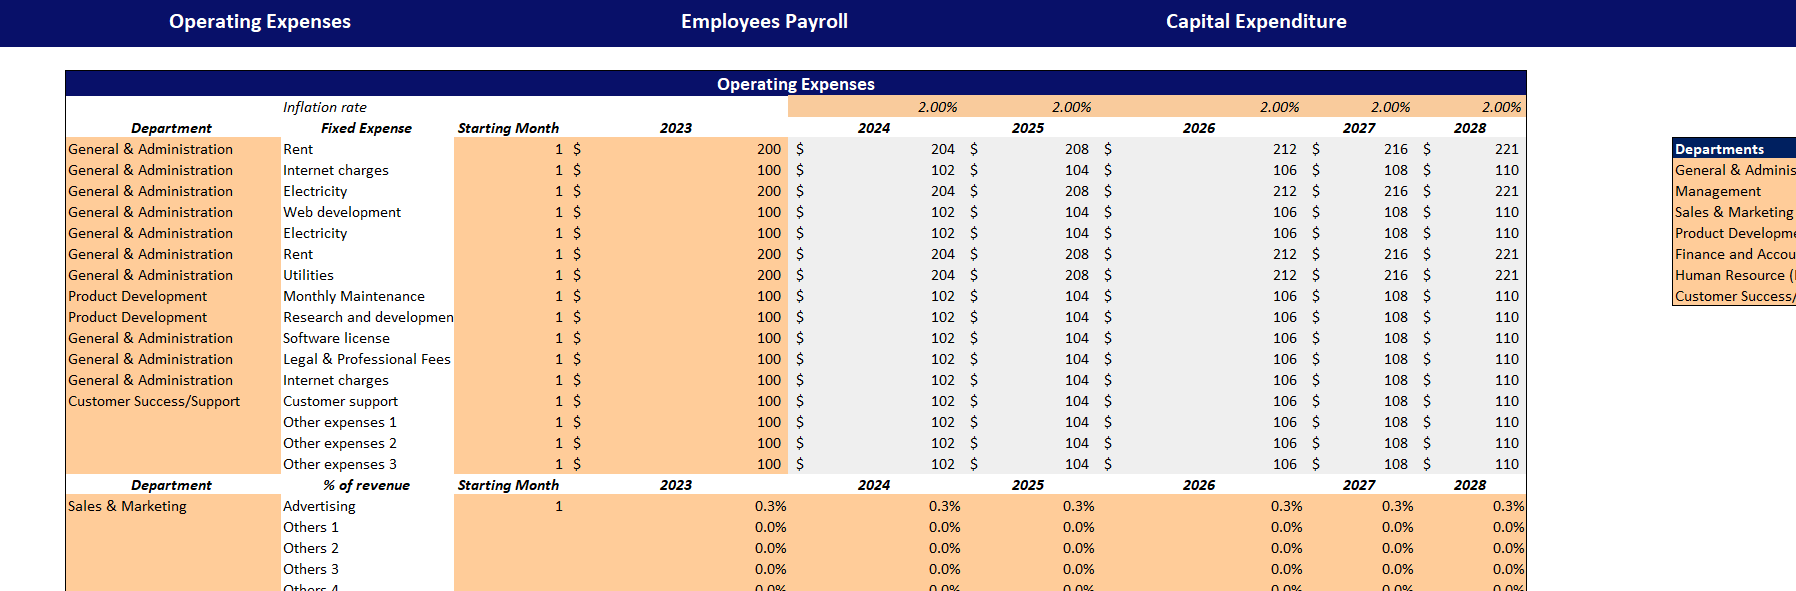
Expenses-Input
The expenses-Input contains the assumptions related to expenses like Operating expenses, Employees Payroll and Capital Expenditure. Enter the data in peach filled column only.
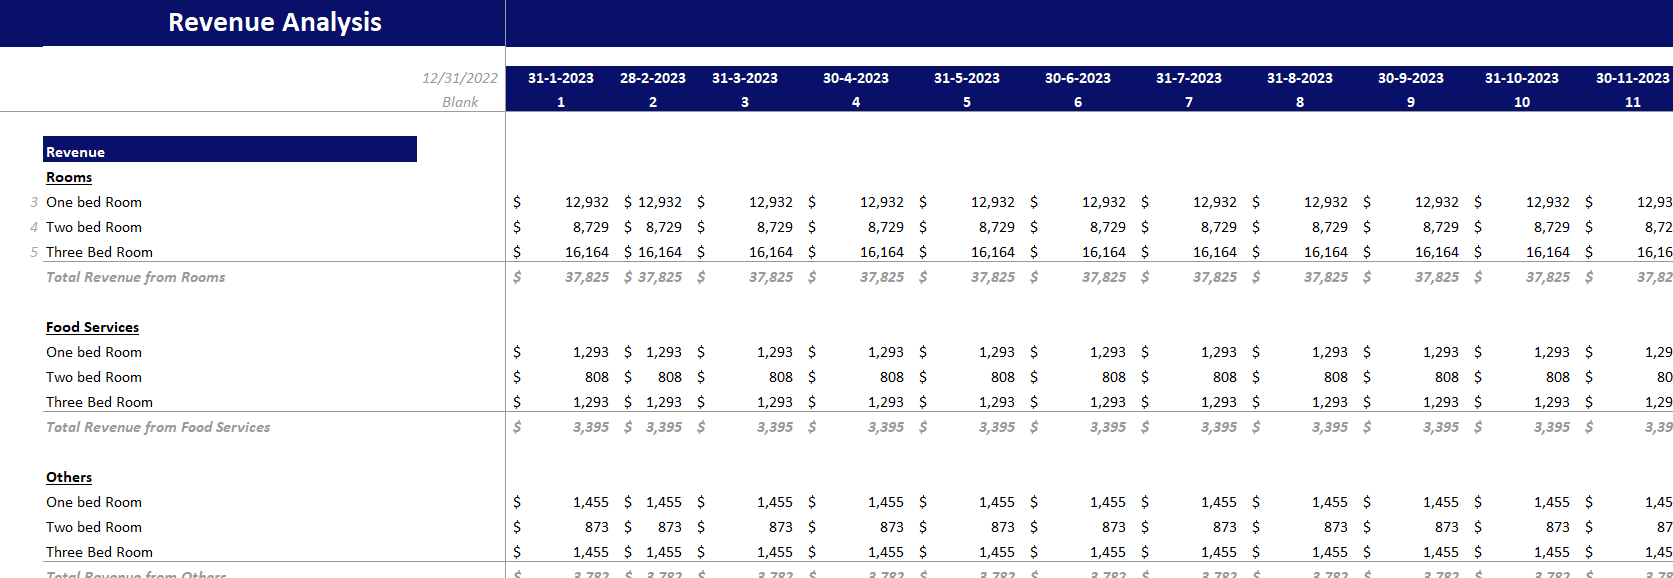
Revenue Analysis
The Revenue analysis sheet estimates revenue from different rooms, Food Services, Other services, and the cost of sales of the same categories.
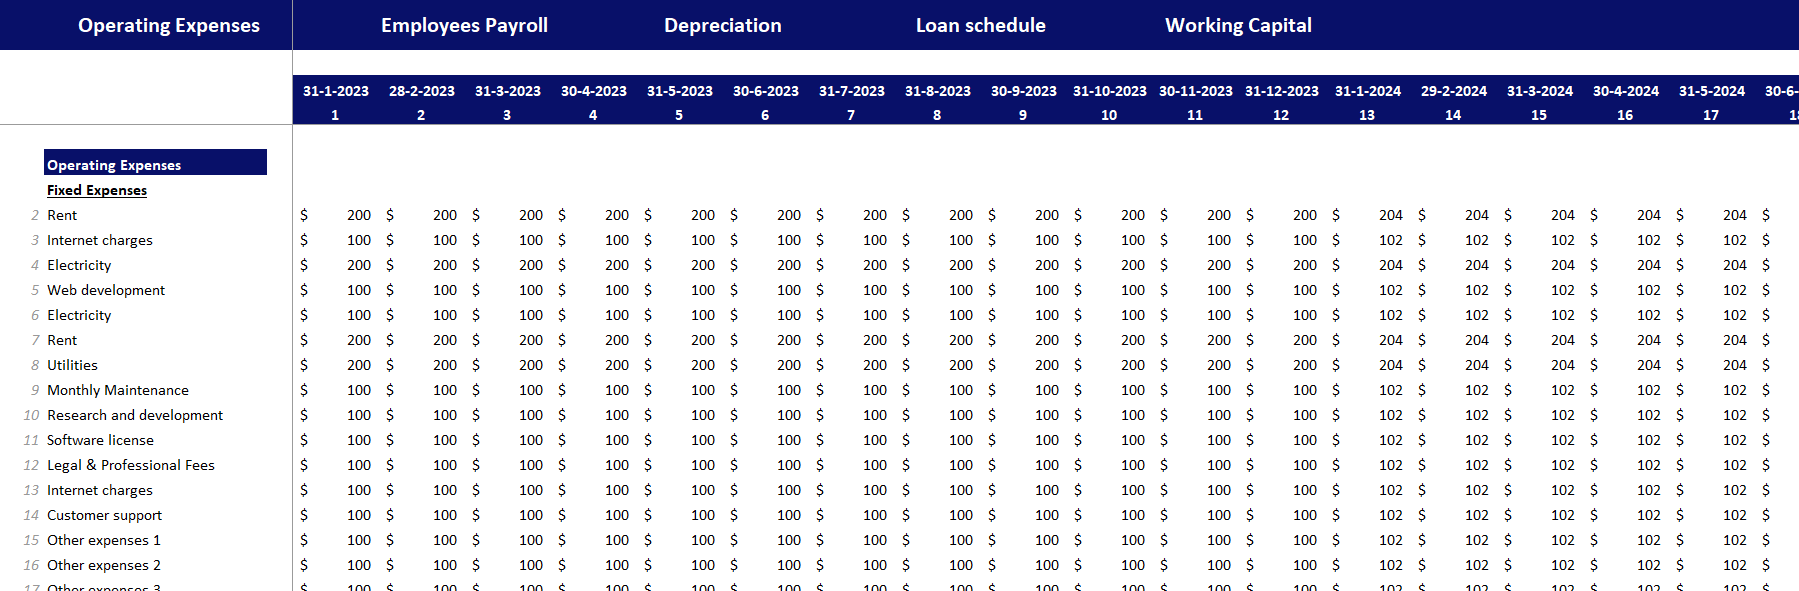
Supporting Details
The supporting Detail sheet contains all the calculations needed to make the Financial Statement: operating expenses, Employee payroll, depreciation, loan, and working capital Calculation.
Financial Statements of Serviced Apartments Excel Financial Model
The Financial Statement sheet has three main Financial Statements Calculations monthly and yearly.
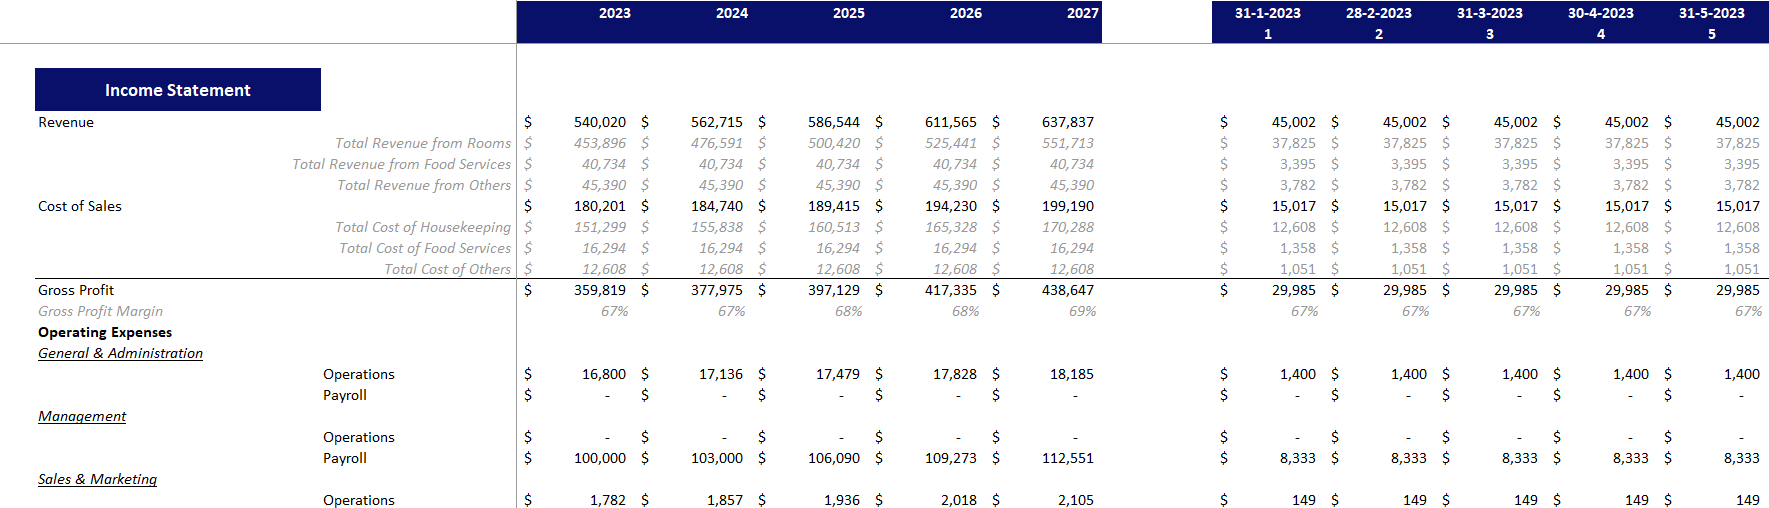
-Income Statement
The income statement estimates the profitability of the company. The Profitability margins from gross profit margin to net profit margin are also incorporated in the income statement to get a clear picture in percentage terms.
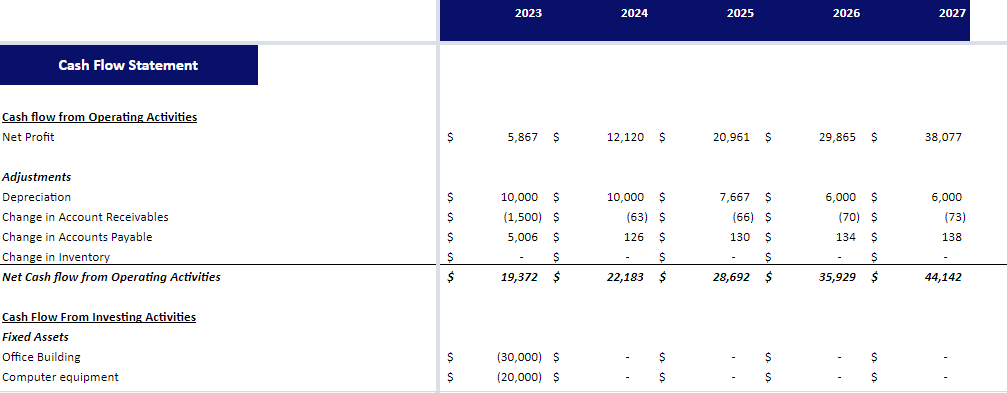
-Cashflow Statement
The Cashflow Statement estimates the cash you will generate from operating, Investing and Financing activities and, lastly, the Net Cash available in the company.
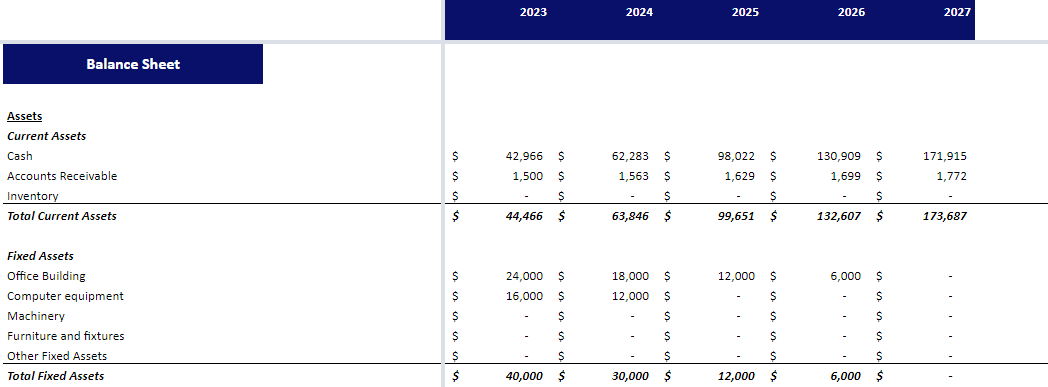
-Balance Sheet
A balance sheet summarizes a business, giving you the company’s financial position, like how many assets, liabilities, and equity you have in your company.
Financial Analysis
The Financial Analysis section estimates the following.
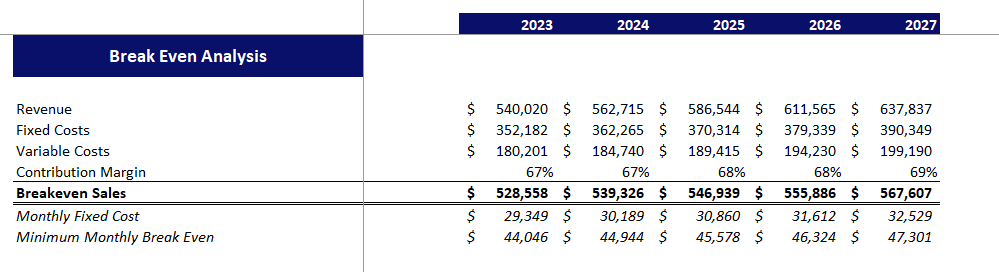
-Breakeven Analysis
The breakeven analysis estimates the sales needed to reach the no-profit, no-loss situation.
-Financial Ratios
The Financial Ratio section estimates solvency, liquidity, profitability, and efficiency ratios to better understand the company’s performance. In addition, you can also compare your ratios with your industry benchmarks.
-Project Evaluation
The Project Evaluation estimates the Net present value of the company, Internal rate of return, minimum expected equity percentage by investors, investors’ required future value, and equity share and payback period.
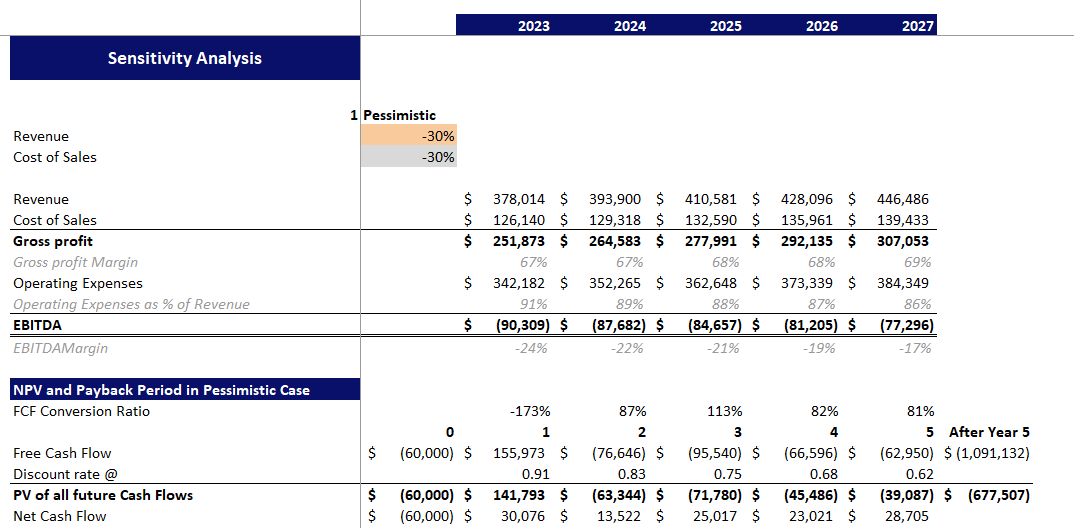
-Sensitivity analysis
The sensitivity analysis estimates the company’s income statement heads, NPV, and the Payback period when Revenue and cost of goods sold are changed while keeping the same expense plan. Furthermore, the sensitivity analysis is done in two ways pessimistic and optimistic.
Dashboard
The dashboard provides a graphical representation of your company’s performance. Average gross profit, net profit, and revenue growth are also included in the dashboard to understand your business’s profitability better.
Advantages of this model
1 Properly integrated data, Change of input will result in a change of the other calculations linked with that input.
2 Detailed calculations with an accurate and standardized pattern.
3 Effortless and easy to use, there is no need to create formulas.
The rise of multinational businesses has led to an increase in global business travel and the need for long-term accommodation. Travelers now seek accommodations that offer ample space, a pleasant environment, convenience, and additional amenities. This trend presents a promising opportunity for startups or businesses in the early stages of establishing serviced apartments. Our Serviced Apartments Financial Model Excel template serves as an excellent tool to assist you in comprehending the financial aspects of your serviced apartment business, attracting investments, and effectively utilizing funds to generate profits.
The profitability of the serviced apartments industry is expected to grow in the future due to the escalating demand, fueled by the projected rise in global business travel spending. With the increasing popularity of serviced apartments, more individuals are entering the market, resulting in intense competition. To succeed in this competitive landscape, new serviced apartment startups must embrace innovation, such as designing unique facilities and engaging activities for their guests. Developed by an Oak Business Consultant, our serviced apartments financial model Excel template is designed to help you analyze your competition and stay abreast of market trends.
The Serviced Apartments Financial Model Excel Template contains the following Sheets.
Assumptions
The Assumption contains Serviced Apartment’s investments, loans, revenue, and cost assumptions. You have to enter the data in peach-filled columns to get accurate results for your company.
Expenses-Input
The expenses-Input contains the assumptions related to expenses like Operating expenses, Employees Payroll and Capital Expenditure. Enter the data in peach filled column only.
Revenue Analysis
The Revenue analysis sheet estimates revenue from different rooms, Food Services, Other services, and the cost of sales of the same categories.
Supporting Details
The supporting Detail sheet contains all the calculations needed to make the Financial Statement: operating expenses, Employee payroll, depreciation, loan, and working capital Calculation.
Financial Statements of Serviced Apartments Excel Financial Model
The Financial Statement sheet has three main Financial Statements Calculations monthly and yearly.
-Income Statement
The income statement estimates the profitability of the company. The Profitability margins from gross profit margin to net profit margin are also incorporated in the income statement to get a clear picture in percentage terms.
-Cashflow Statement
The Cashflow Statement estimates the cash you will generate from operating, Investing and Financing activities and, lastly, the Net Cash available in the company.
-Balance Sheet
A balance sheet summarizes a business, giving you the company’s financial position, like how many assets, liabilities, and equity you have in your company.
Financial Analysis
The Financial Analysis section estimates the following.
-Breakeven Analysis
The breakeven analysis estimates the sales needed to reach the no-profit, no-loss situation.
-Financial Ratios
The Financial Ratio section estimates solvency, liquidity, profitability, and efficiency ratios to better understand the company’s performance. In addition, you can also compare your ratios with your industry benchmarks.
-Project Evaluation
The Project Evaluation estimates the Net present value of the company, Internal rate of return, minimum expected equity percentage by investors, investors’ required future value, and equity share and payback period.
-Sensitivity analysis
The sensitivity analysis estimates the company’s income statement heads, NPV, and the Payback period when Revenue and cost of goods sold are changed while keeping the same expense plan. Furthermore, the sensitivity analysis is done in two ways pessimistic and optimistic.
Dashboard
The dashboard provides a graphical representation of your company’s performance. Average gross profit, net profit, and revenue growth are also included in the dashboard to understand your business’s profitability better.
Advantages of this model
1 Properly integrated data, Change of input will result in a change of the other calculations linked with that input.
2 Detailed calculations with an accurate and standardized pattern.
3 Effortless and easy to use, there is no need to create formulas.
This Best Practice includes
1 Excel file(7 tabs)
Further information
The objective of this template is to provide a comprehensive tool for individuals or businesses considering or already involved in the serviced apartment industry.
For serviced apartments excel financial model
