
Publication number: ELQ-46422-1
View all versions & Certificate

Imaging Center Financial Model
Excel model for forecasting the financial performance of an imaging center providing different types of scans such as MRI, CT, X-Ray, Ultrasound, etc.
Seasoned Financial Analyst: Excel Modeling, Data Analysis and Data VisualizationFollow 111
Summary:
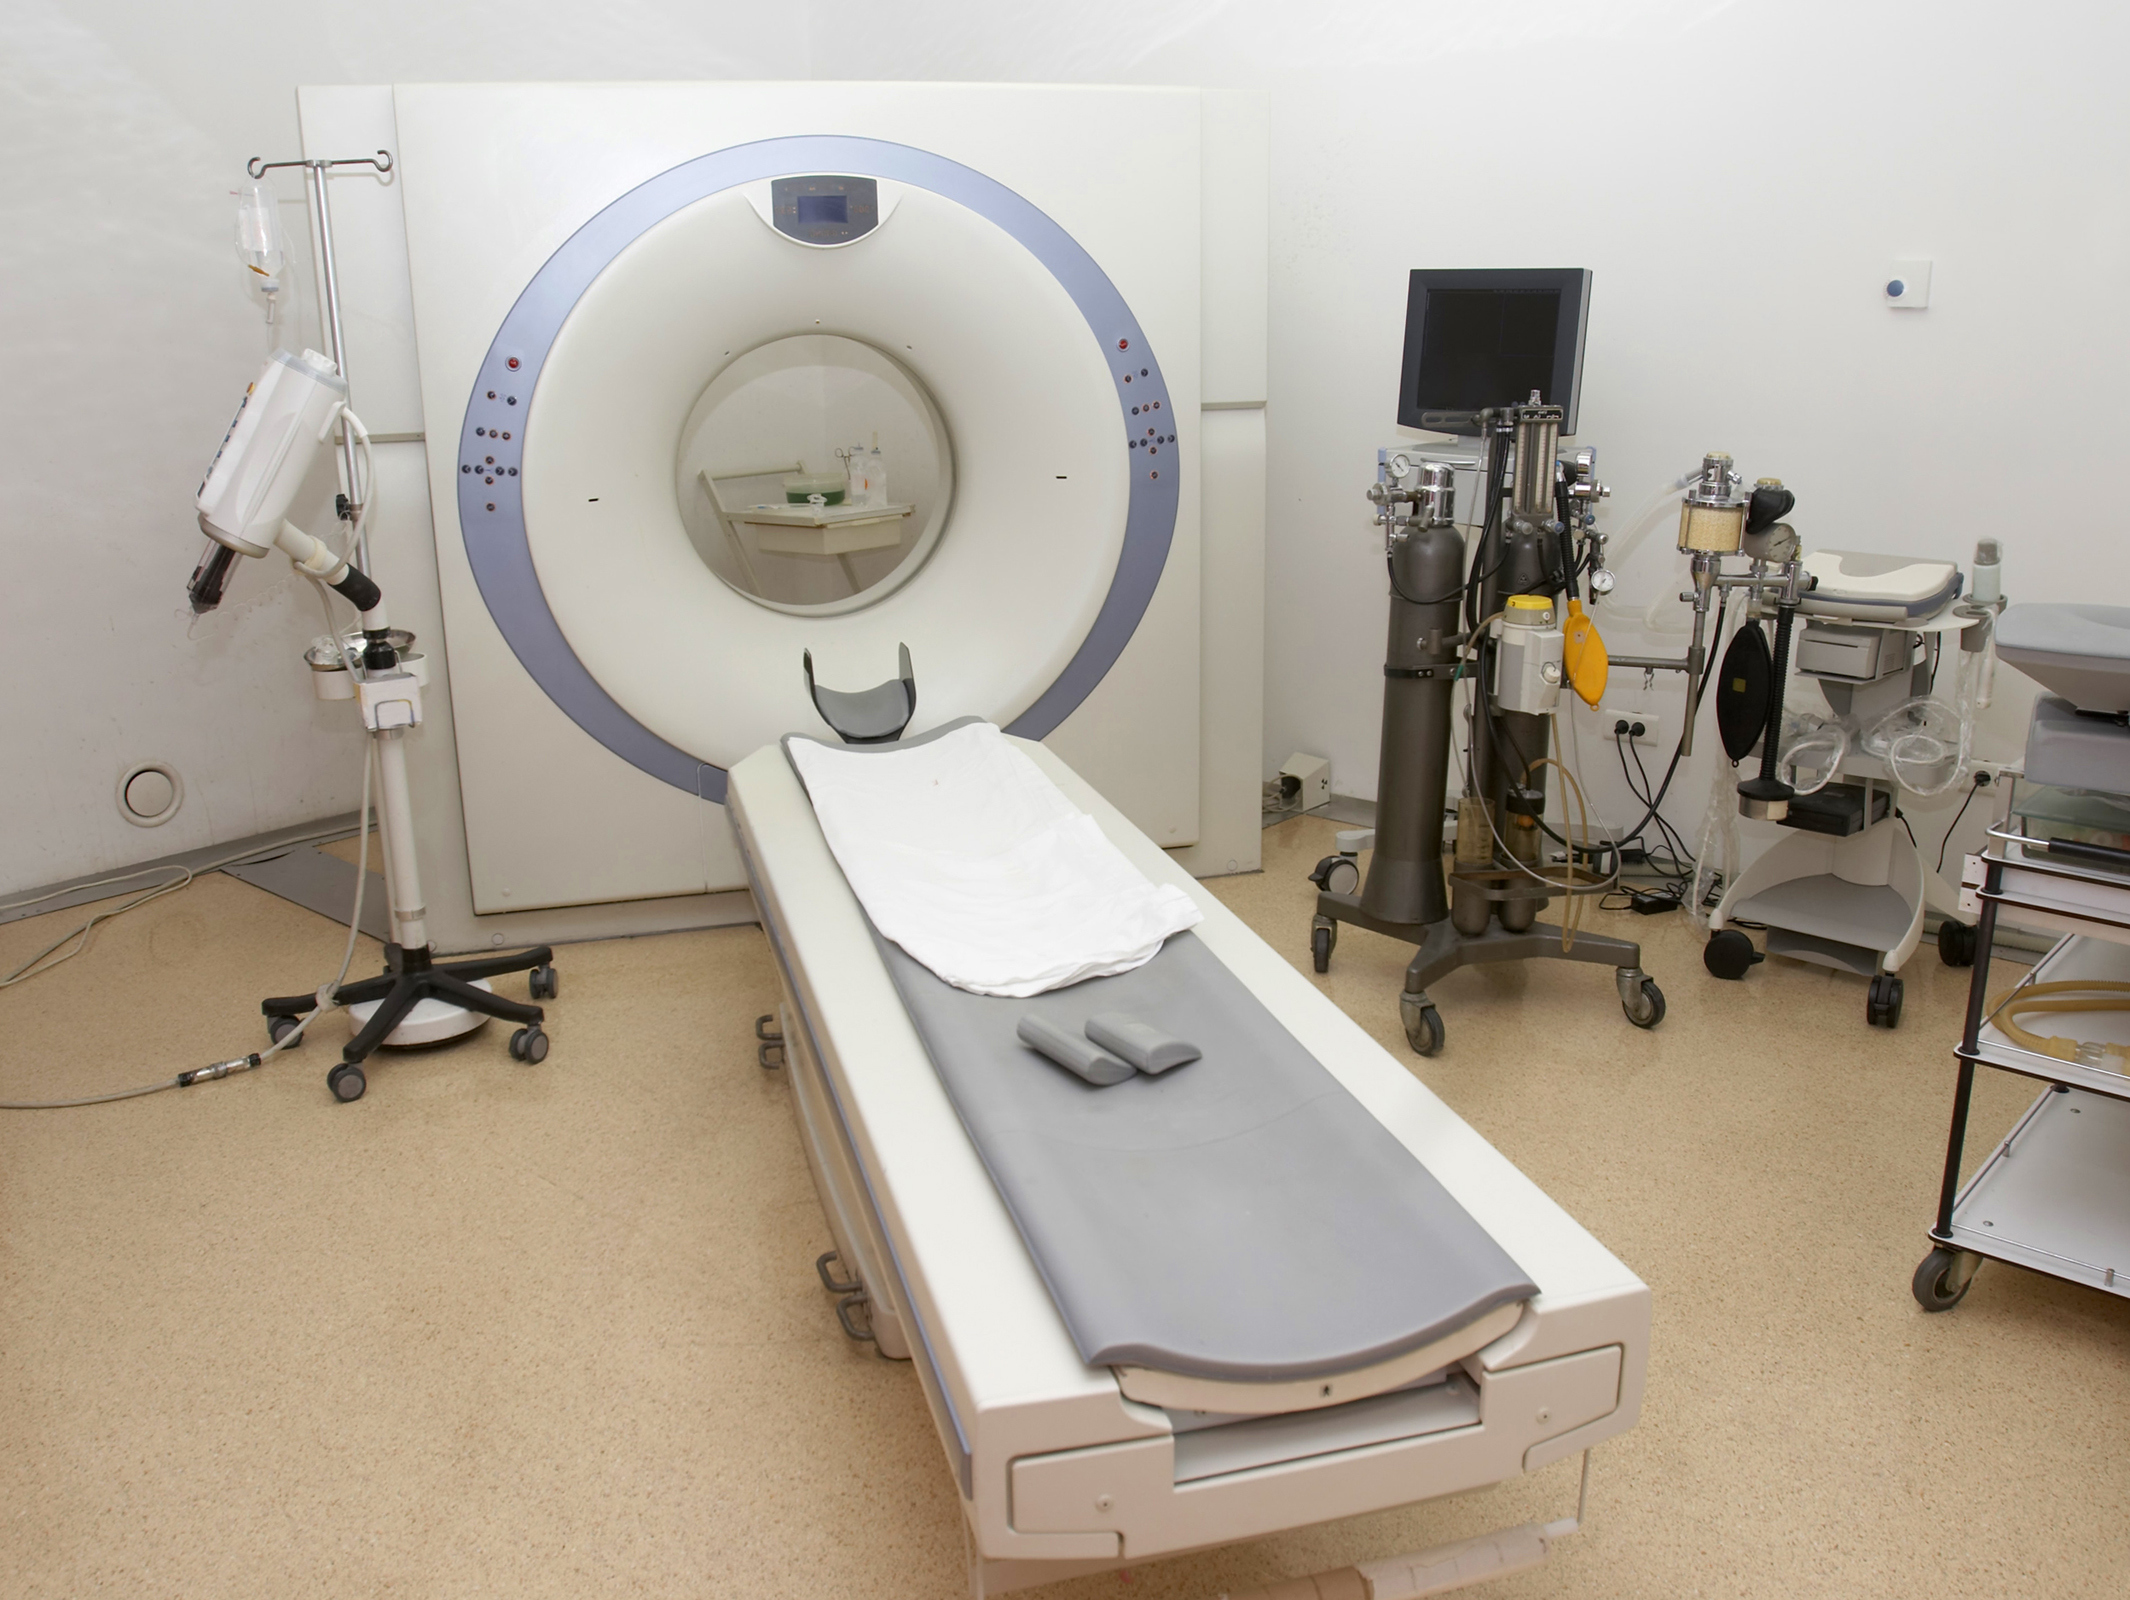
The Imaging Center financial model is a comprehensive and versatile tool designed to analyze and forecast the financial performance of imaging service business whose clients are individual patients, healthcare providers and corporates. The business earns revenue from diagnostic imaging services, preventative screening packages, image archiving and retrieval services and consultation and interpretation fees. The center's technologists perform different scans, including MRI scans, CT scans, X-Rays, ultrasound, Bone density scan (DEXA) and mammography. The business employs its own radiologists for detailed analysis and interpretation of the scans, and also outsources some analyses to external radiologists.
The model encompasses a range of tabs, including “Inputs” for data entry and assumptions, “Outputs” for presenting key results, “Financial Statements” for integrated income statement, balance sheet, and cash flow statement, “Calculations” for granular financial line item breakdowns, and “Graphs” for visually insightful representations of KPIs, revenue, profitability, expense composition, cash flows, and balance sheet items.
The business is often referred to as a radiology center. However, it's important to note that this model does not include interventional radiology (IR) procedures. For IR procedures, please refer to a separate model designed specifically for radiology centers.
Detailed Description:
This comprehensive financial model has been meticulously designed to provide a strategic roadmap for your imaging business, which is also known by other names such as Medical Imaging Services, Clinical Imaging, Radiographic Services and Radiology Service and Diagnostic Imaging Services.
With a horizon extending over five years, the model encapsulates monthly projections that aggregate into annual forecasts. The revenue streams include diagnostic imaging services, preventative screening packages, image archiving and retrieval services and consultation and interpretation fees, ensuring a comprehensive representation of all income sources.
Designed to cater to diverse financial needs, the model proves to be an invaluable tool for investor presentations, internal analysis, loan applications, and other financial deliberations. The model’s intuitive design is complemented by detailed guidance provided within the 'Instructions & Description' tabs, facilitating seamless navigation and input entry across its various tabs.
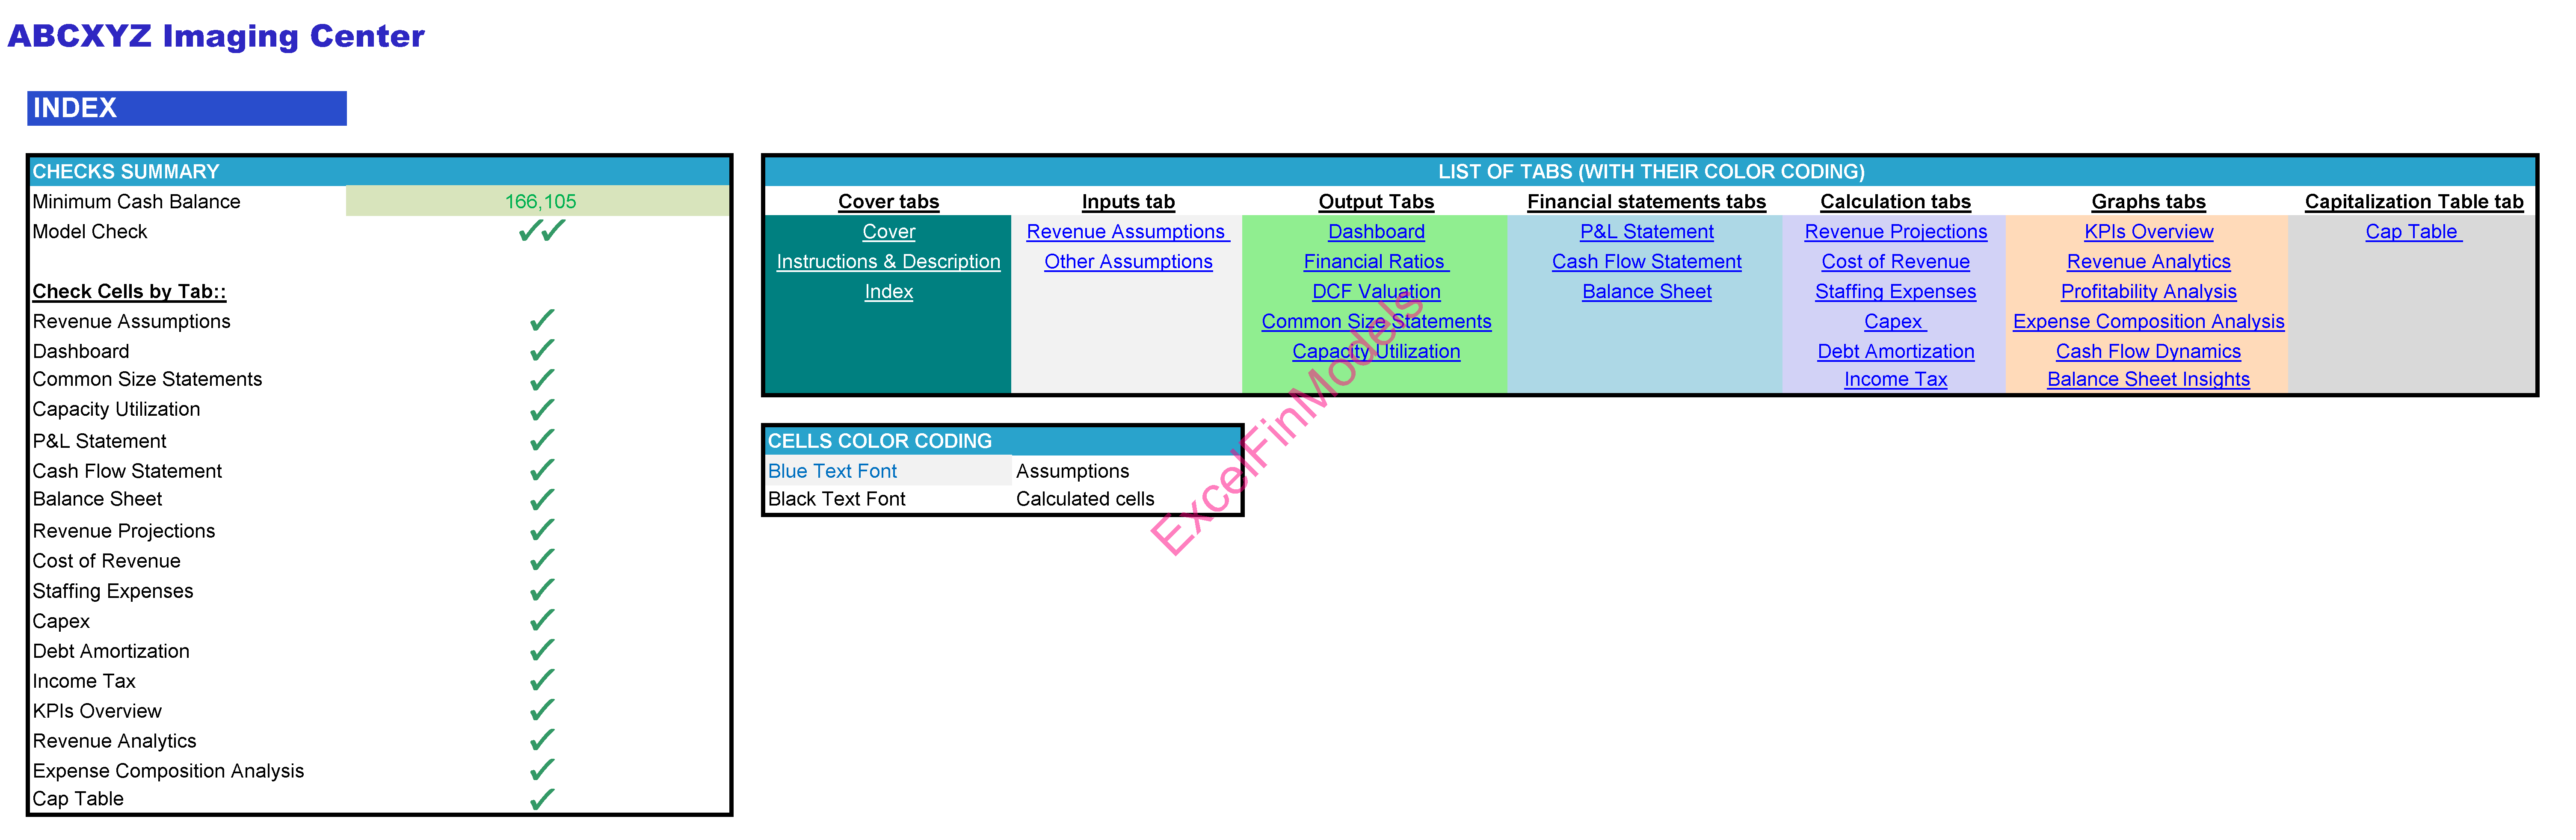
Rows for 'check cells' have been incorporated at the end of each tab to flag potential inconsistencies or errors within the model. These checks include ensuring numbers fall within an expected range, monthly figures sum up to the corresponding annual totals, beginning/end-of-year balances match the first/last month's figures, and figures correspond between two different tabs. When an inconsistency or error is detected, the corresponding check cell will display a '1'; otherwise, it will show '0'. Column A in each tab is designated for validation checks, showing the total of all check cells in that row. A green tick mark (✔) indicates no discrepancies, while a red cross (✖) alerts to an error. The aggregated result of all check rows in Column A is displayed in cell A4 of the tab. The Index tab consolidates check cells from all sheets, providing a quick overview and aiding in easy identification of discrepancies on any particular sheet. If the overall model check is satisfactory, cell A3 on each tab will display a double green tick mark (✔✔); otherwise, it will show a double red cross (✖✖)."
The financial model is organized into 26 different tabs, categorized into seven sections: Cover Tabs, Input Tabs, Output Tabs, Financial Statements Tabs, Calculation Tabs, Graphs Tabs, and the Cap Table. This structure offers a panoramic view of the business’s financial landscape:
1. Cover Tabs: The cover tabs provide:
Ø Crucial instructions
Ø Description of all the tabs in the model
Ø Color coding conventions
Ø Navigation guidance
Ø Essential checkpoints
2. Inputs Tabs: The input tabs in the financial model enable customization and alignment with your business's unique characteristics and operational strategies. Below is a breakdown of the key functionalities within this section:
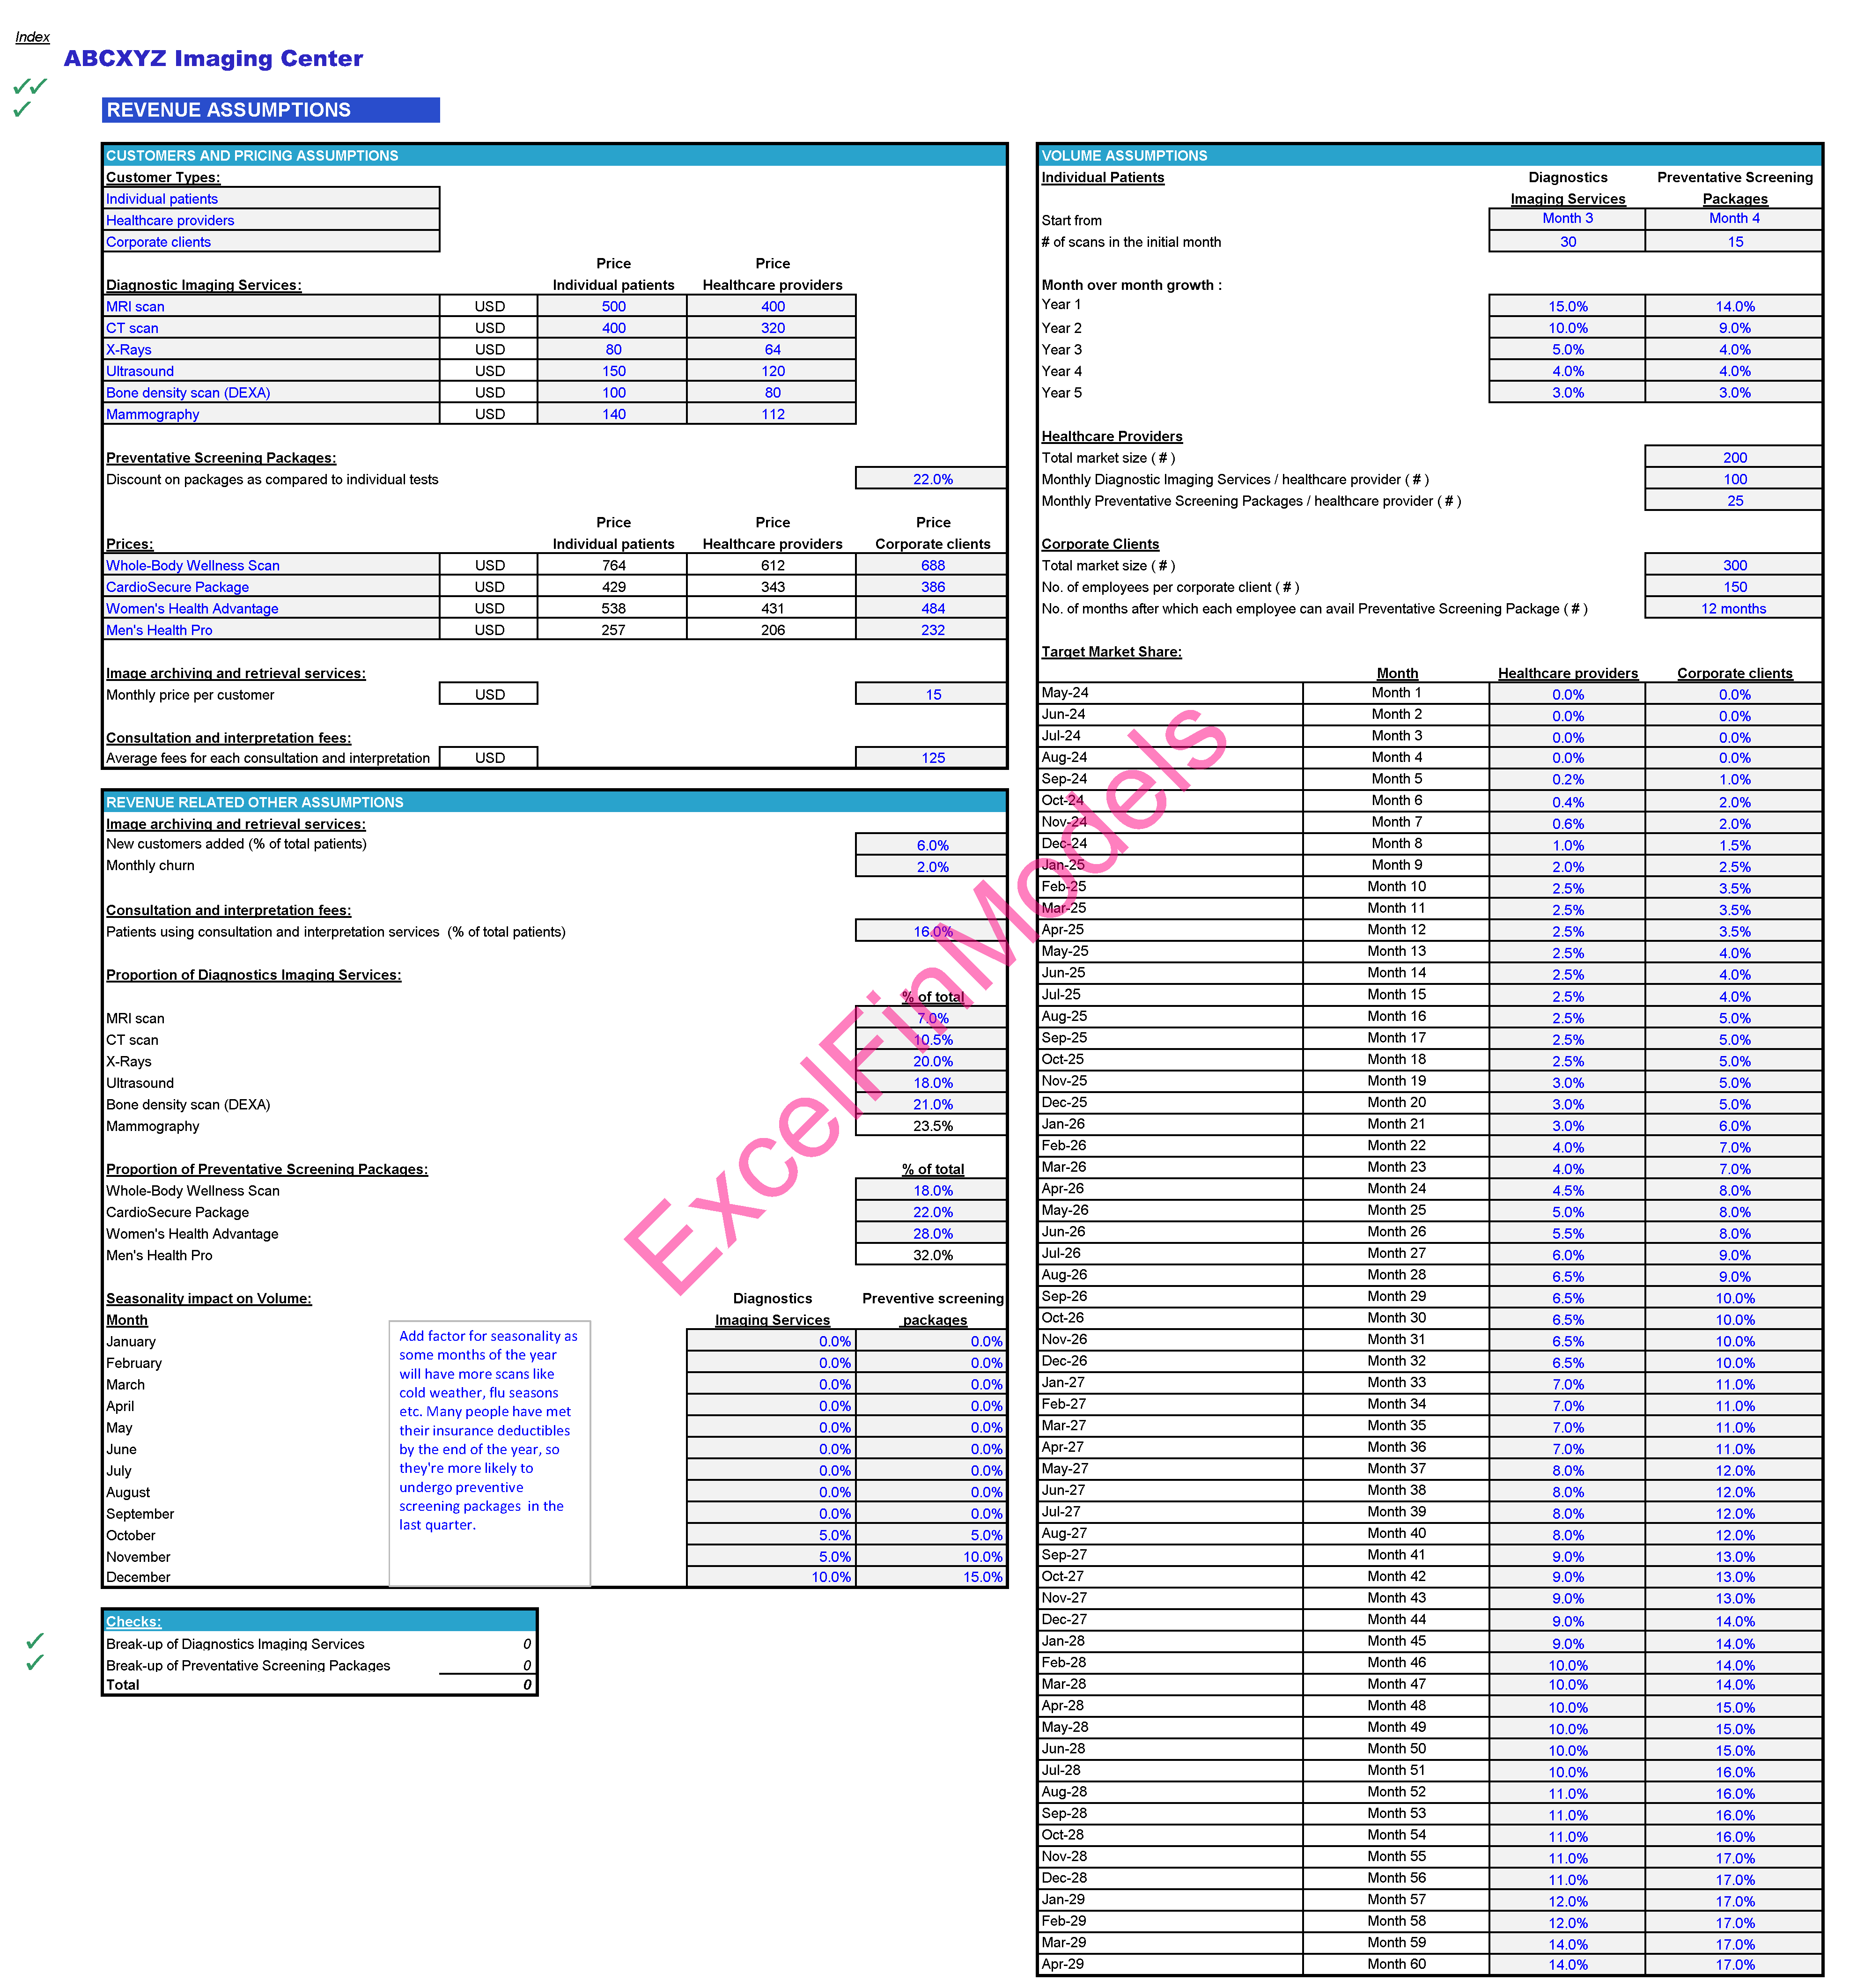
Ø Revenue Assumptions: This sub-section comprehensively covers key revenue-driving variables for the following revenue streams:
o Diagnostic imaging services
o Preventative screening packages
o Image archiving and retrieval services
o Consultation and interpretation fee
These variables include pricing strategy, product/service mix, volume, growth, market size, seasonality, etc.
Ø General Assumptions: This sub-section gathers essential foundational parameters for your business which include:
o Name of your business
o Start month and year of financial projections
o Currency
o Inflation rate
o Payroll taxes and benefits
o Income tax rate etc.
Ø Cost of Revenue Assumptions: These inputs provide insights into the core operating costs like:
o Material costs such as costs of contrast media, disposable syringes, film or markers, ultrasound gel, disposable covers, calibration phantoms, sanitizing wipes, film or digital storage etc.
o Technologists' salaries, payroll taxes & benefits
o In-house radiologists' salaries, payroll taxes & benefits
o External radiologists' charges
o Data transfer costs for analyses by external radiologists
o Medical waste disposal
o Miscellaneous supplies
o Data storage & transfer costs for image archiving and retrieval services
o Consultation and interpretation Fees
Ø S, G&A Expenses: This section accounts for inputs related to selling, general, and administrative expenses, including office rent, advertising, software & computer costs, travel, telephone and internet, meals, insurance, utilities, website maintenance etc.
Sales & marketing expenses are split into:
o Expenses as a % of revenue
o Expenses per employee
o Fixed monthly amounts.
General & Administrative expenses are categorized by:
o % of revenue
o Expenses per employee
o Expenses per new employee
o Fixed monthly amounts
The model offers flexibility, allowing users to adjust assumptions annually over a five-year period to accommodate different forecasting scenarios. A standout feature is the ability to select a start month for each expense, enabling accurate reflection of when each cost item will begin in the financial projections.
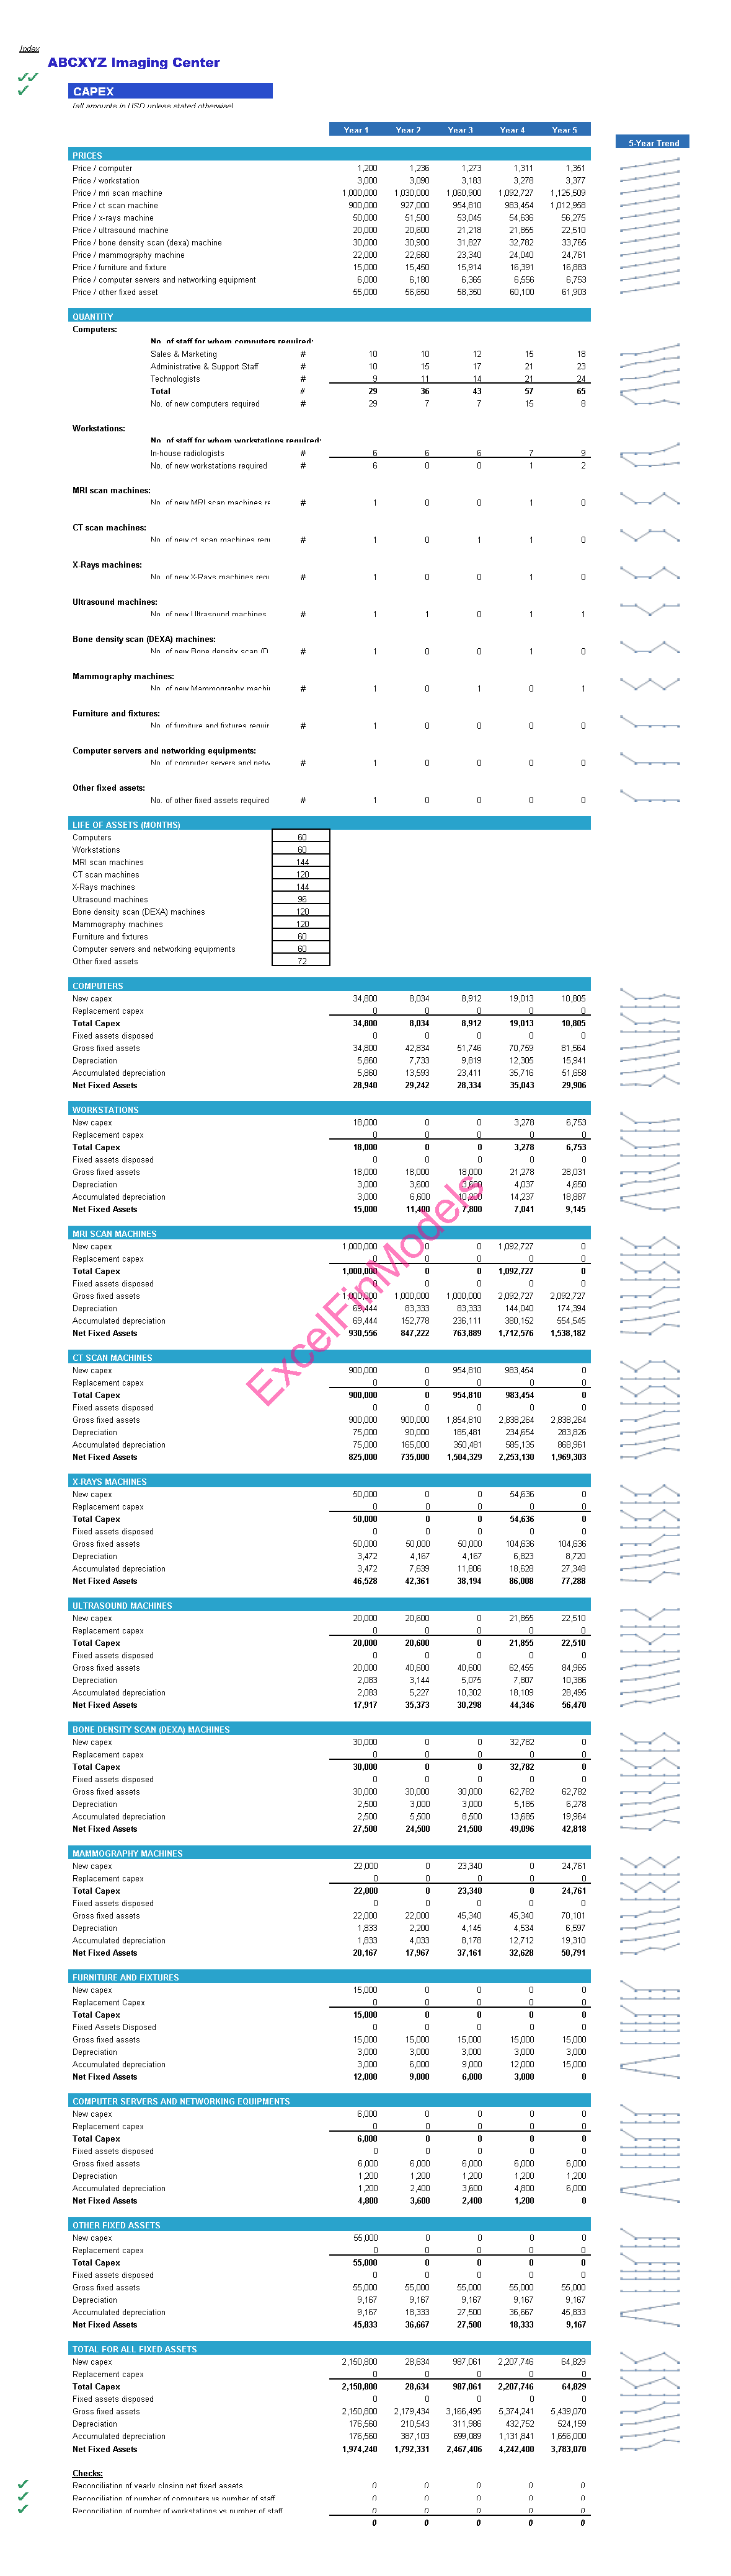
Ø Capex: The CapEx (capital expenditure) input section of the financial model serves as a critical component for strategic financial planning and asset management. It requires the following inputs:
o Different types of assets
o Cost per unit for each type of asset
o Useful life of each asset
The business needs capital expenditure on MRI scanning machine, CT scanning machines, X-Rays machines, ultrasound machines, Bone density scan (DEXA) machines, mammography machine, computers, workstations etc
Ø Working Capital Assumptions: The Working Capital Assumptions input section of the financial model is a pivotal component for managing the short-term financial health of your business. It provides a structured framework to input essential parameters, which include:
o Accounts receivable days (the time it takes to collect payments from customers)
o Accounts payable days (the time you have to pay your suppliers)
o Inventory turnover days (holding days of inventory)
o Allocation of revenue to other current assets
o Allocation of COGS to other current liabilities
o Income tax payment frequency
These assumptions play a fundamental role in optimizing cash flow, liquidity, and operational efficiency.
Ø Financing Assumptions: This sub-section allows you to input key assumptions concerning the timing and magnitude of fundraising activities from founders, investors, and debt sources. Here, you can specify when and how much capital will be raised from these critical sources. Additionally, this tab accommodates essential debt-related assumptions, encompassing loan terms and interest rates, which are instrumental in managing your company's financial obligations and optimizing its capital structure.
Ø One-time Expenses Assumptions: This sub-section helps in quantifying essential initial costs, including but not limited to initial marketing expenses, legal fees, registration charges, attorney fees, and staff training costs. These assumptions are pivotal for estimating the financing required to kickstart operations.
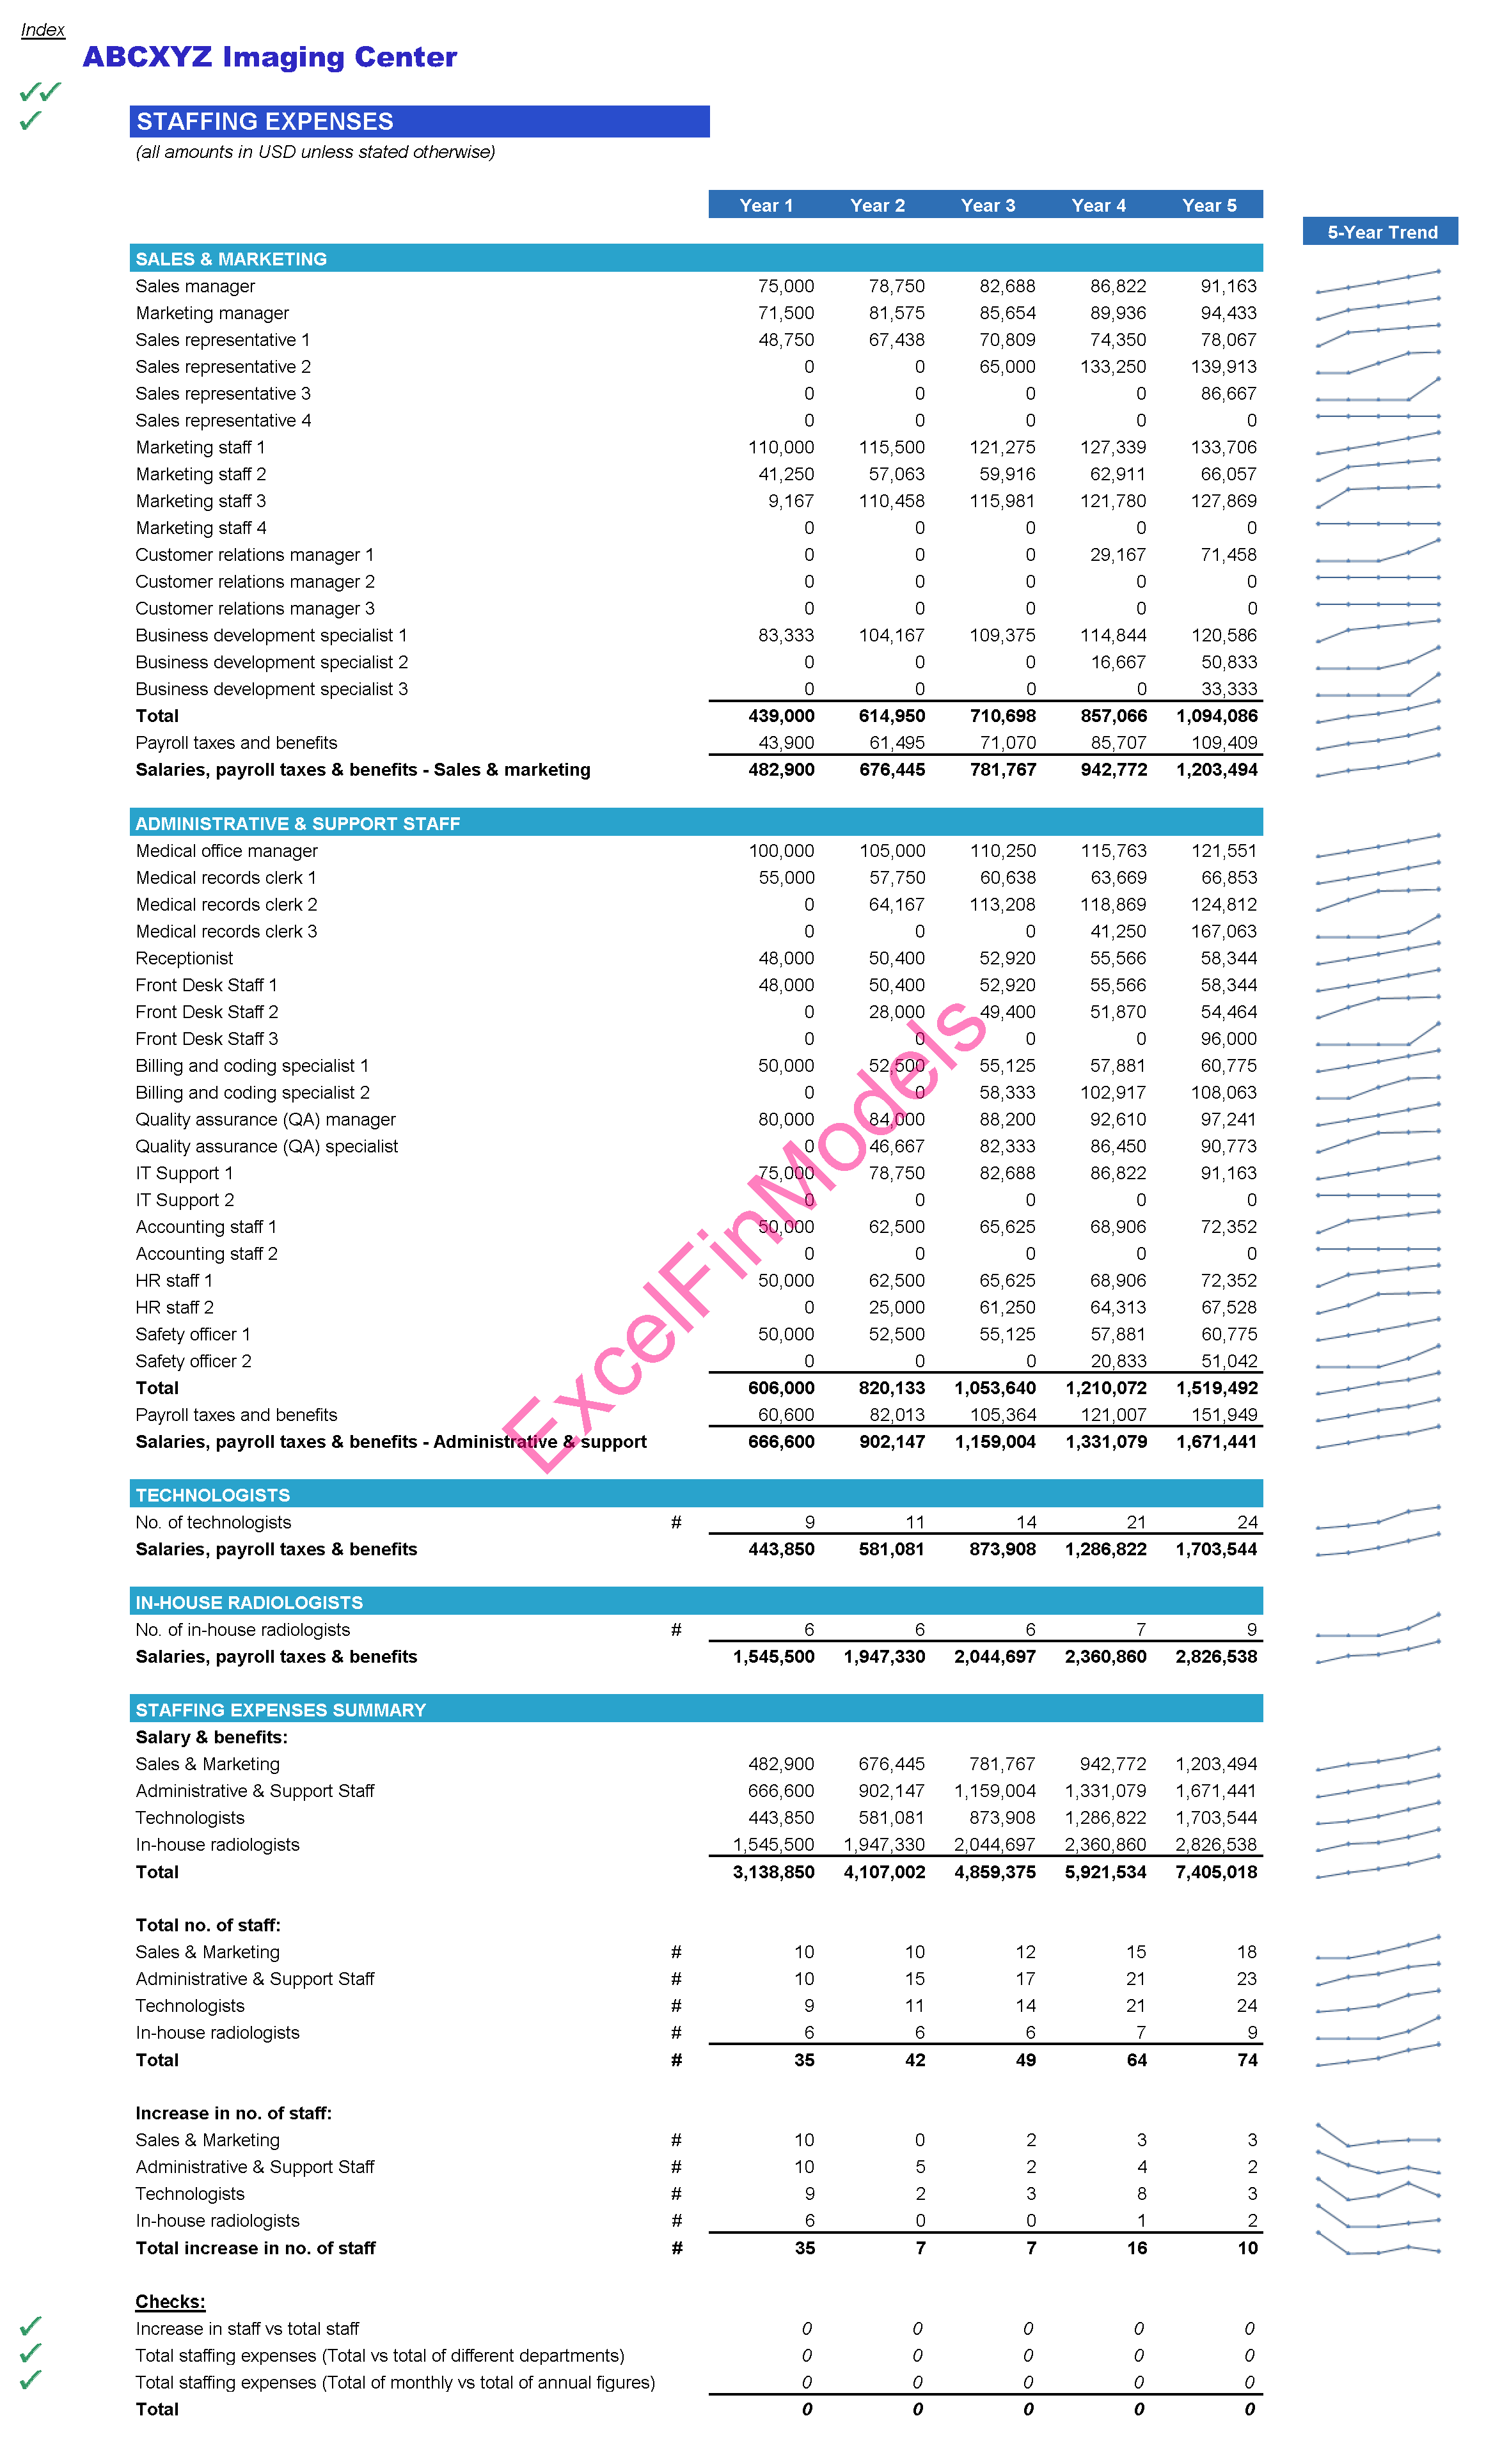
Ø Staffing Assumptions: This section allows you to define various staffing positions categorized into sales & marketing and administrative and support staff. The following inputs are required for different staffing positions:
o Salary
o Start month
o End month
o Annual salary
o No. of employees hired in the same month for the same position
3. Output Tabs: The output section of the financial model is the culmination of rigorous financial analysis, offering a comprehensive and visually intuitive snapshot of your business's financial health and performance. These tabs include:
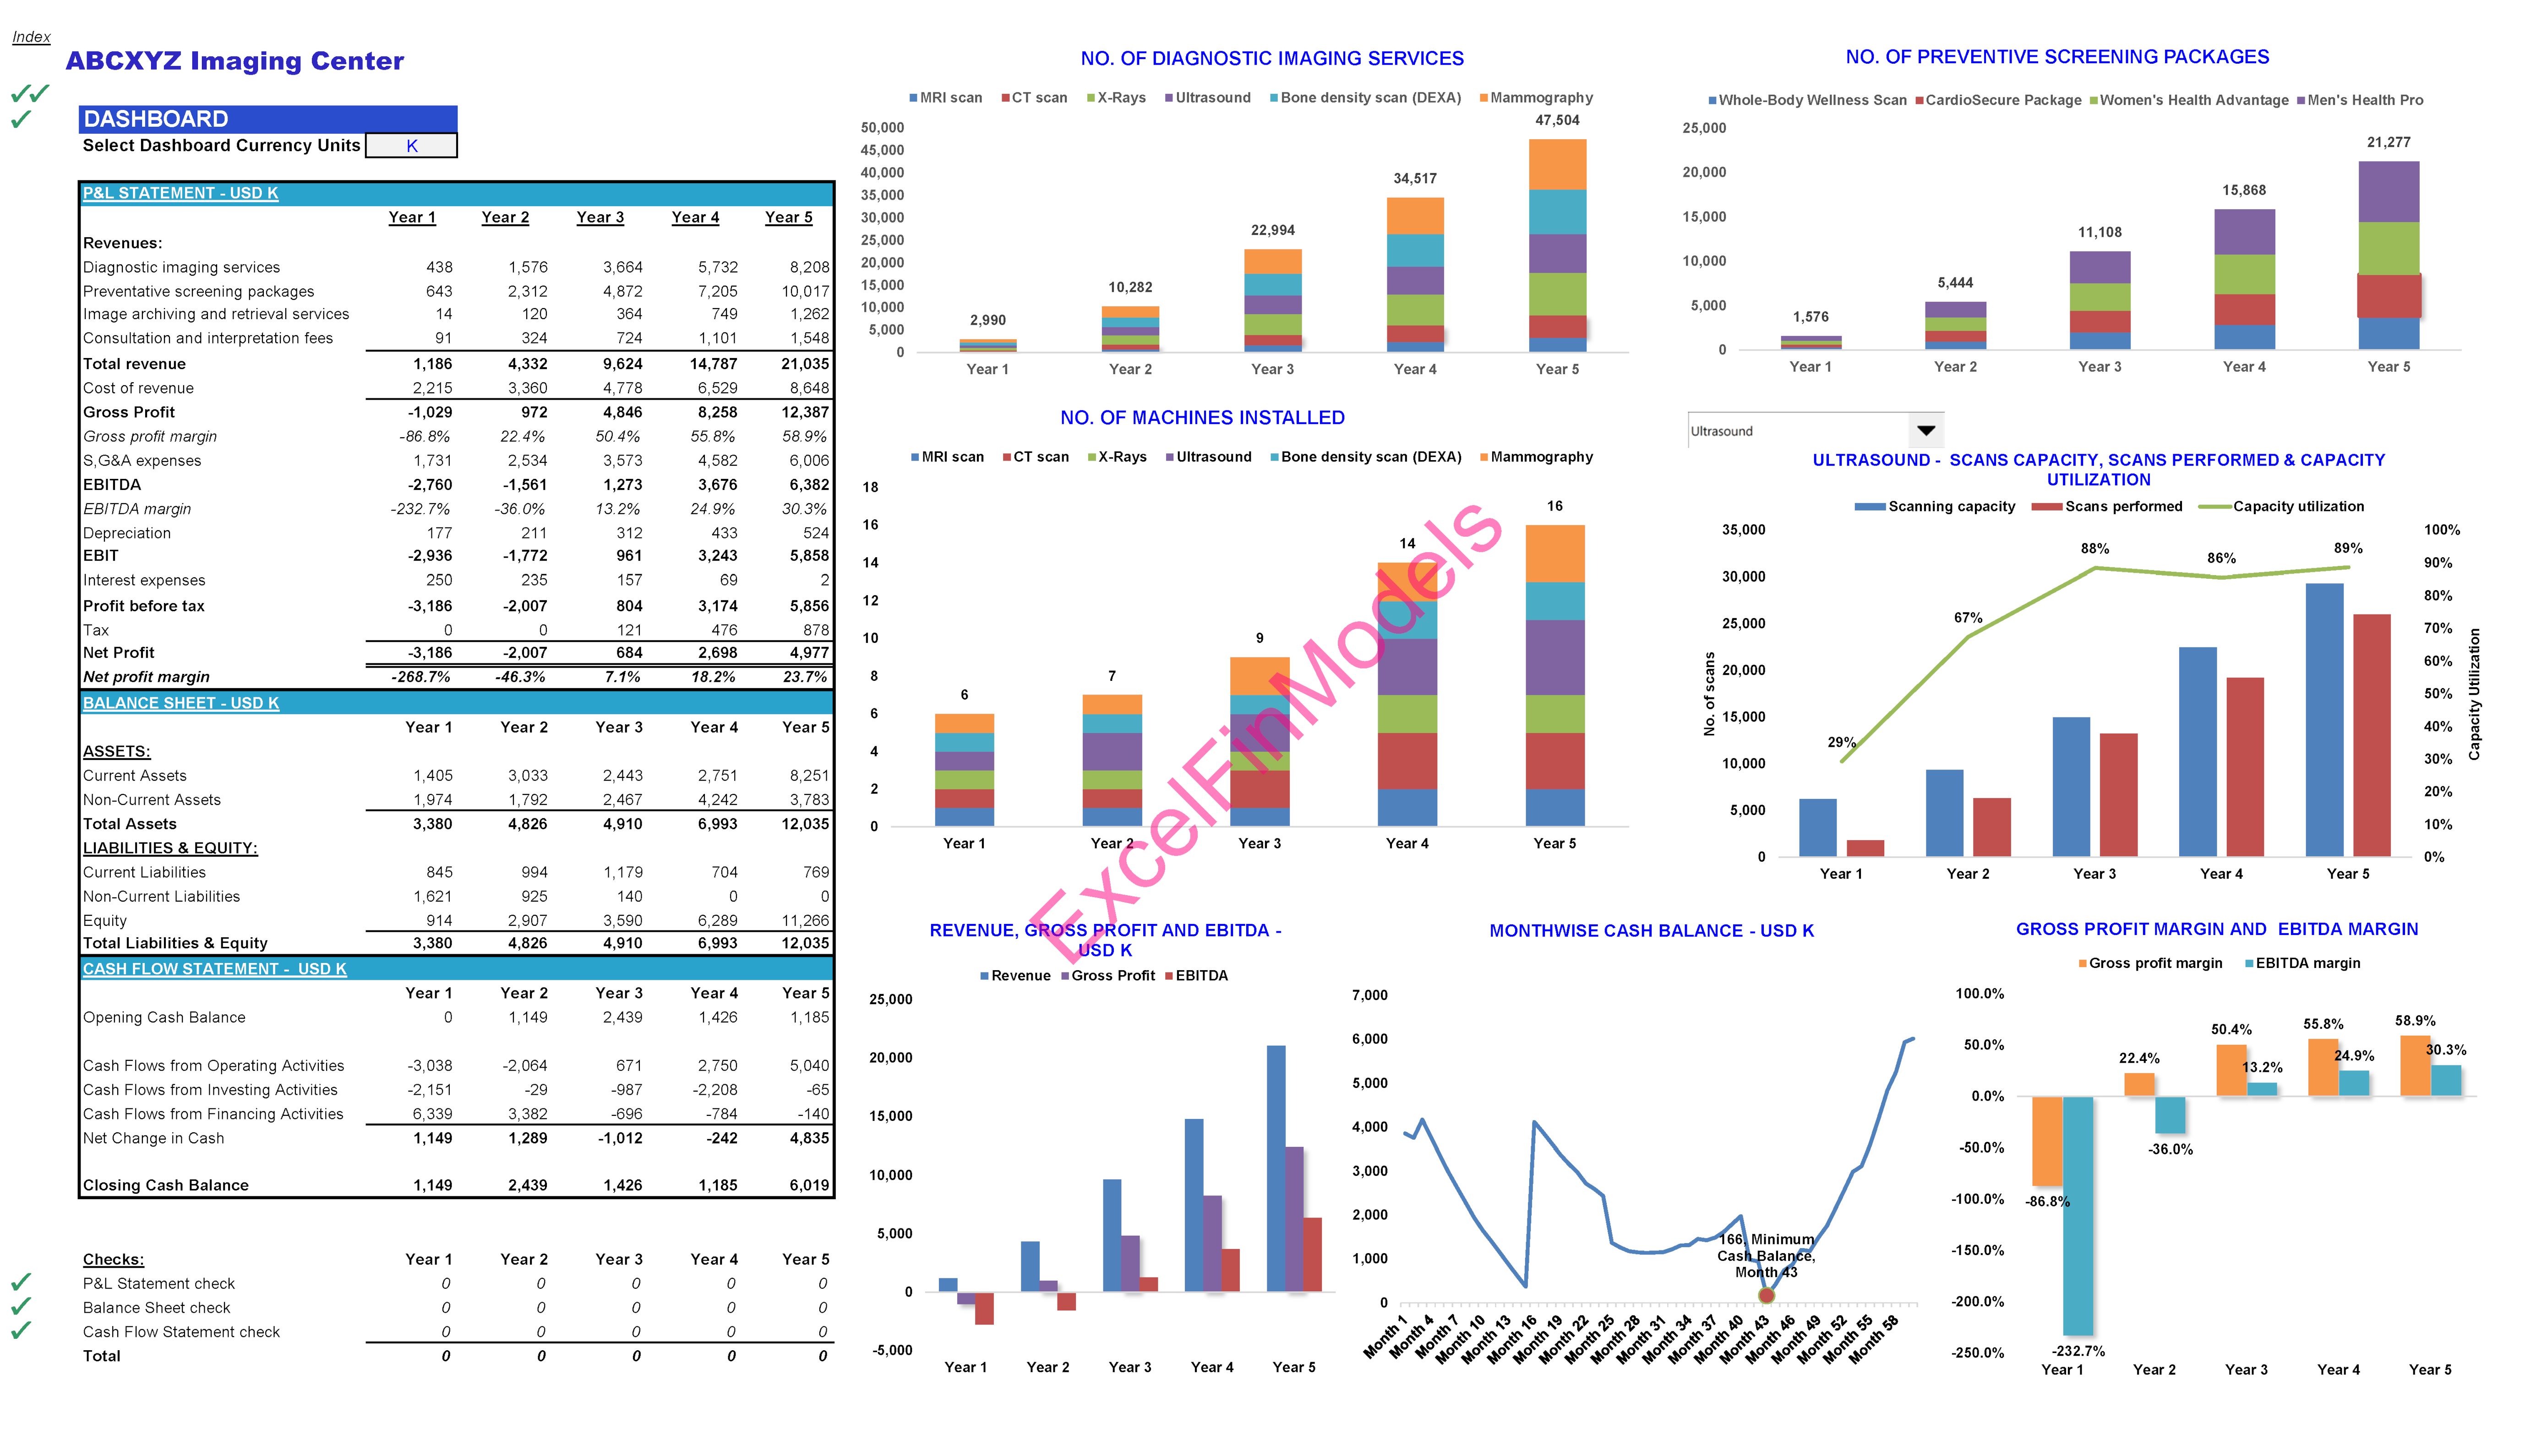
o Dashboard: The tab provides a concise yet insightful overview of essential financial statements, key performance indicators (KPIs), vital financial metrics, and significant profitability financial ratios.
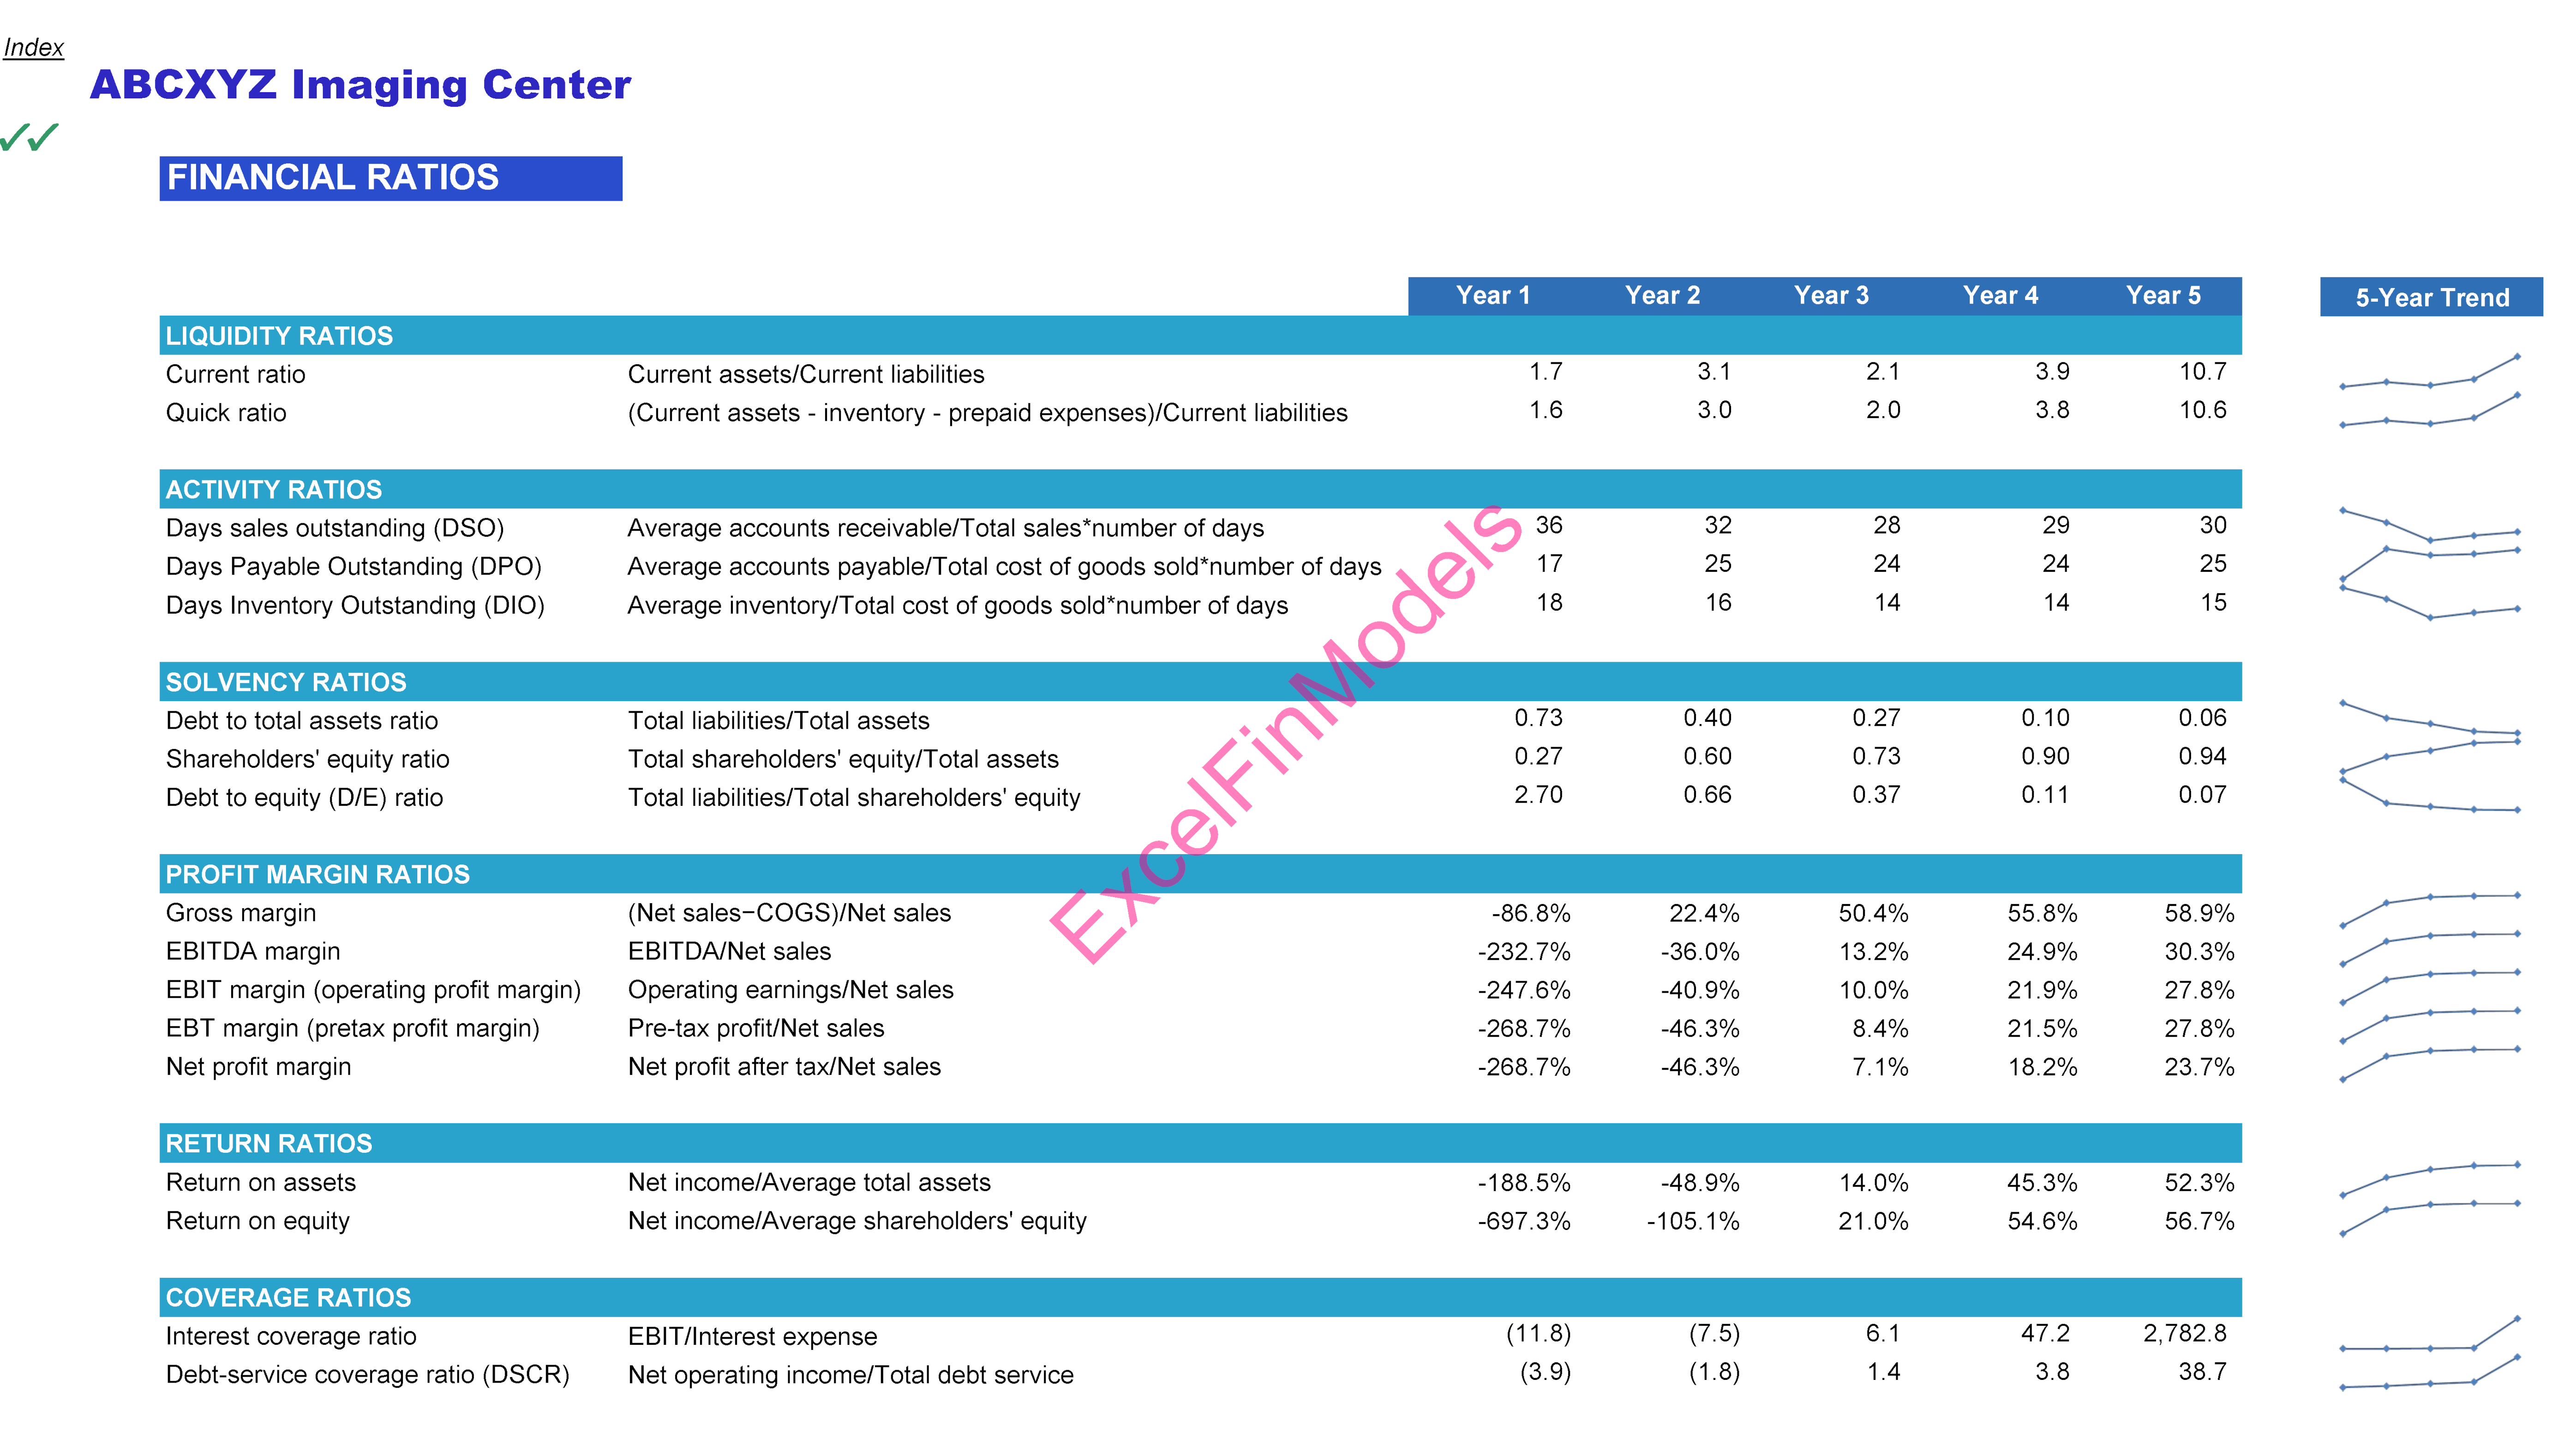
o Financial ratios: It offers a deep dive into various financial indicators, facilitating a nuanced understanding of your company's financial stability and risk exposure.
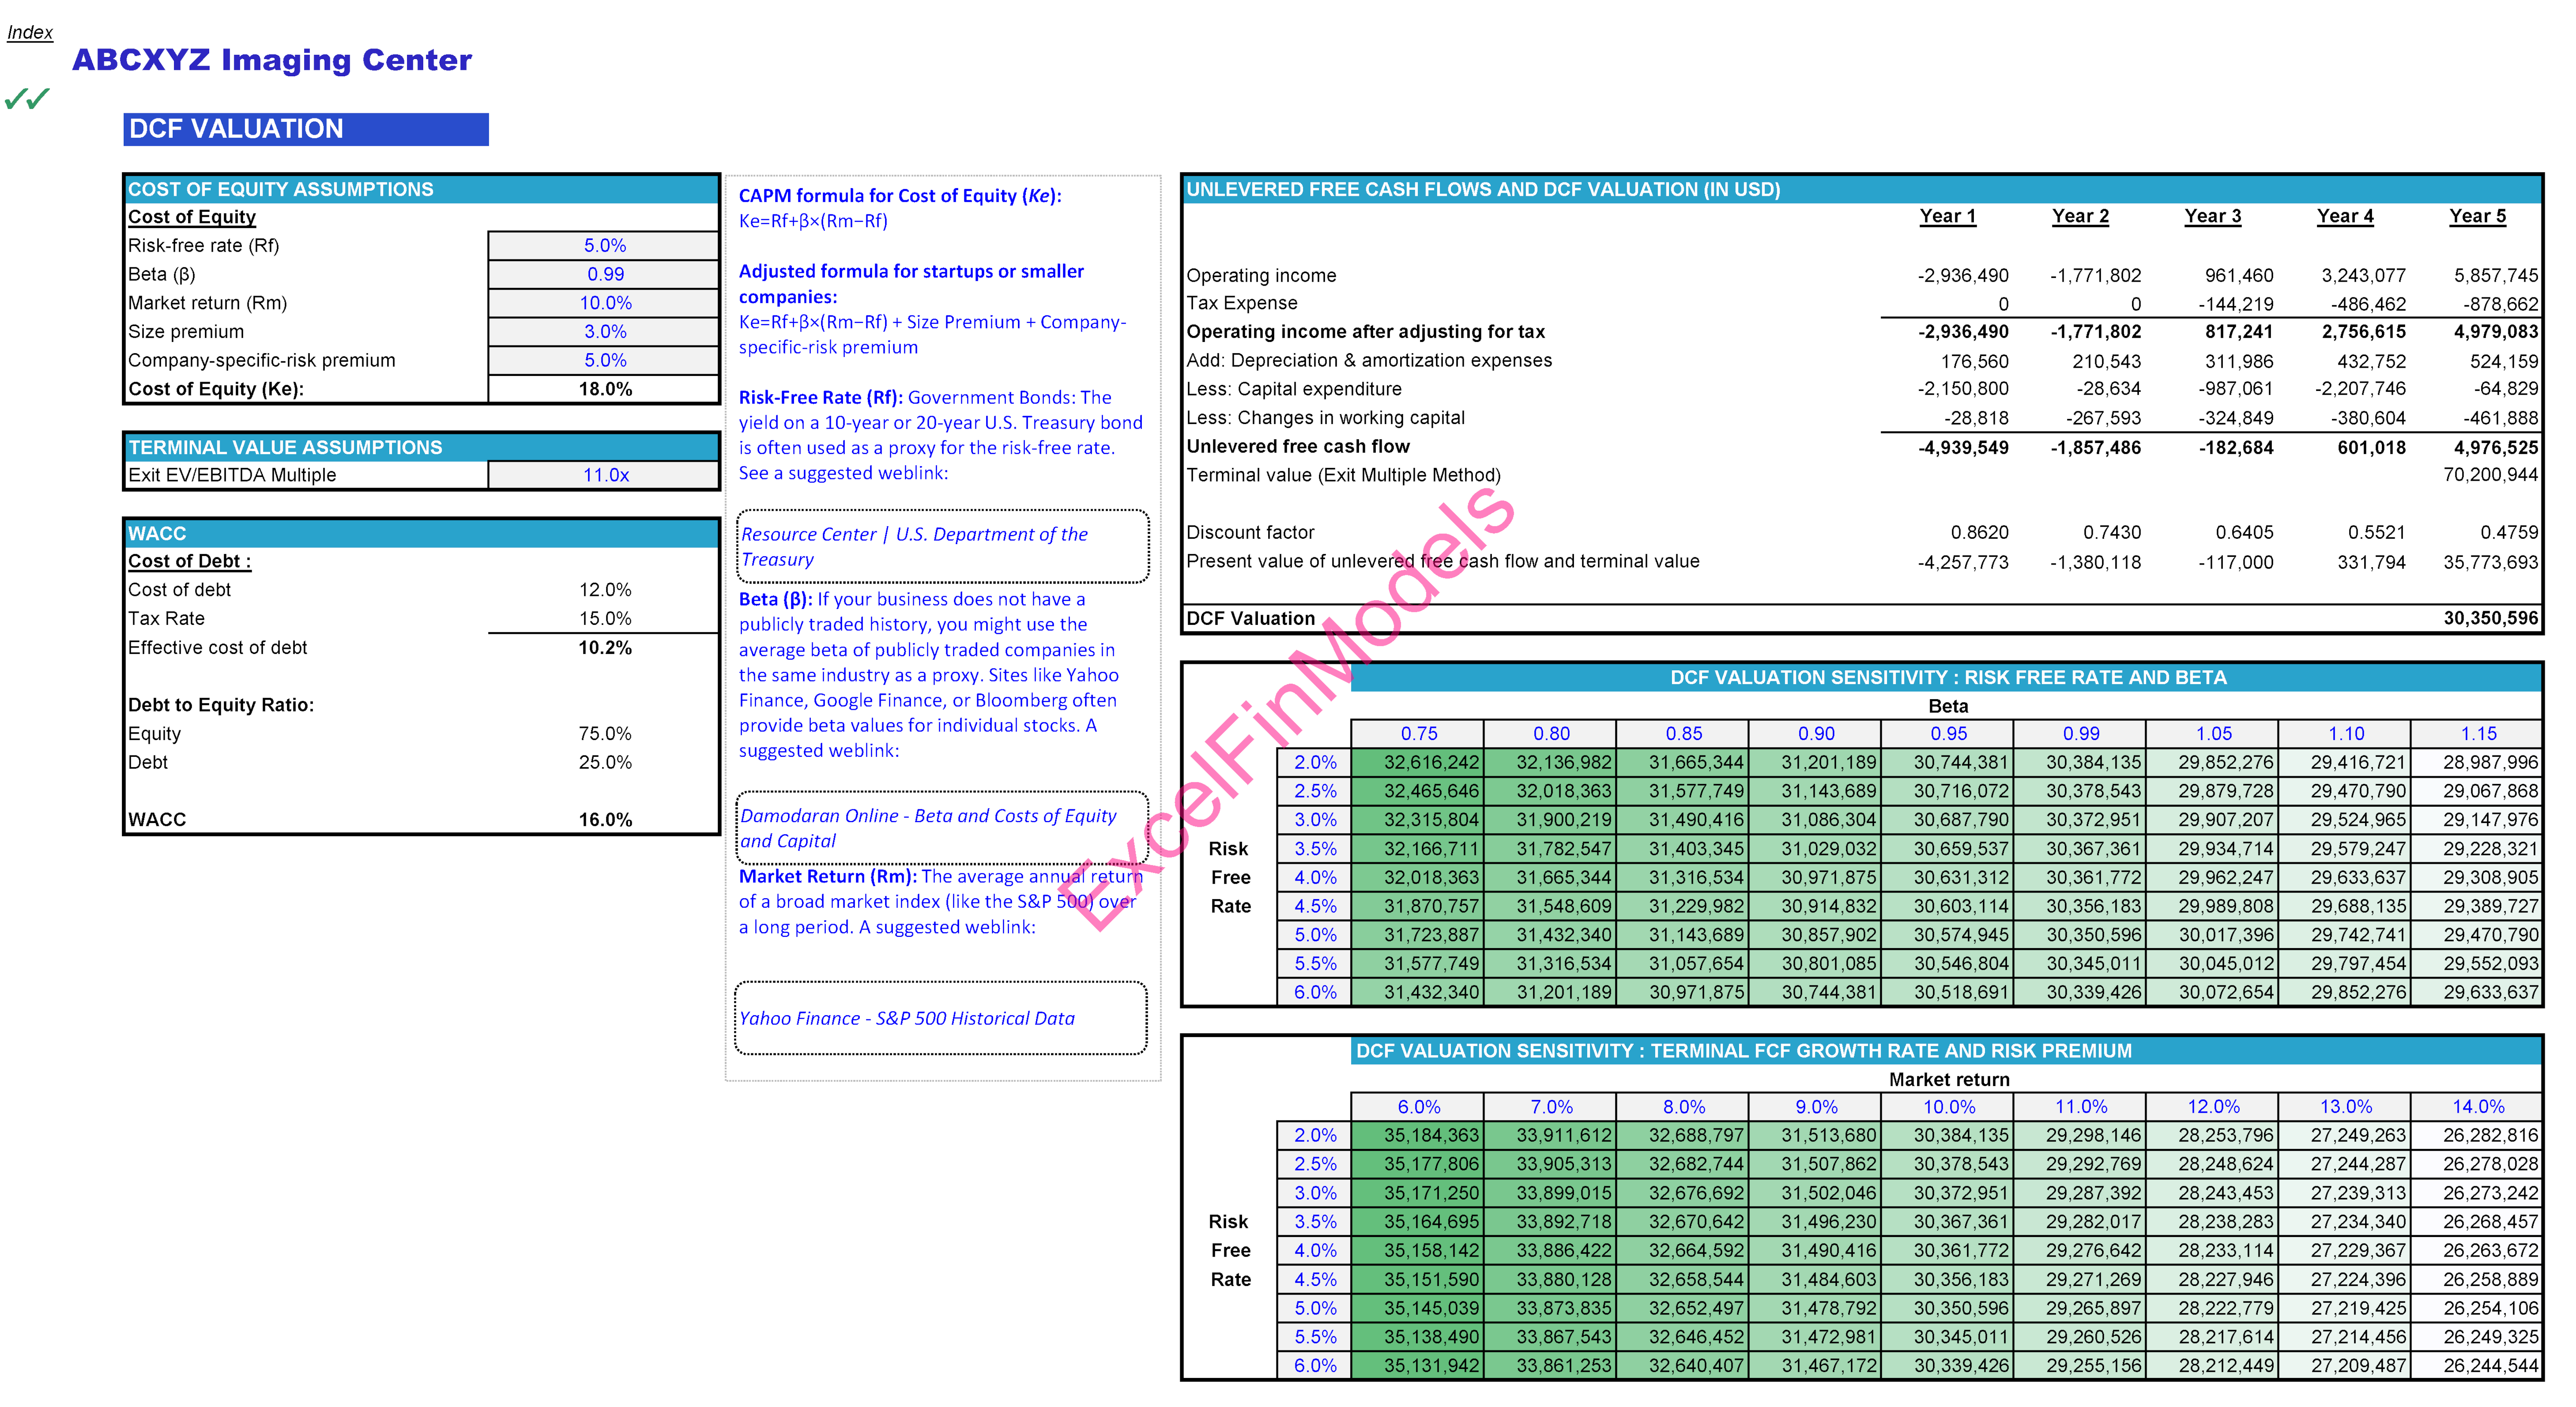
o DCF valuation: It enables you to assess your business's intrinsic value based on unlevered cash flows and terminal value.
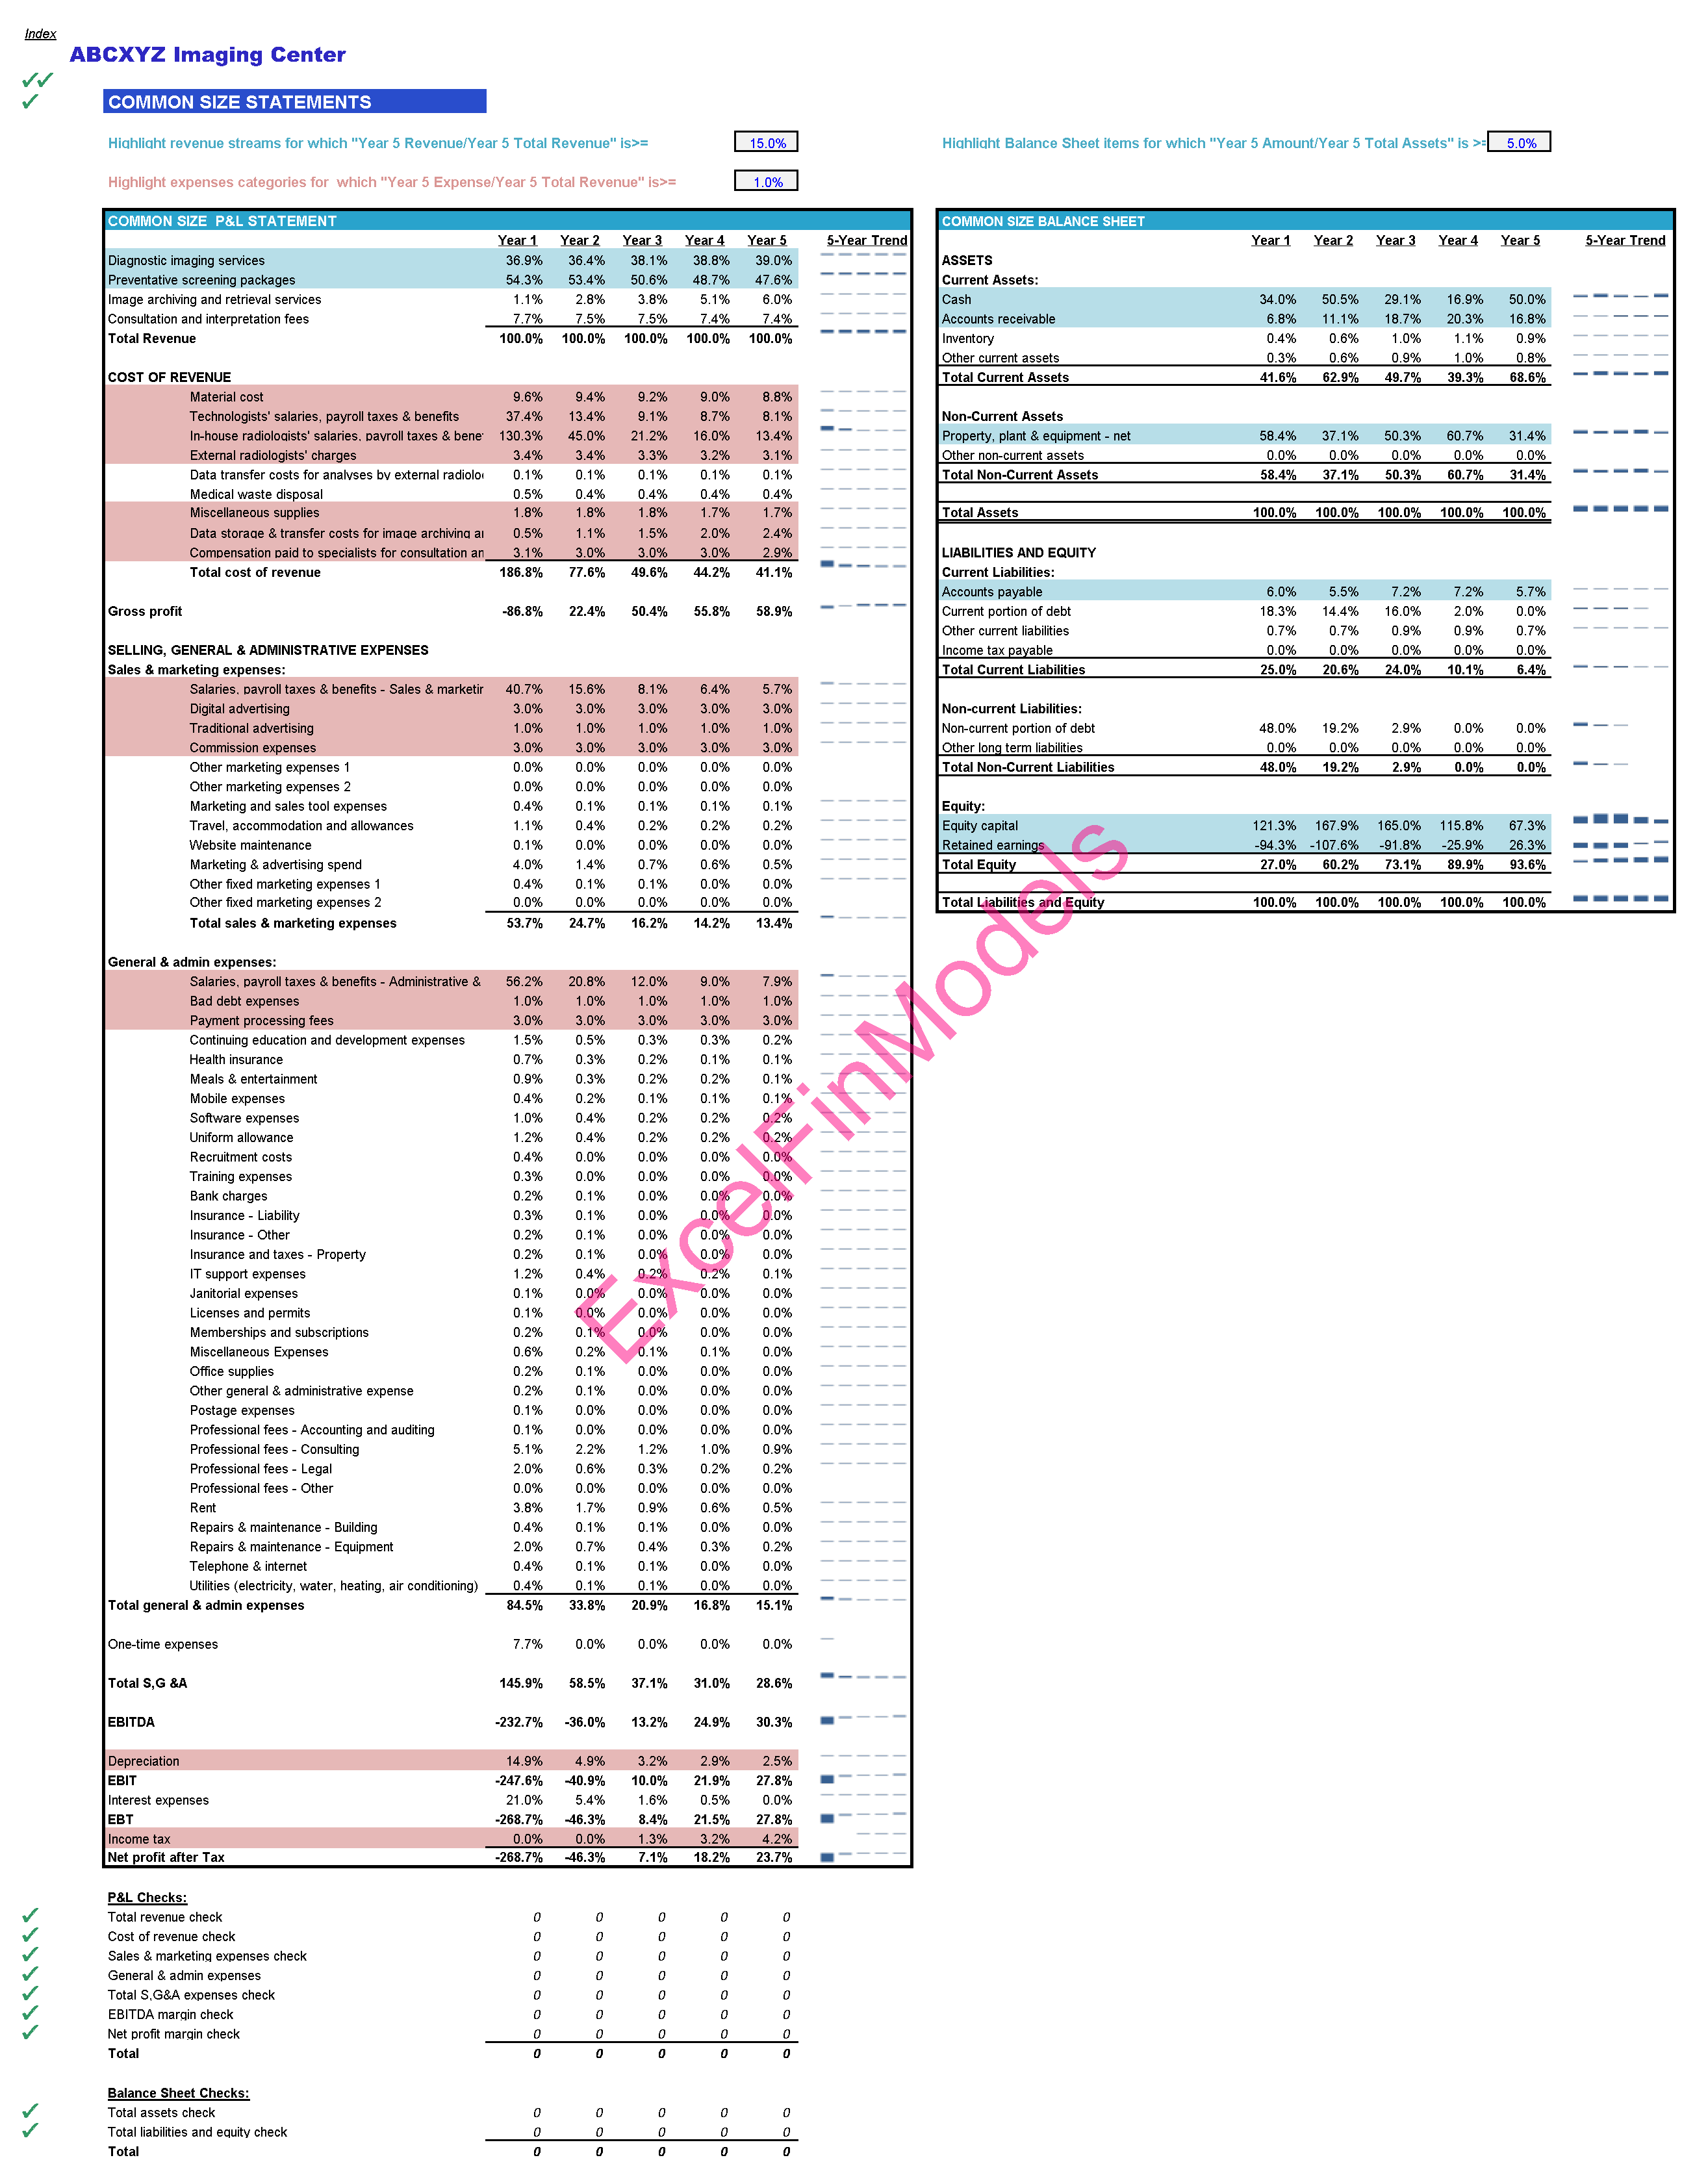
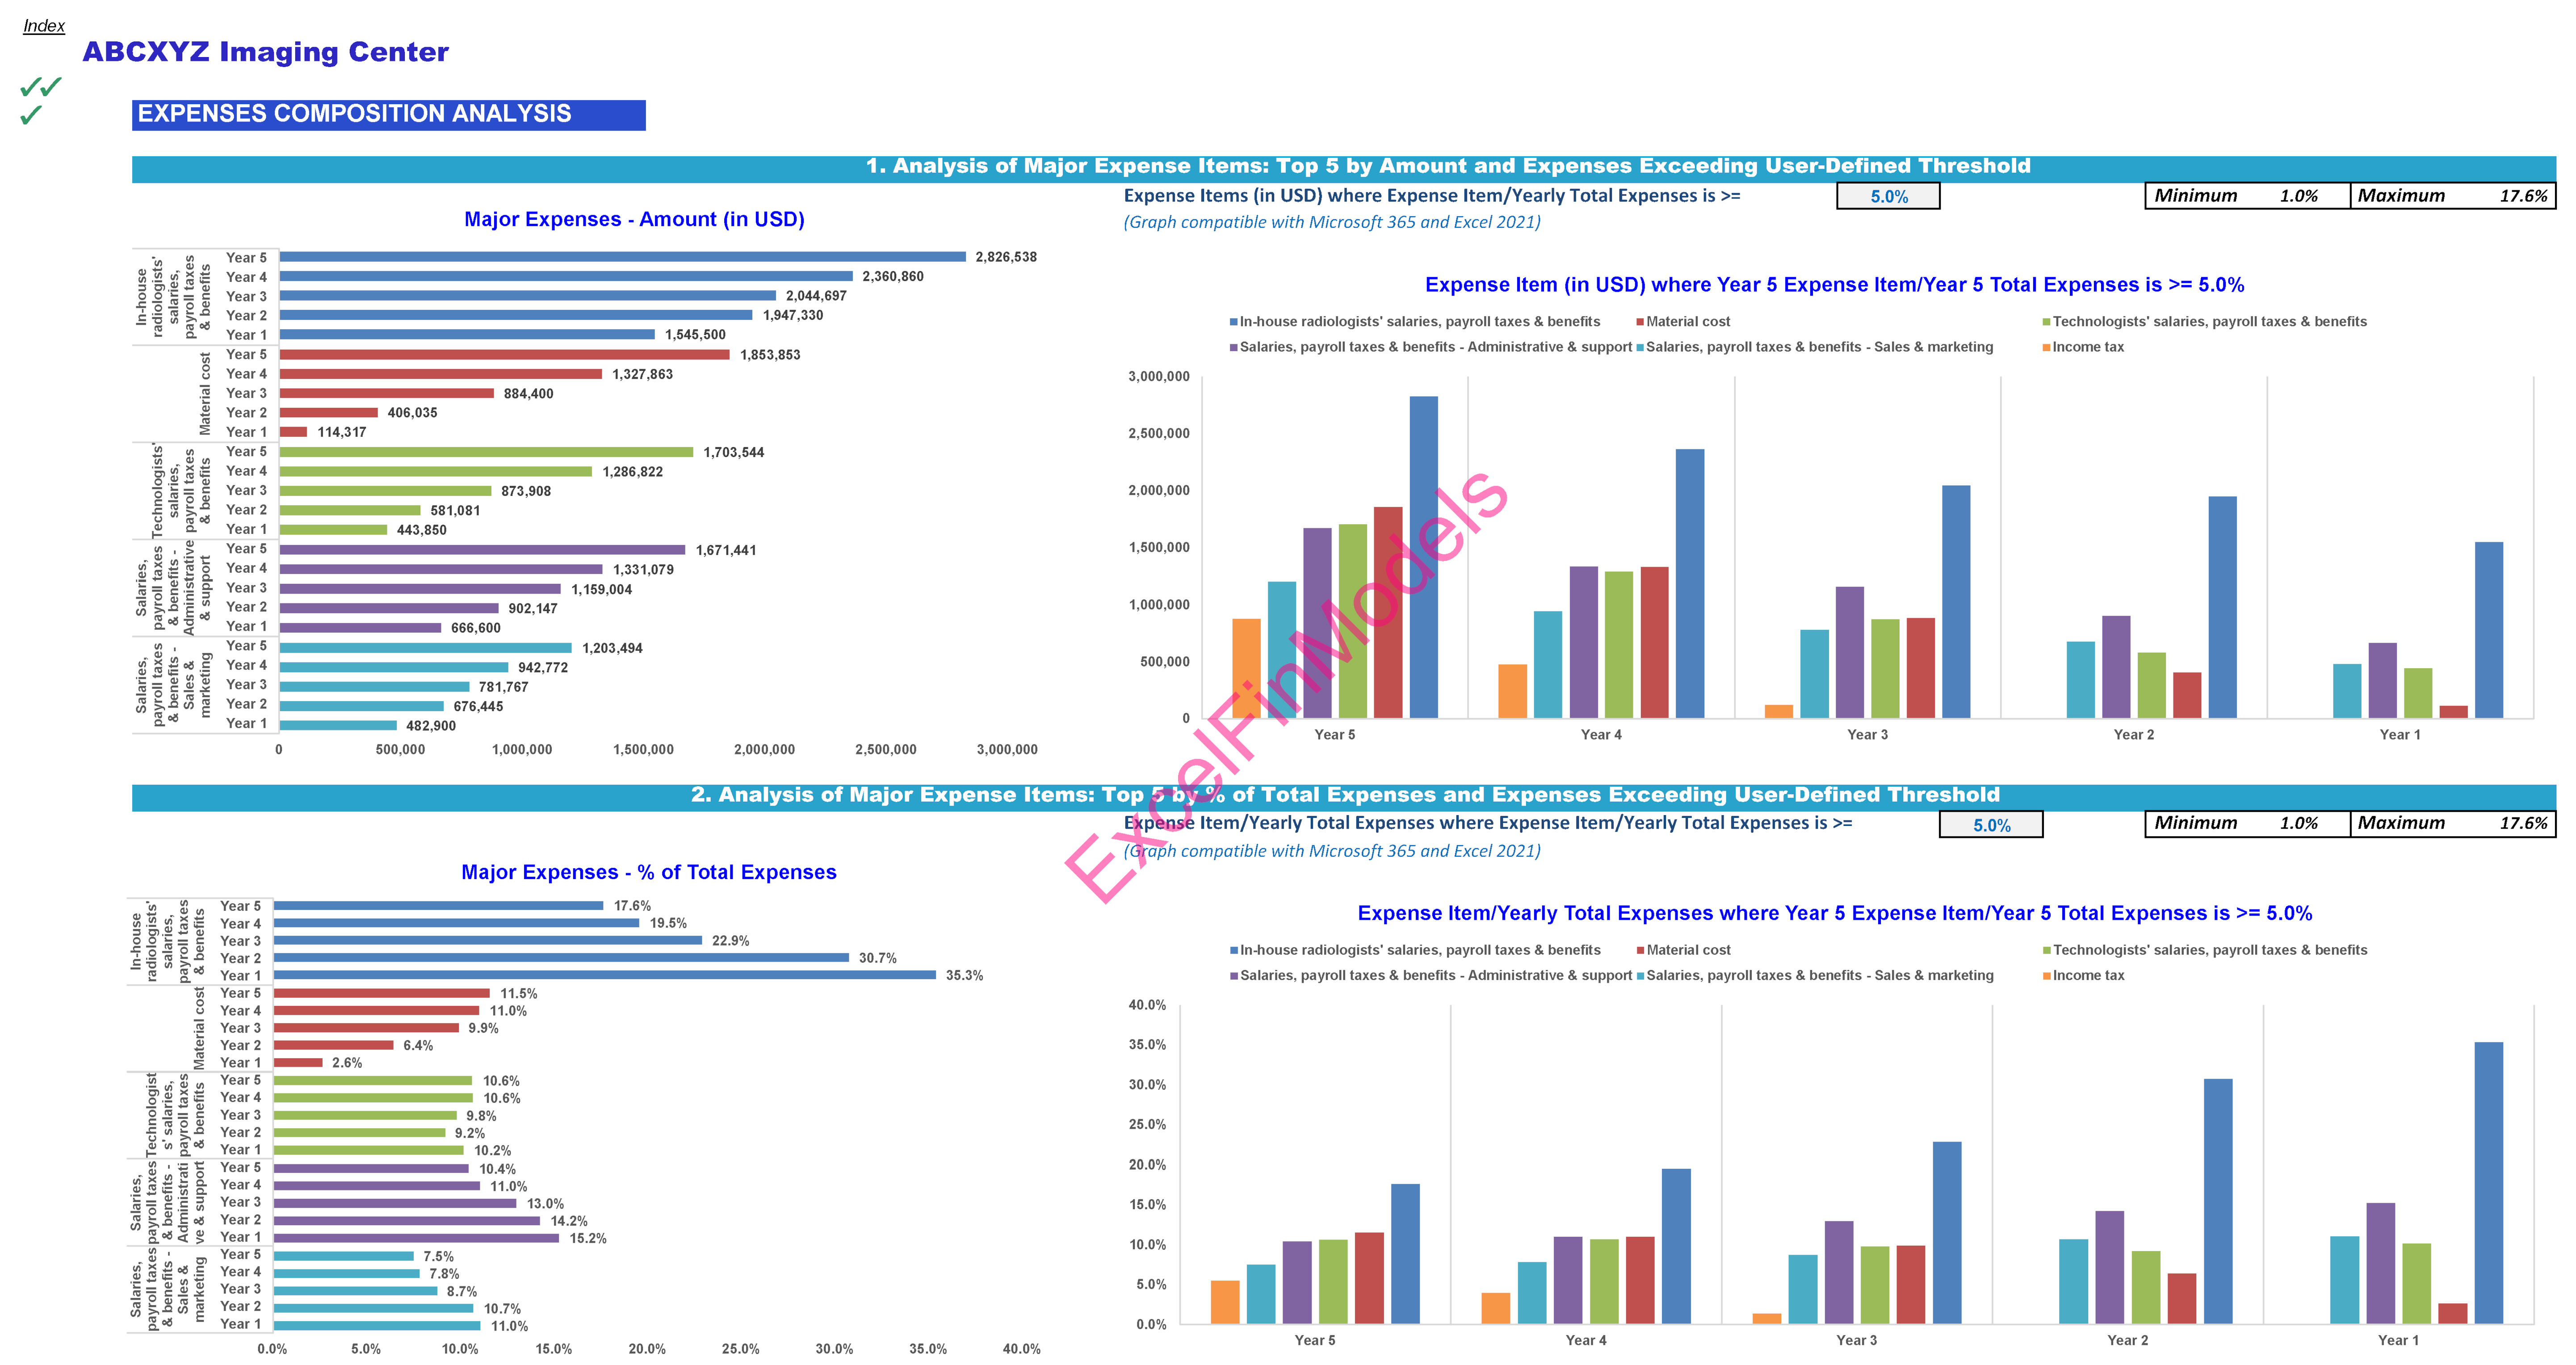
o Common size statements: This tab displays the profit and loss statement and balance sheet as percentages of total revenue and total assets, respectively. A key feature of this tab is the ability for users to set threshold levels for expense items. When these thresholds are exceeded, as indicated by the ratio of an expense item to total revenue, the common size profit and loss statement will automatically highlight those expense items.
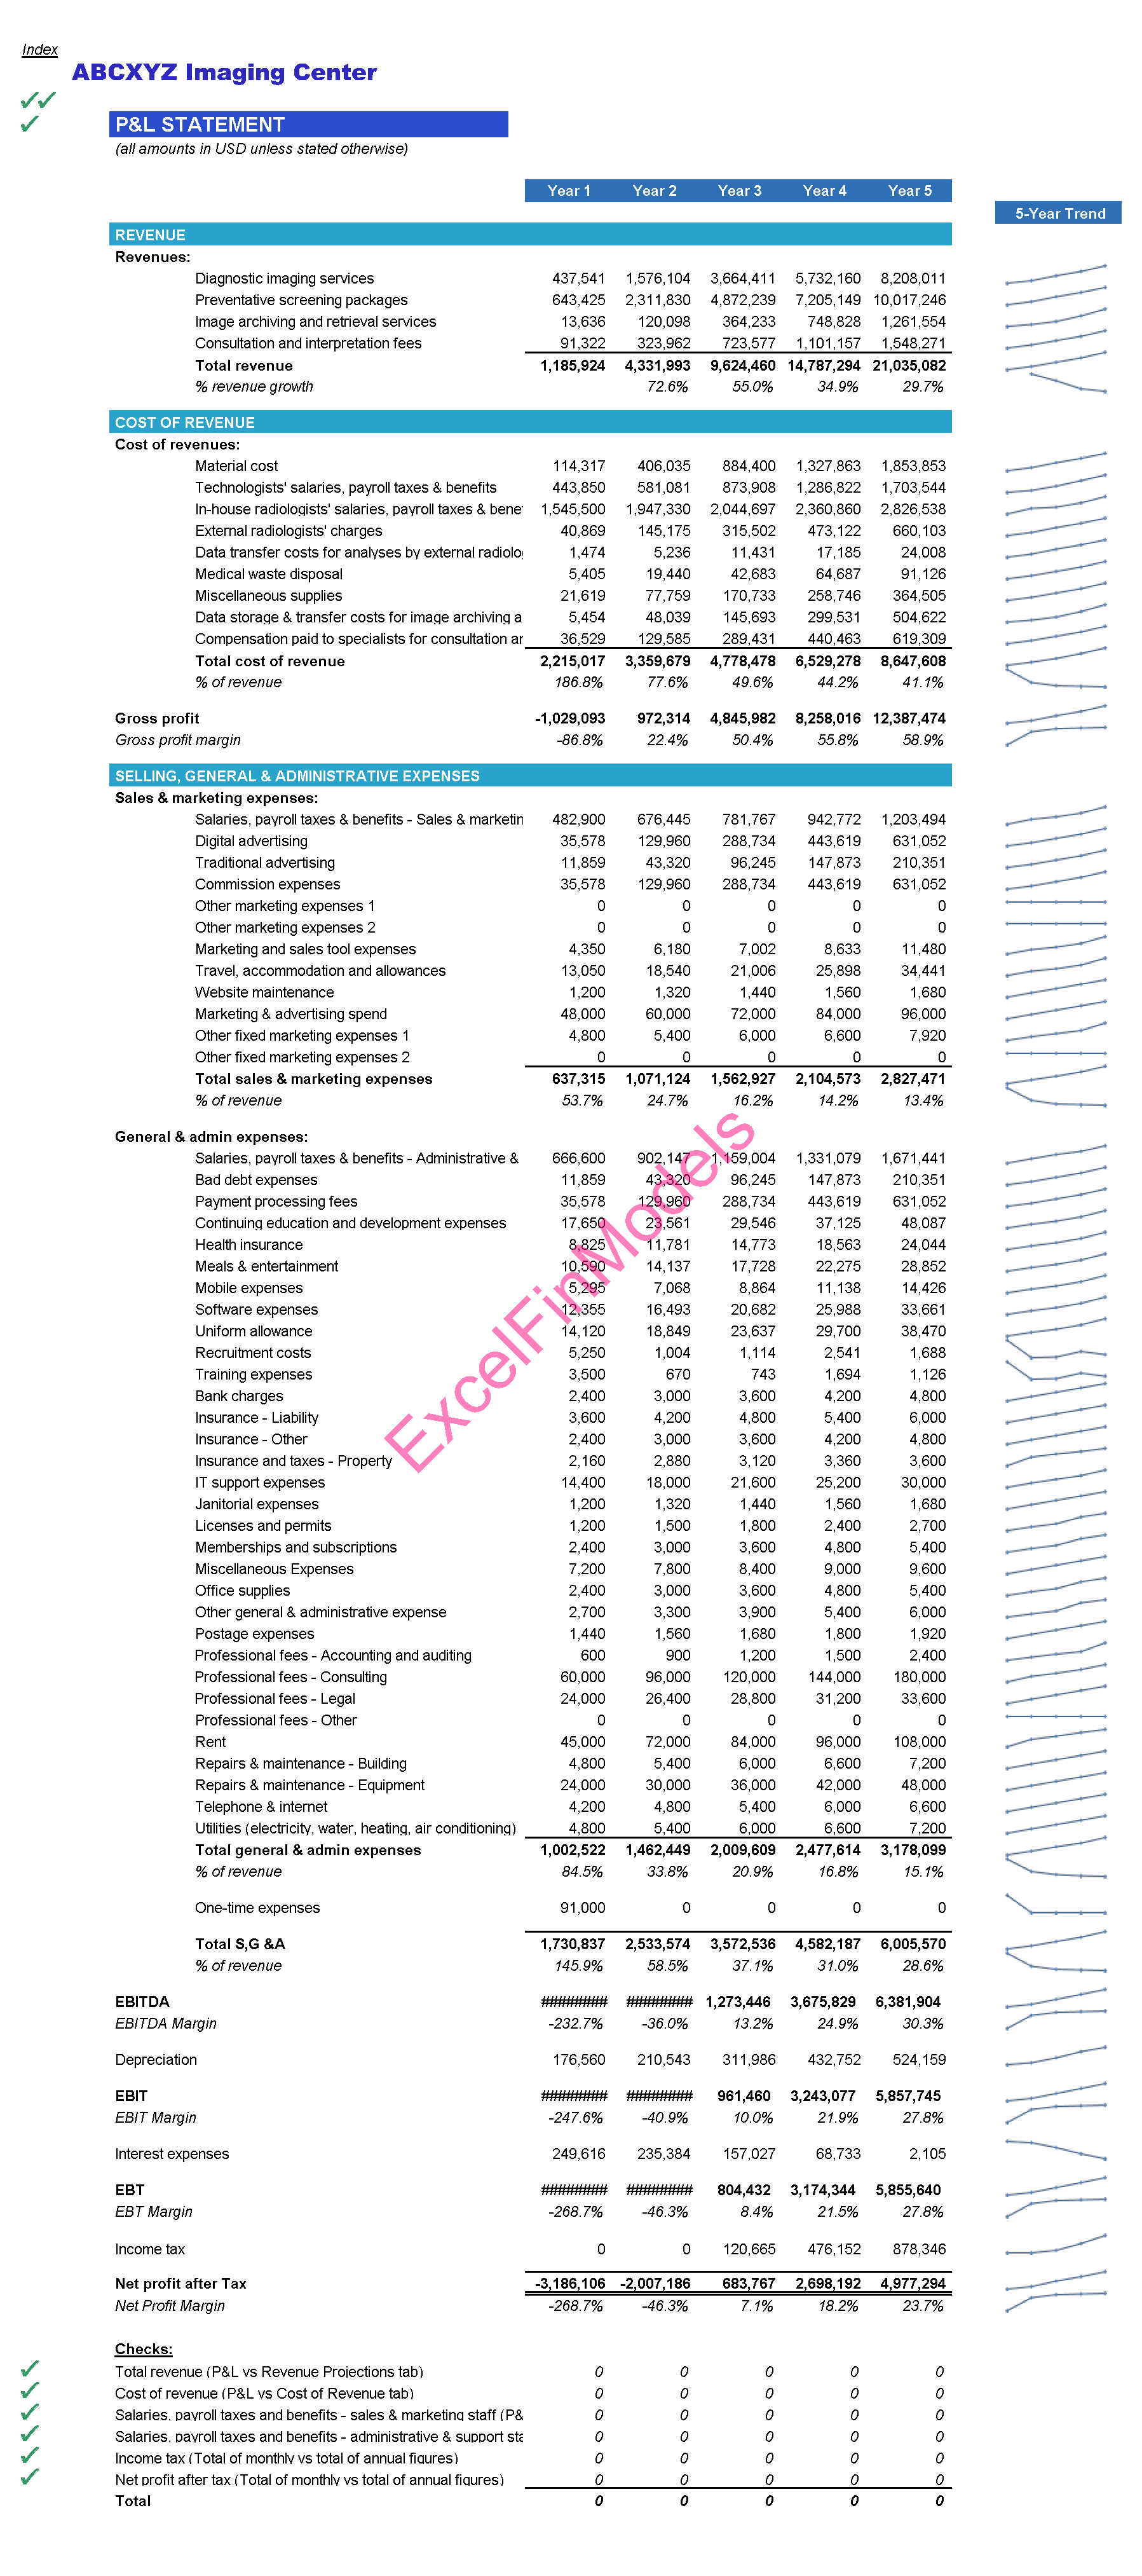
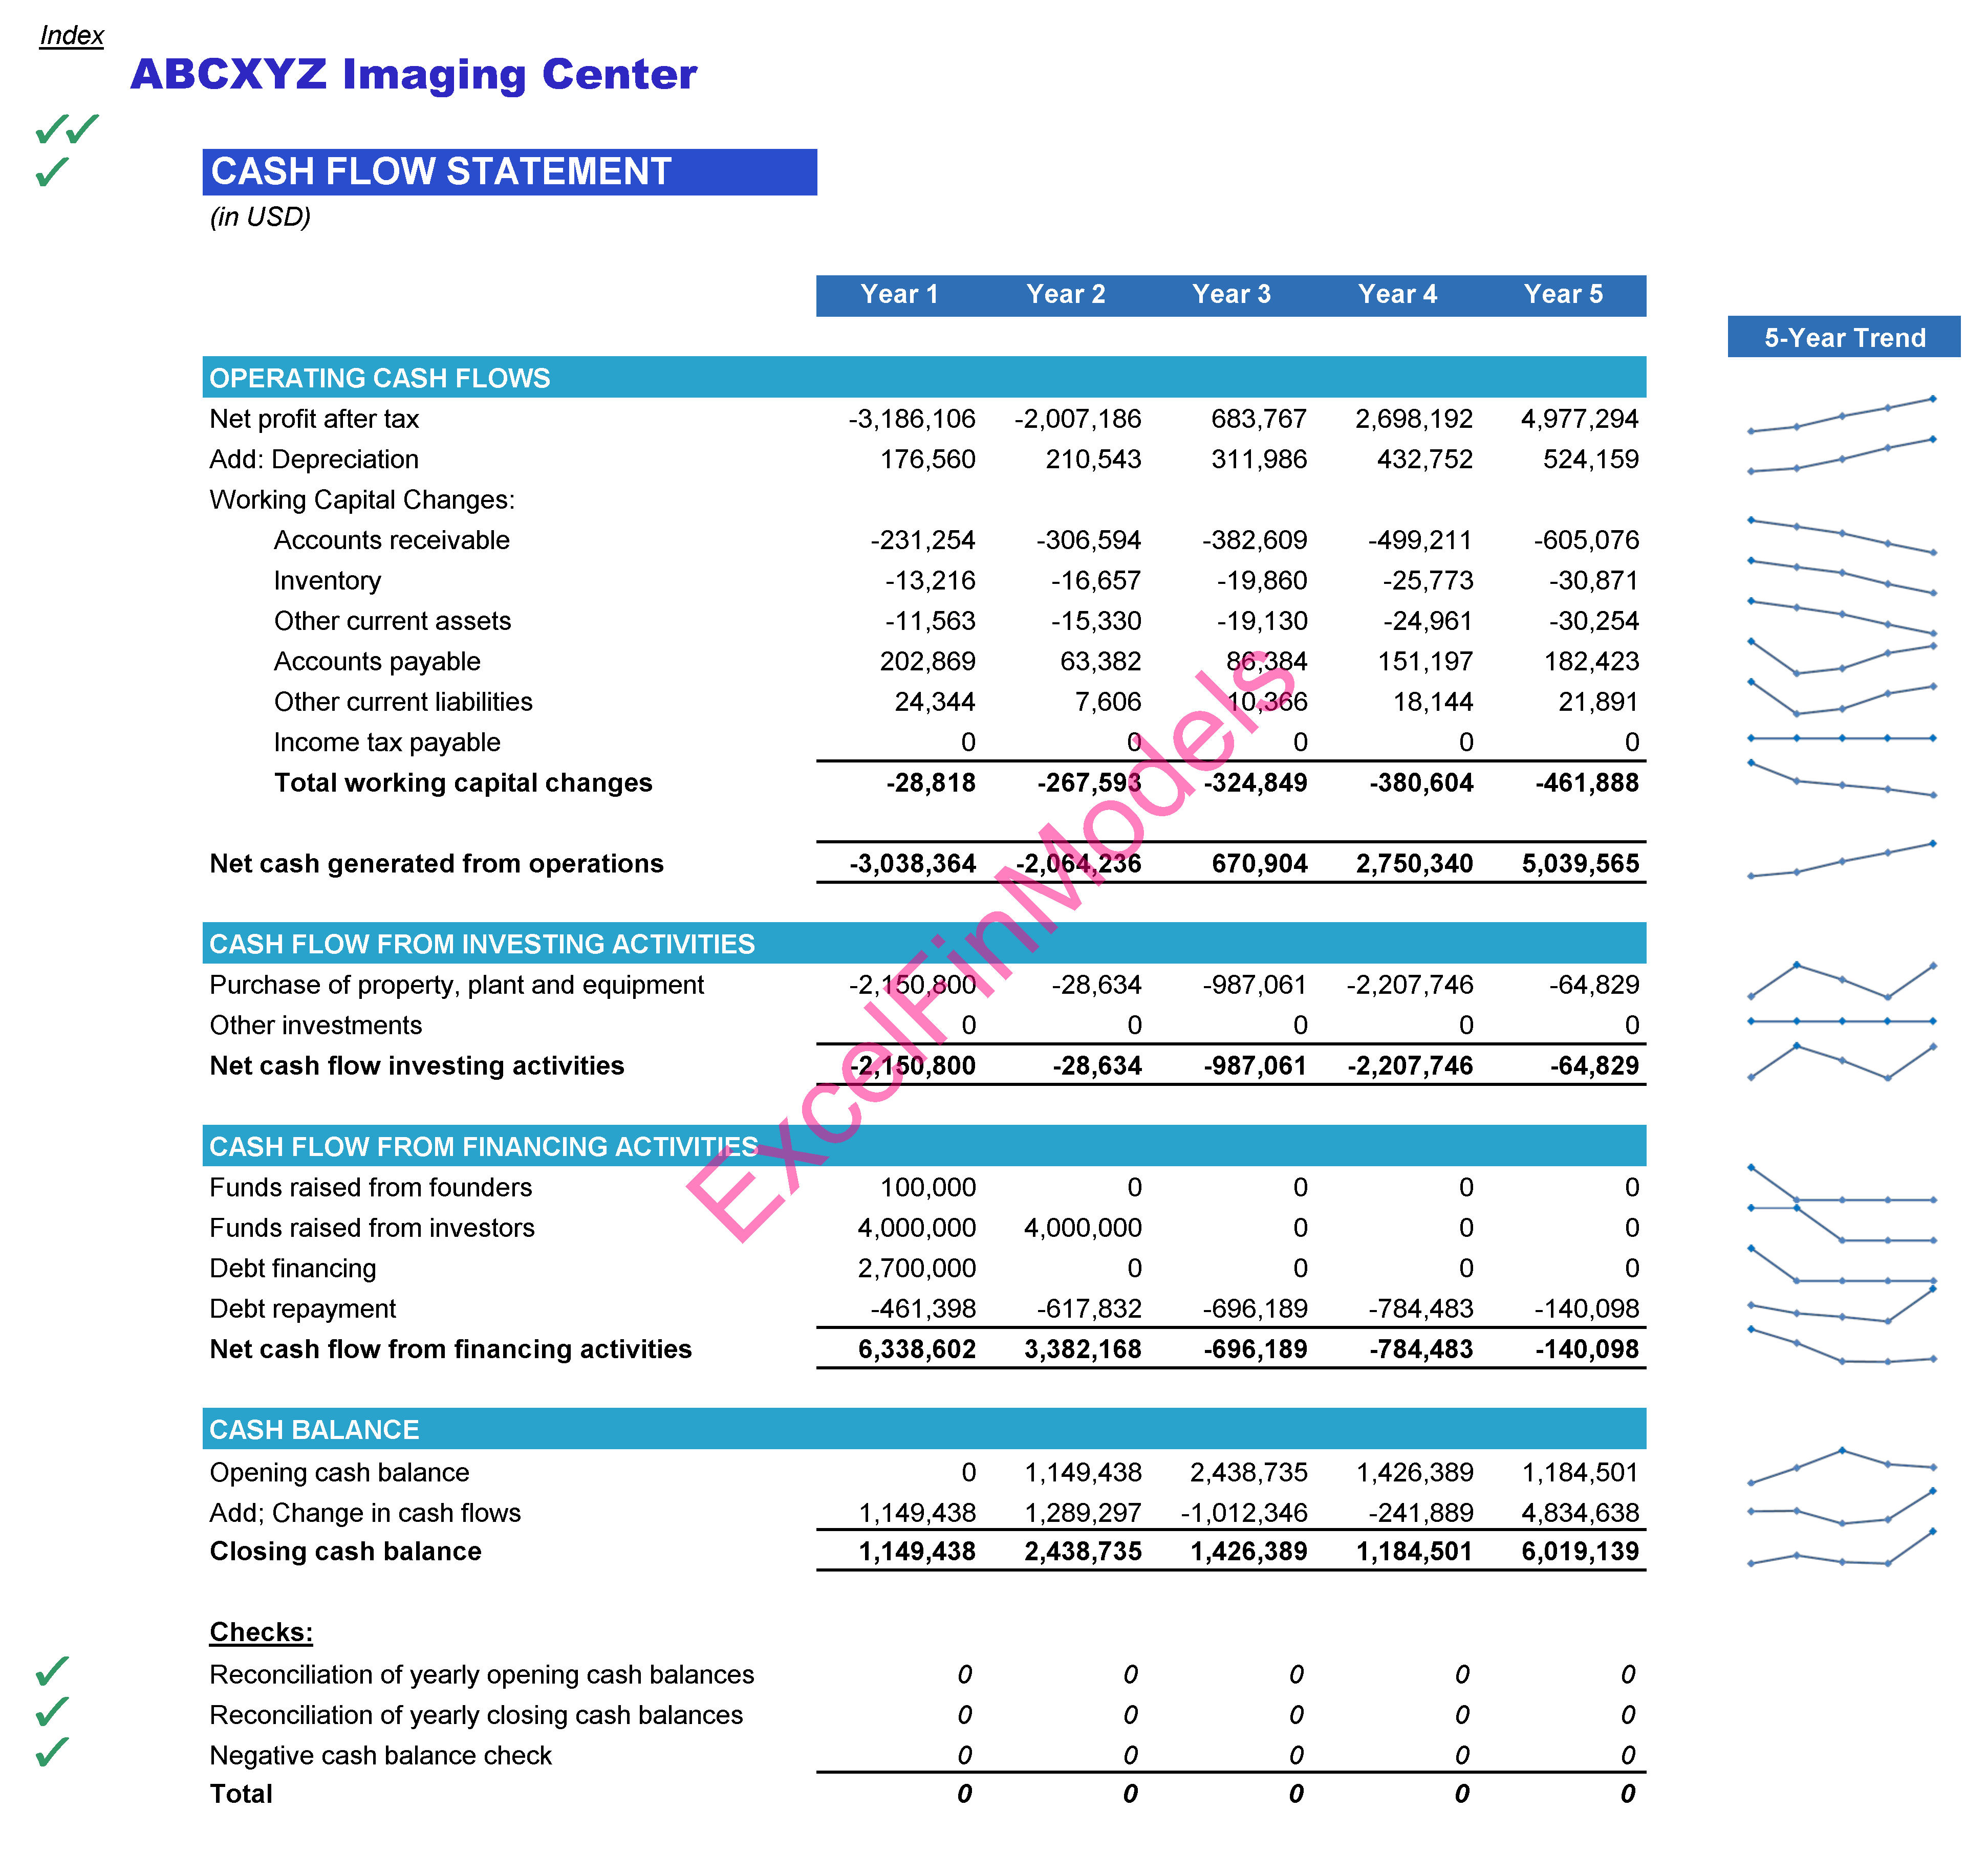
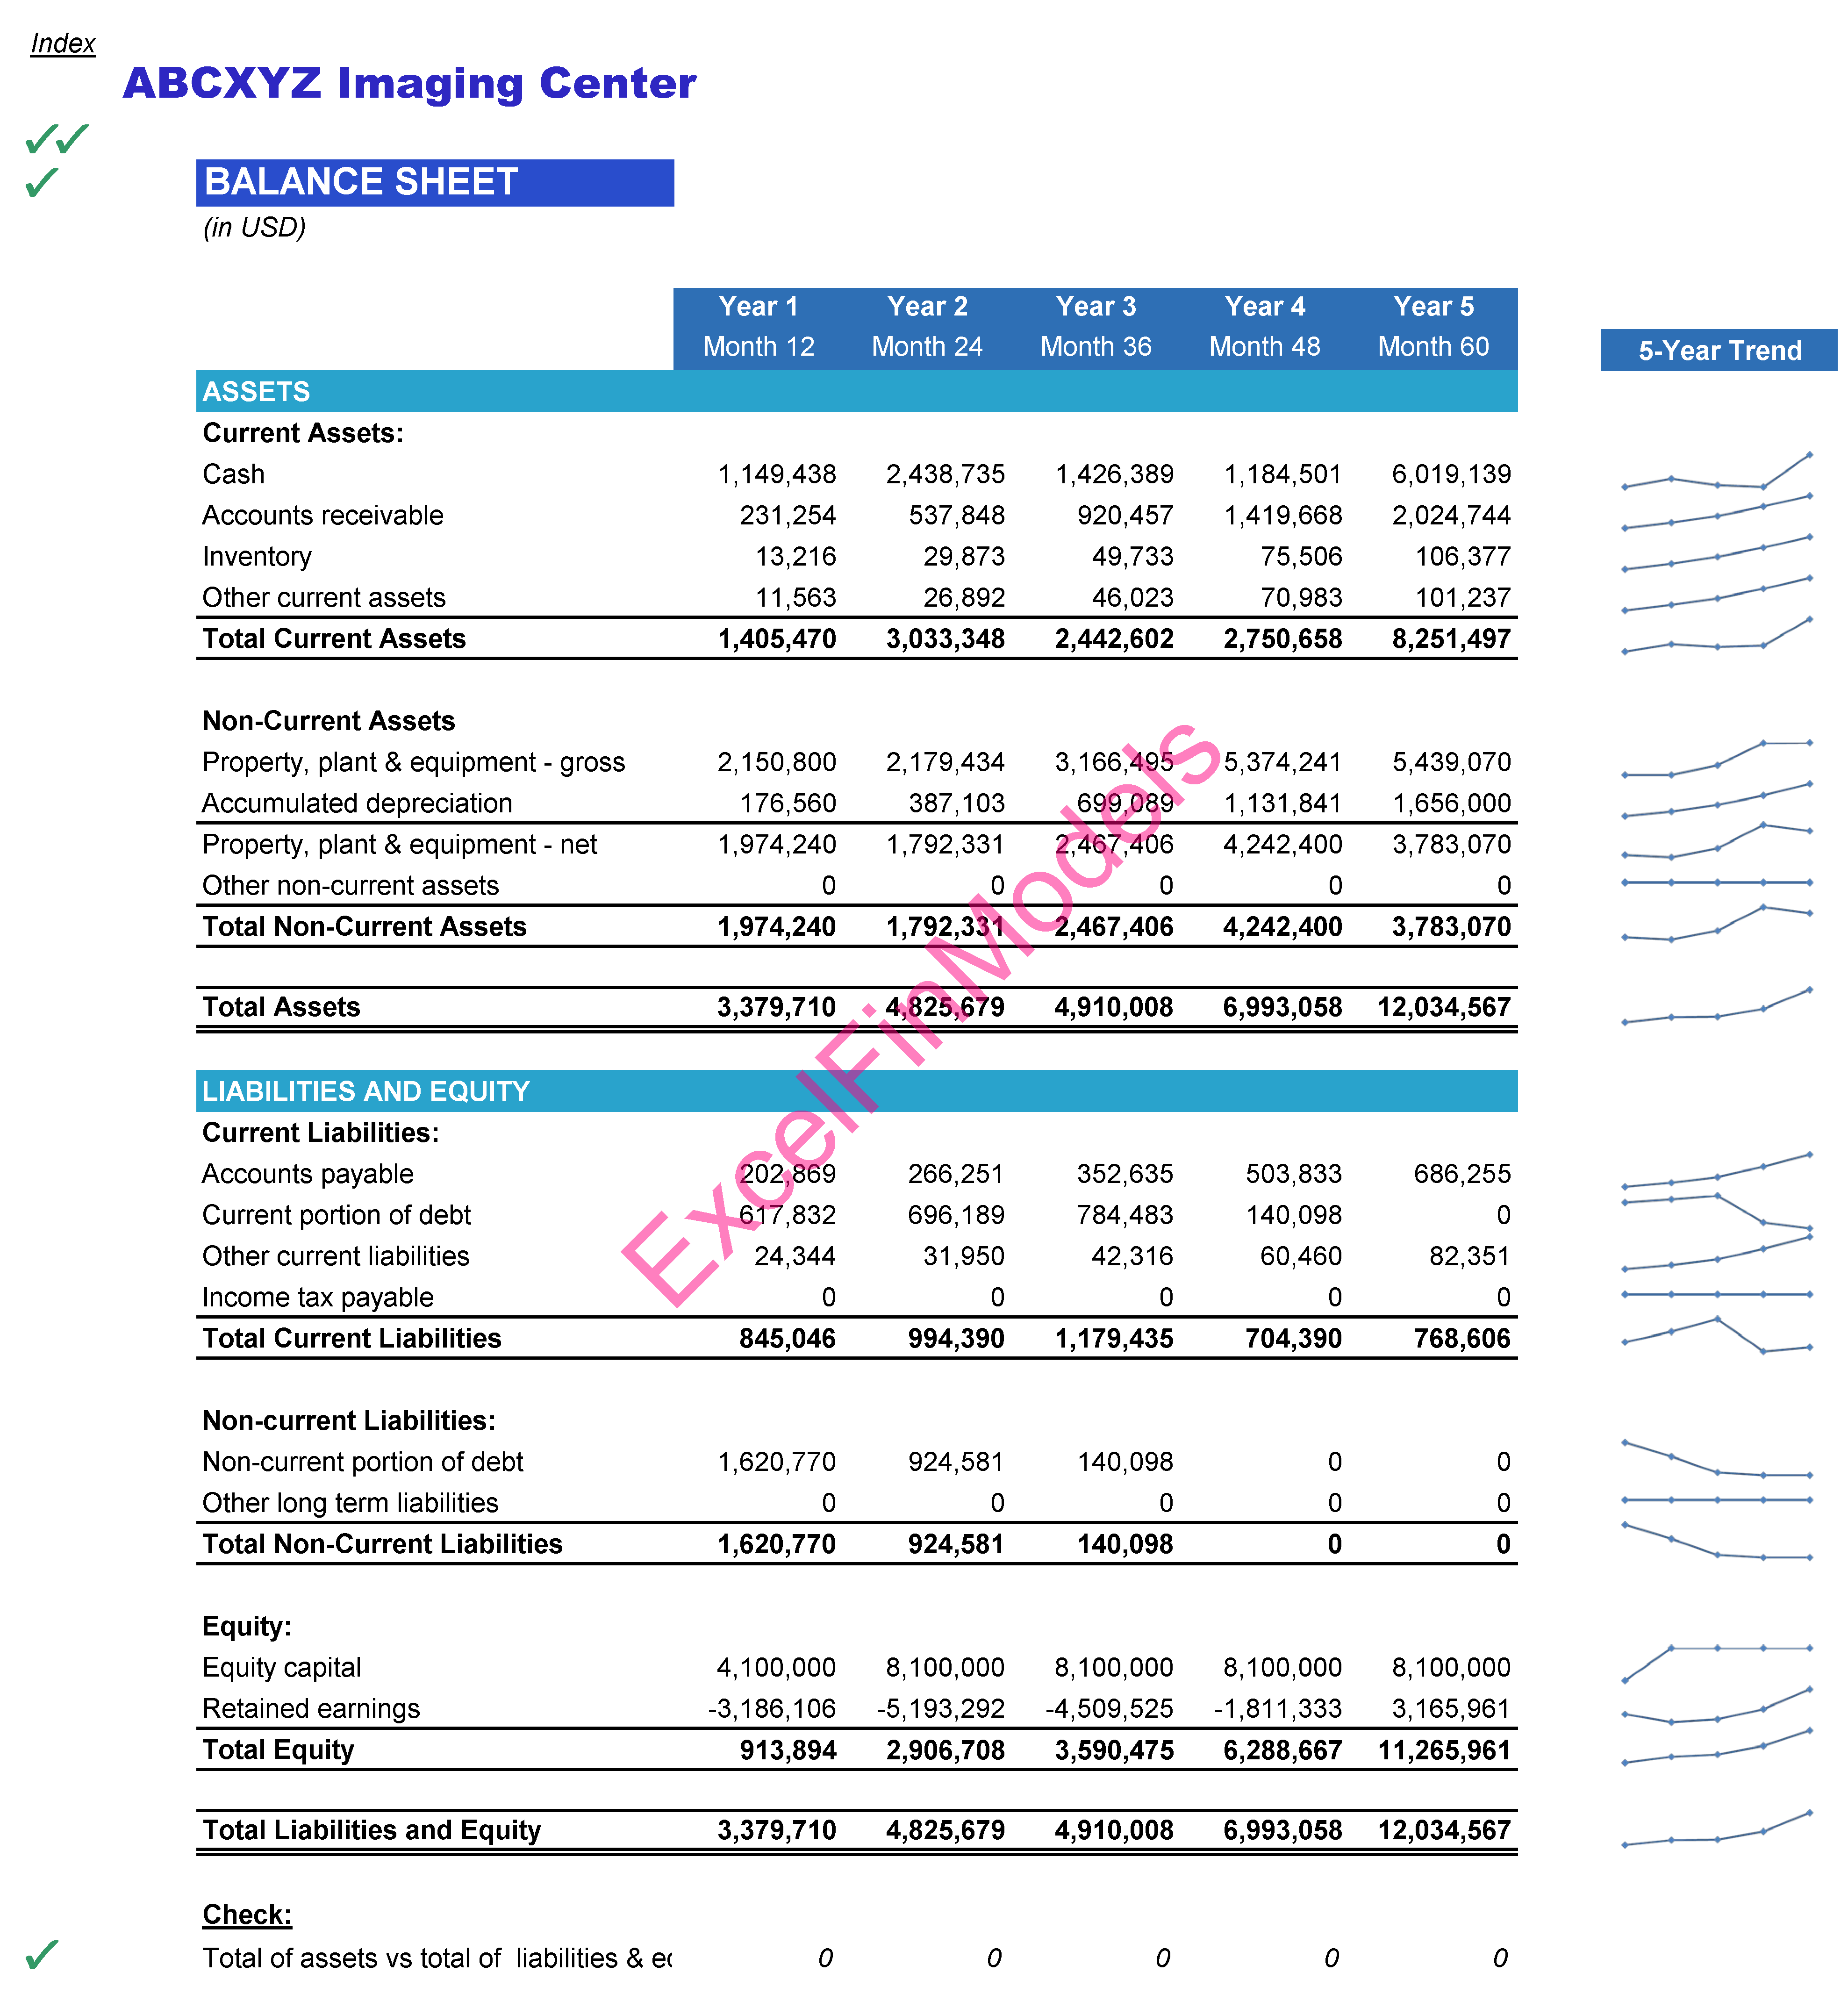
4. Financial Statements Tab: The Financial Statements tab in the business's financial model provides a comprehensive representation of the company's financial performance and position over a five-year period. It consolidates crucial information through:
o Monthly and annual profit & loss statement,
o Monthly and annual balance sheet
o Monthly and annual cash flow statement
These tabs serve as the cornerstone for decision-making, offering a holistic view of the business's revenues, expenses, assets, liabilities, and cash flows on a monthly basis. They enable the management team and stakeholders to analyze trends, make informed strategic choices, and ensure the long-term financial health and sustainability of the business.
5. Calculation Tabs: The calculations tabs section within the business's financial model serves as the backbone for the financial statements, offering detailed and granular calculations for key financial line items essential for accurate forecasting and planning. These tabs include:
o Revenue projections
o Cost of revenue
o Staffing expenses
o Capex (Capital expenditure)
o Debt Amortization
o Income Tax
6. Graphs Tabs: The Graphs Tabs section in our financial model represents a dynamic and visually insightful dimension of our financial analysis toolkit. This section includes a suite of tabs, each designed to provide a comprehensive overview of the business’s operating and financial performance. The graphs tab include:
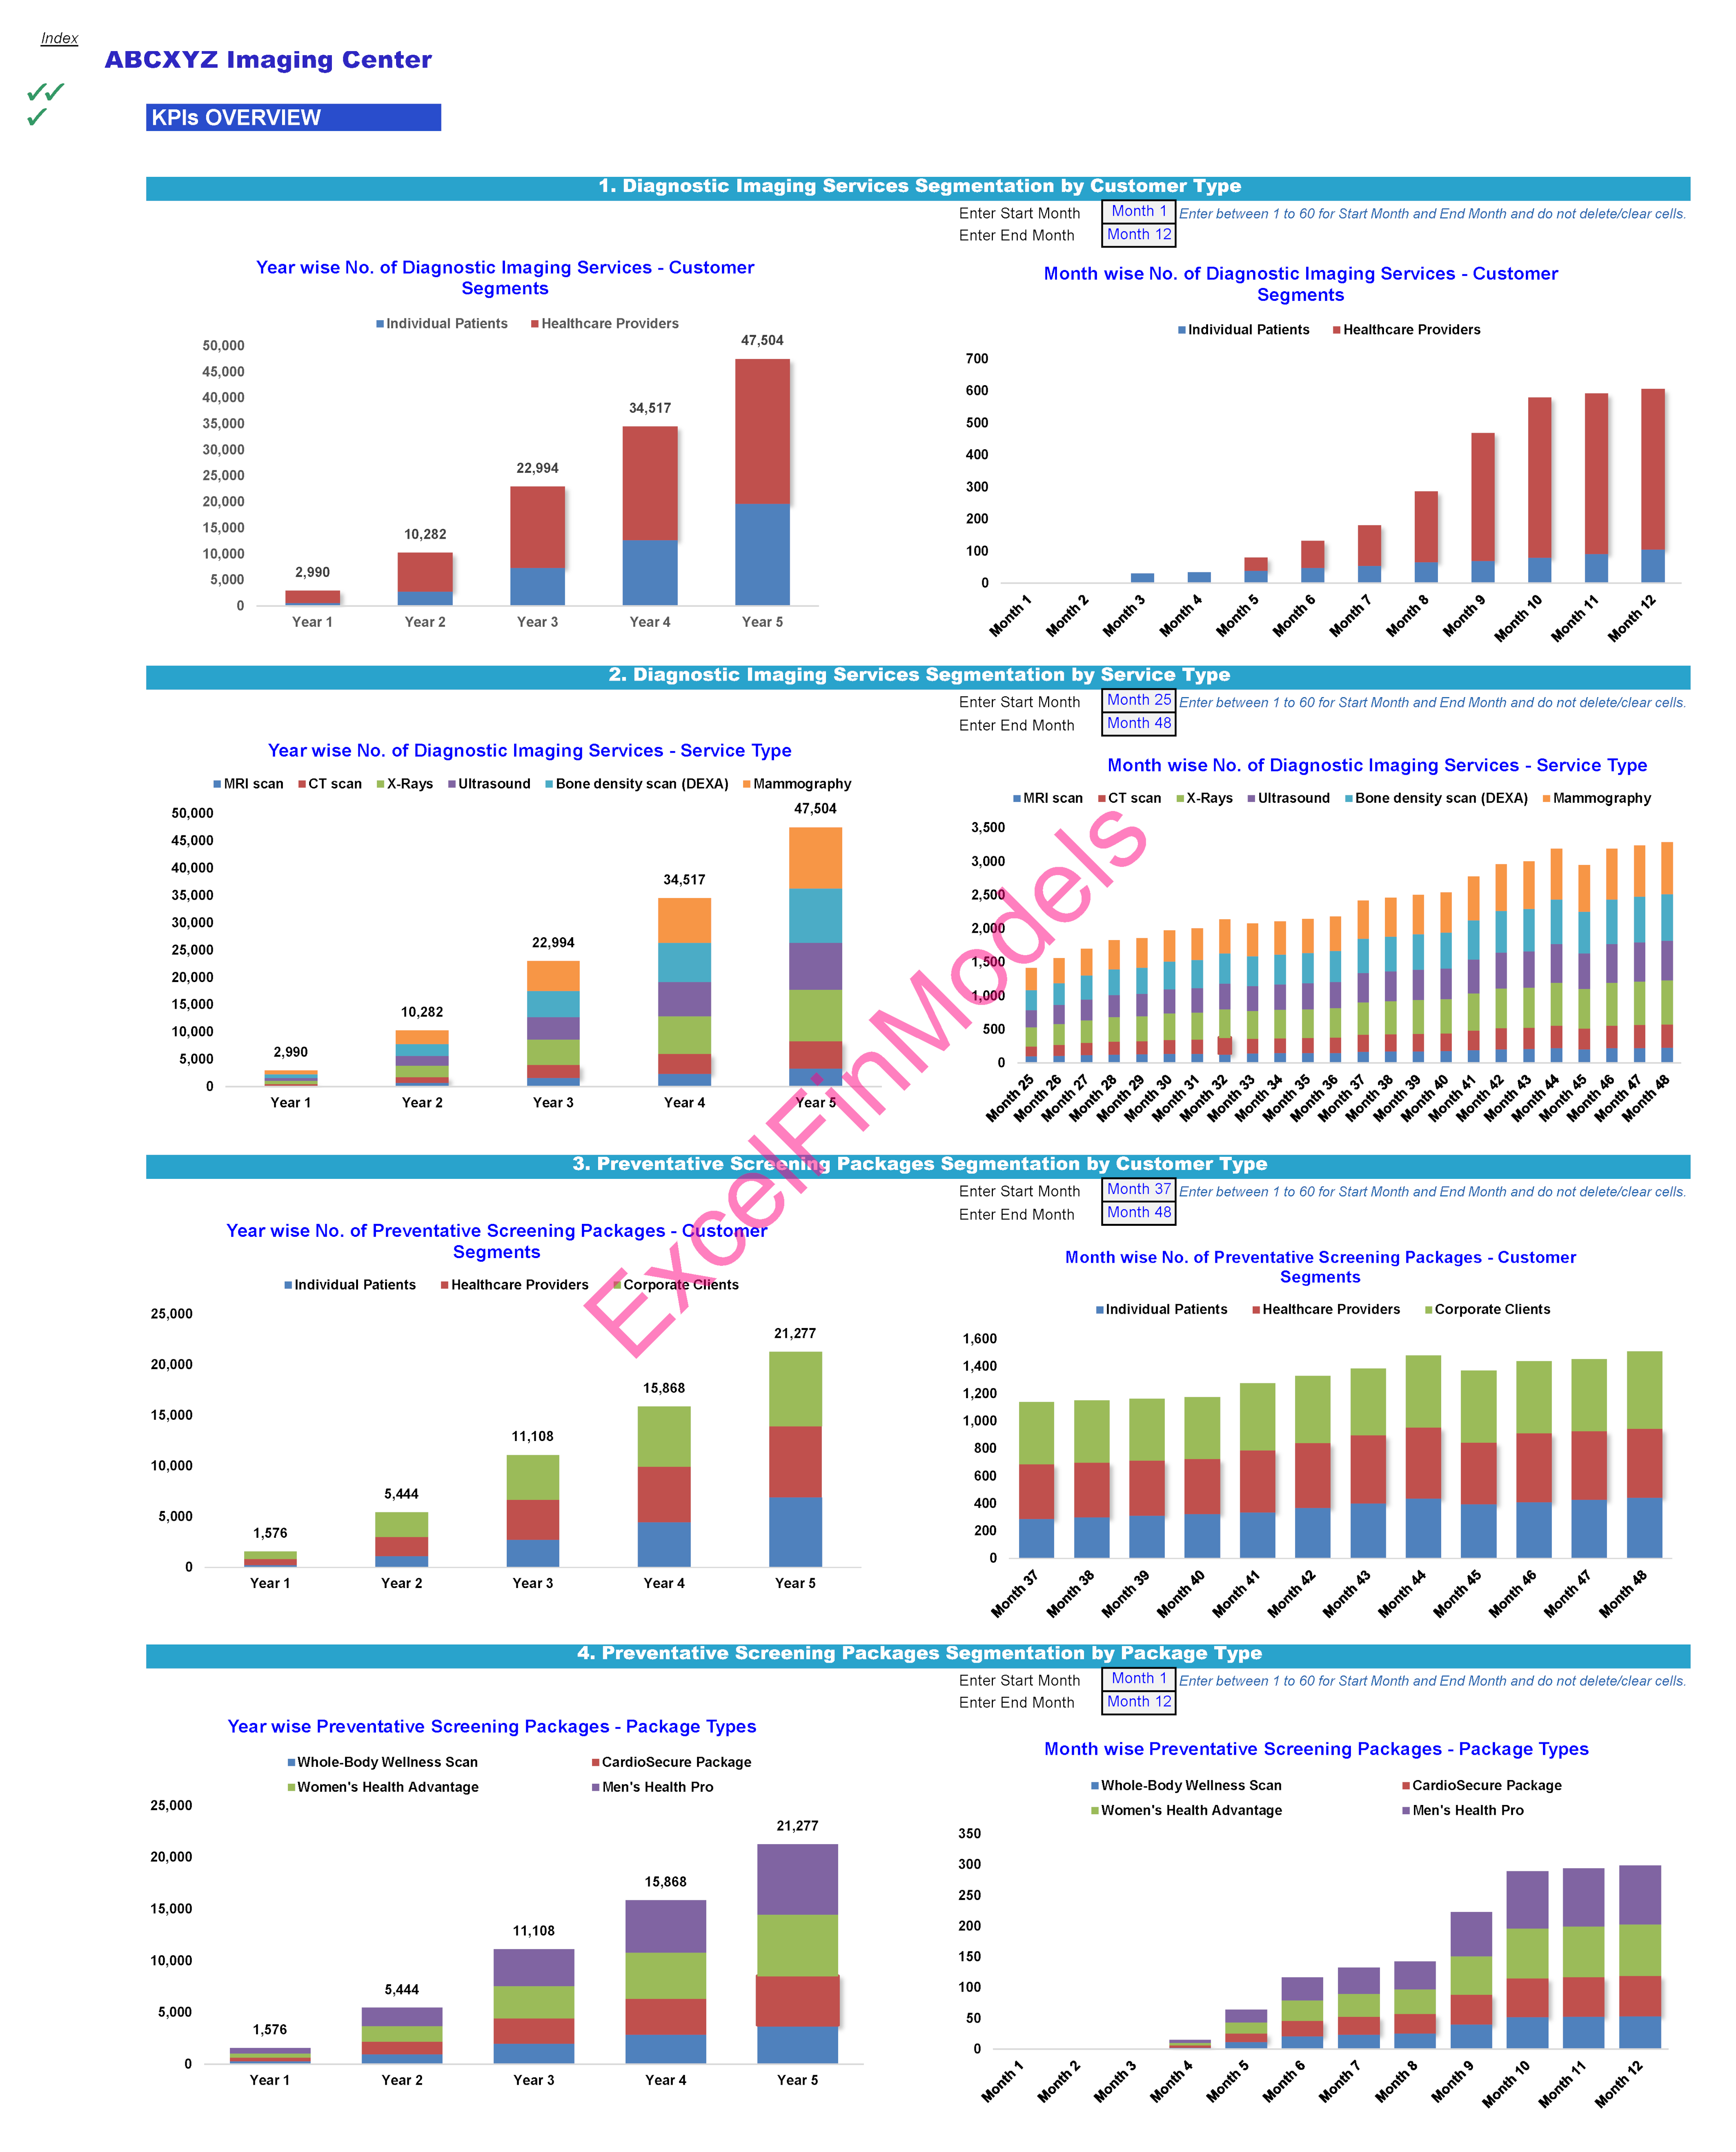
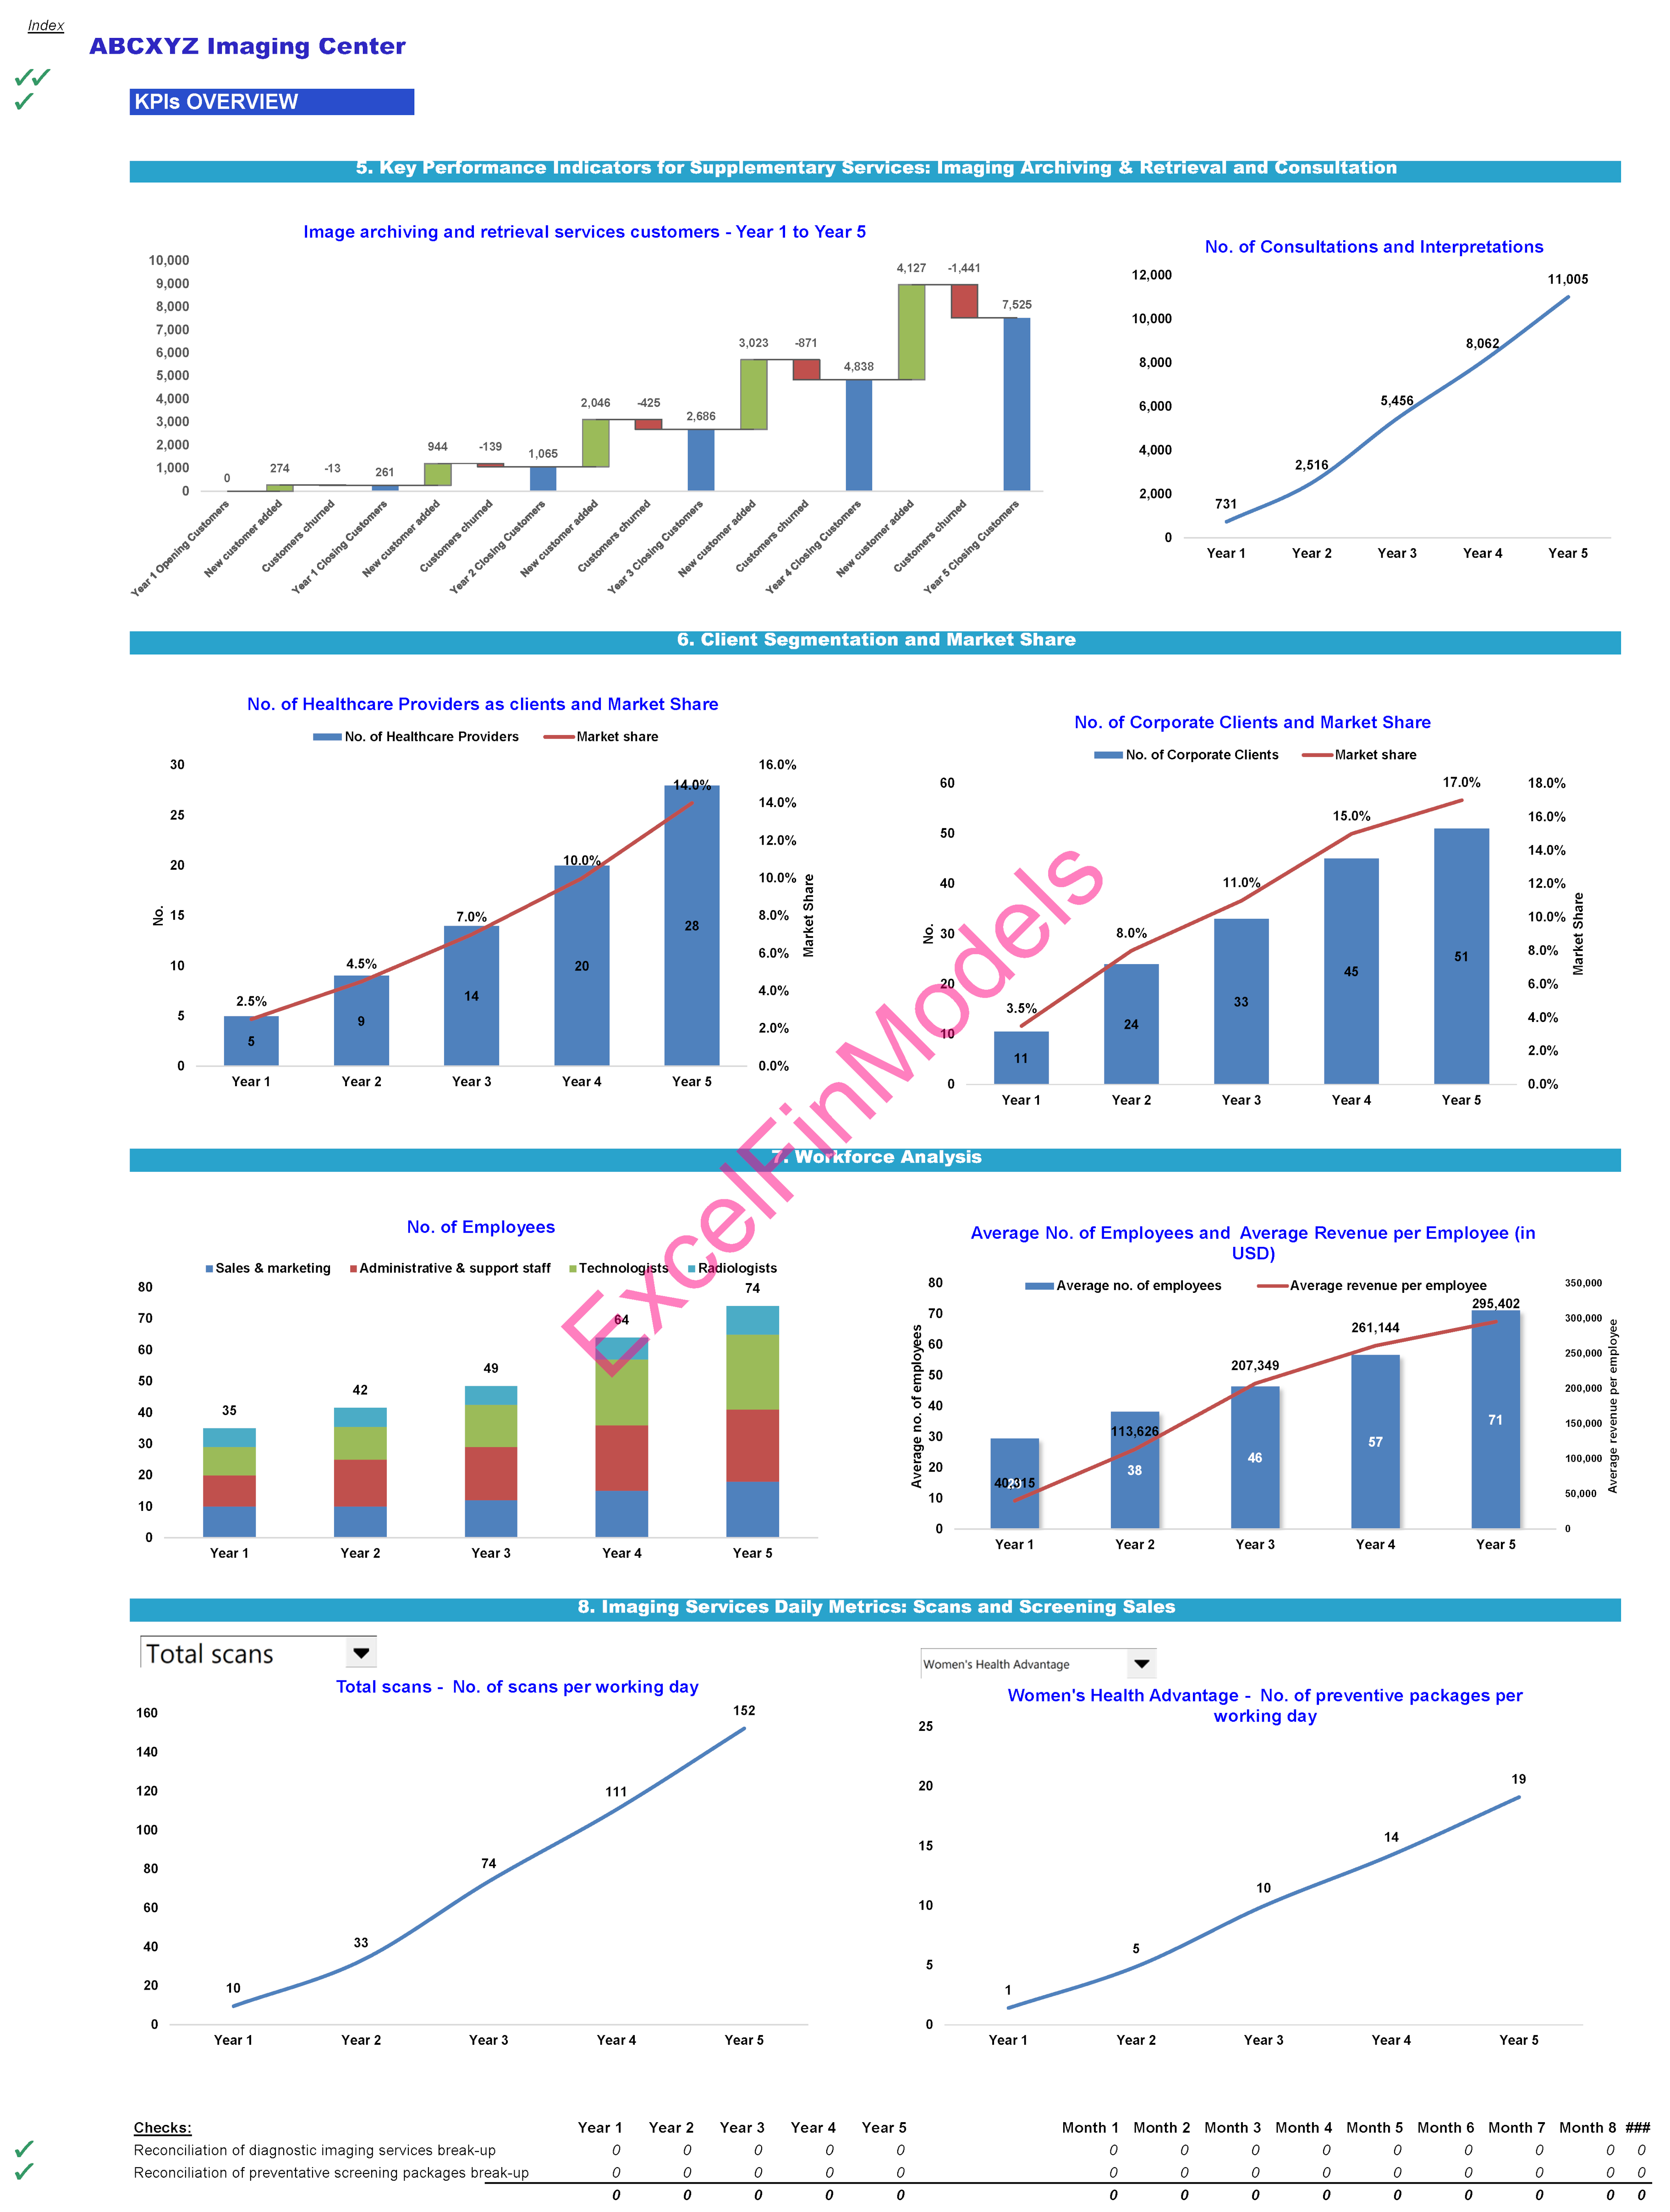
o KPIs Overview: This tab provides a comprehensive visual analysis of critical performance indicators. It covers a range of metrics for the business, including number of diagnostic imaging scans, preventive screening packages, consultation and interpretations, number of clients, number of employees, and average revenue per employee, among others.
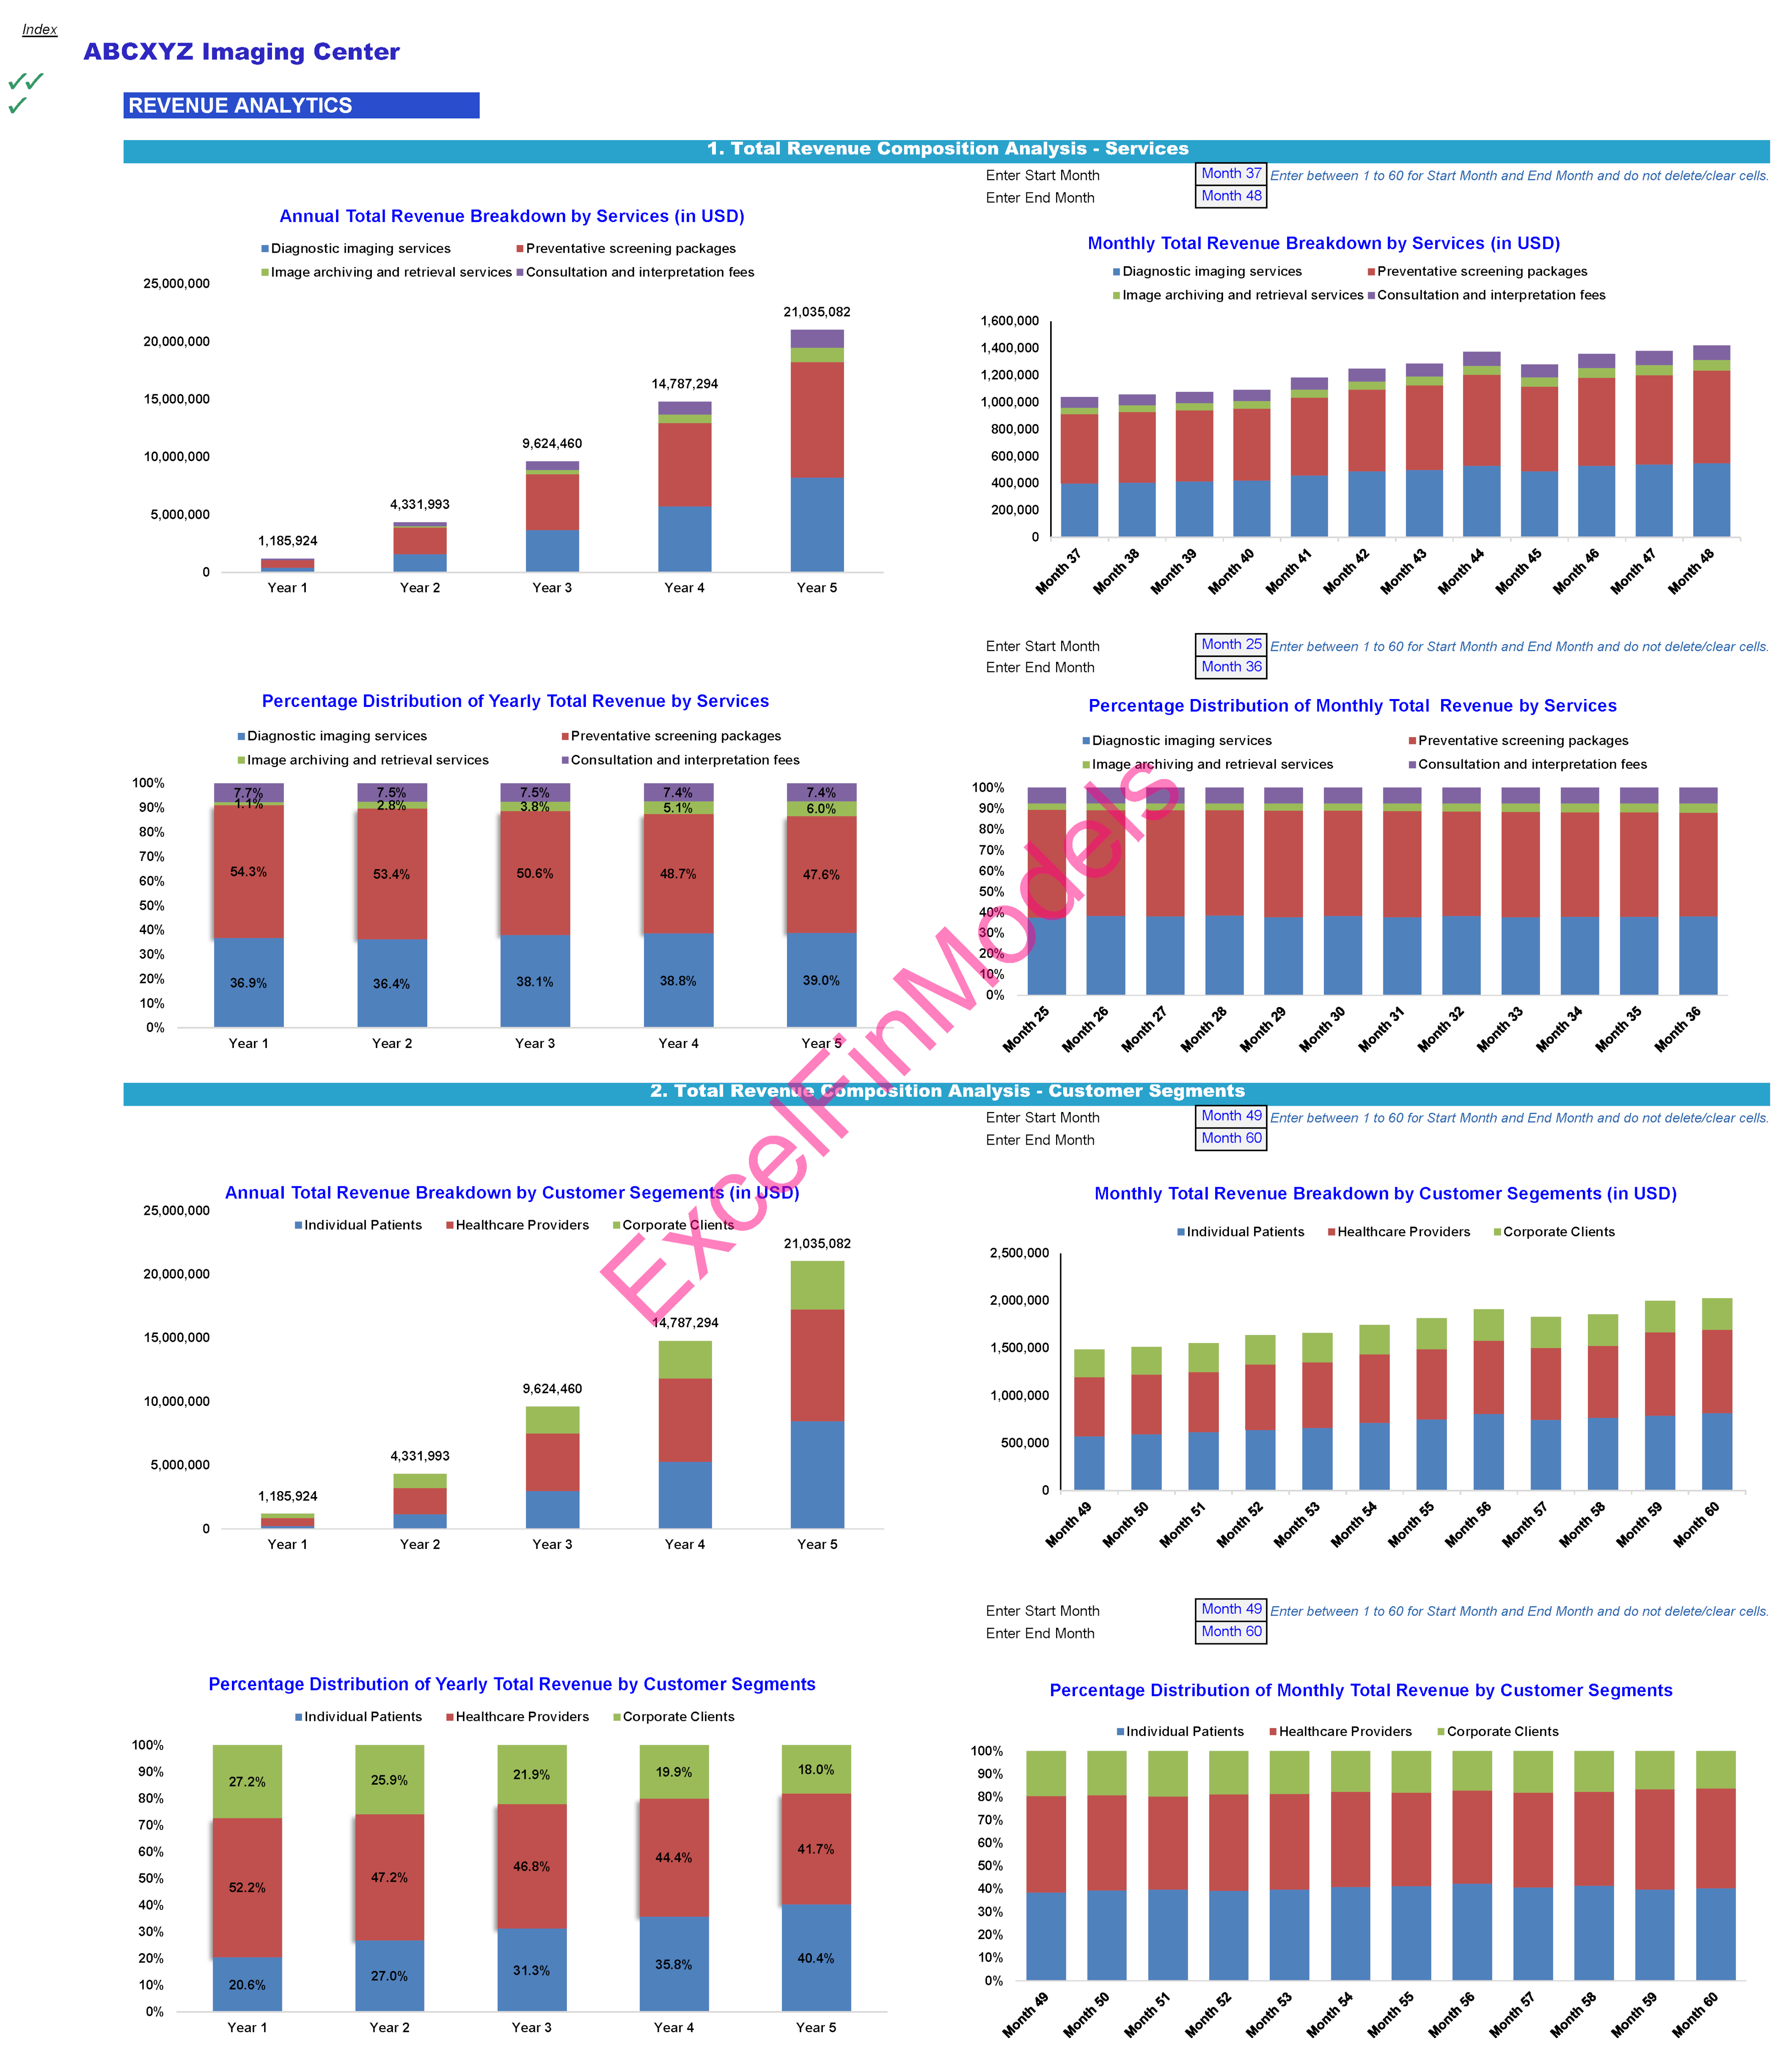
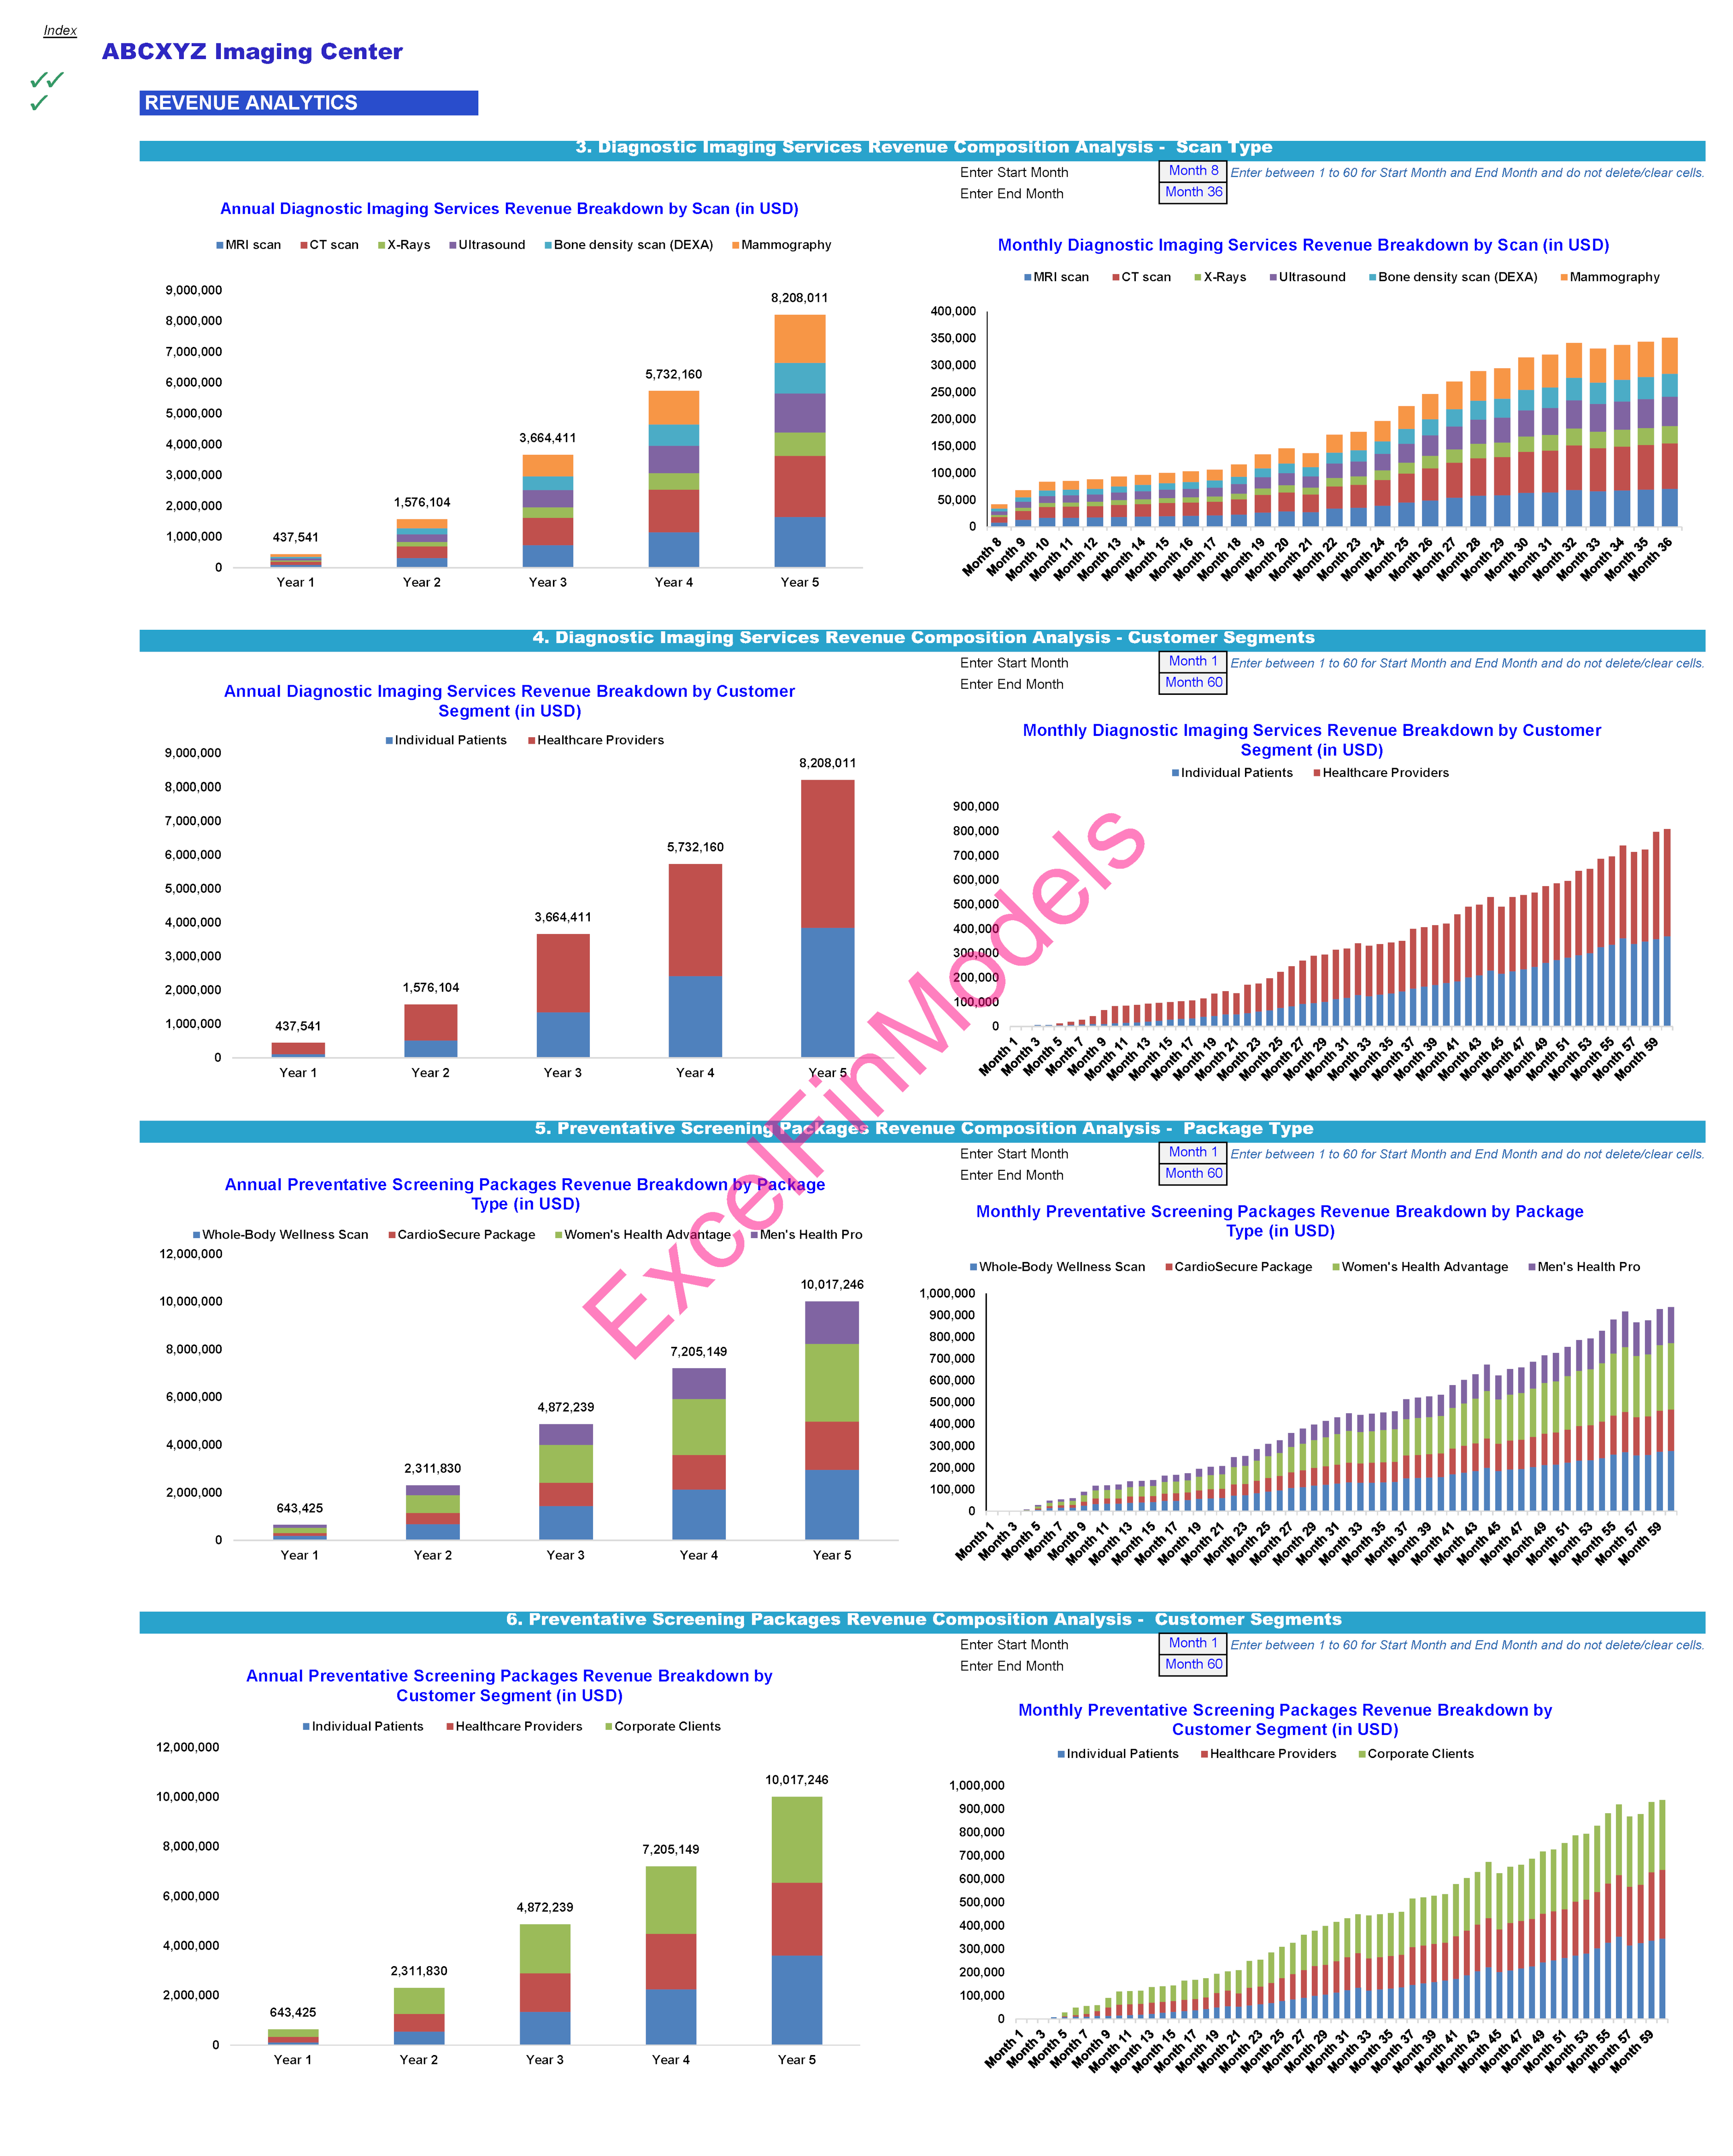
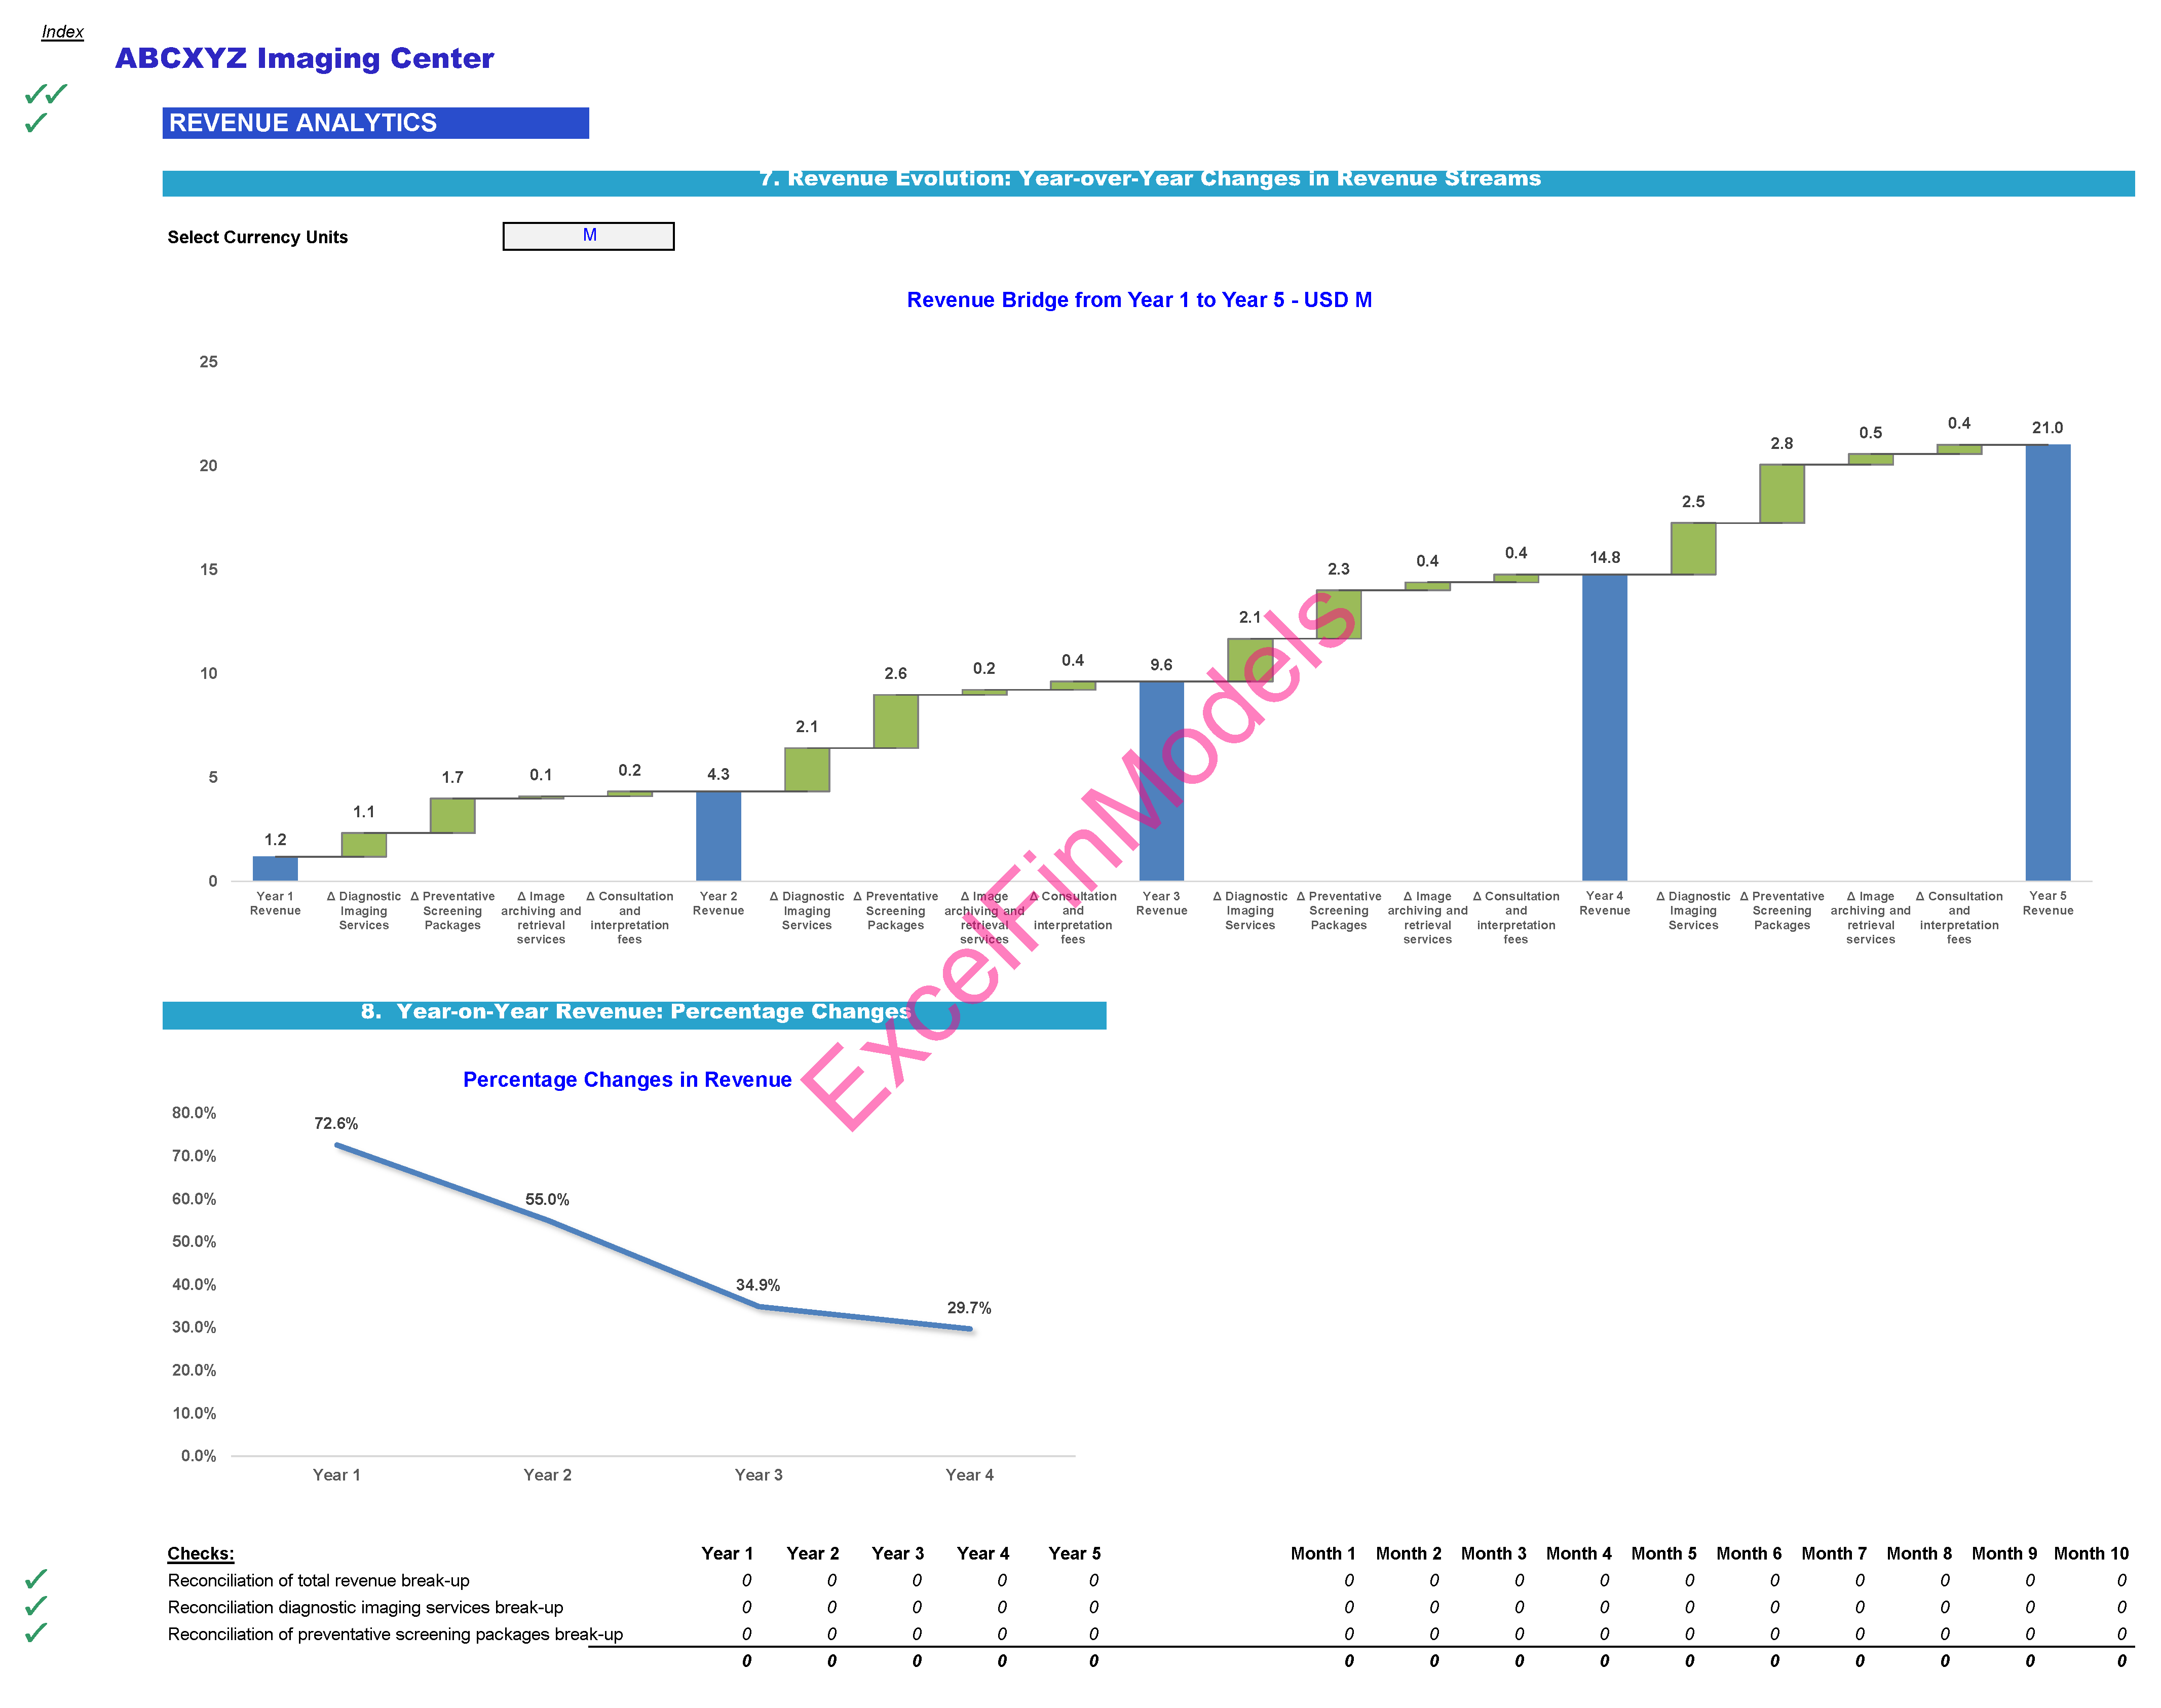
o Revenue Analytics: The Revenue Analytics tab features graphs that offer an intricate visual portrayal of the company's revenue dynamics. These graphs facilitate a deeper understanding of revenue sources, trends, and potential growth avenues. This tab provides a detailed breakdown of revenue across different products and services, different clients and includes a revenue waterfall, among other insights.
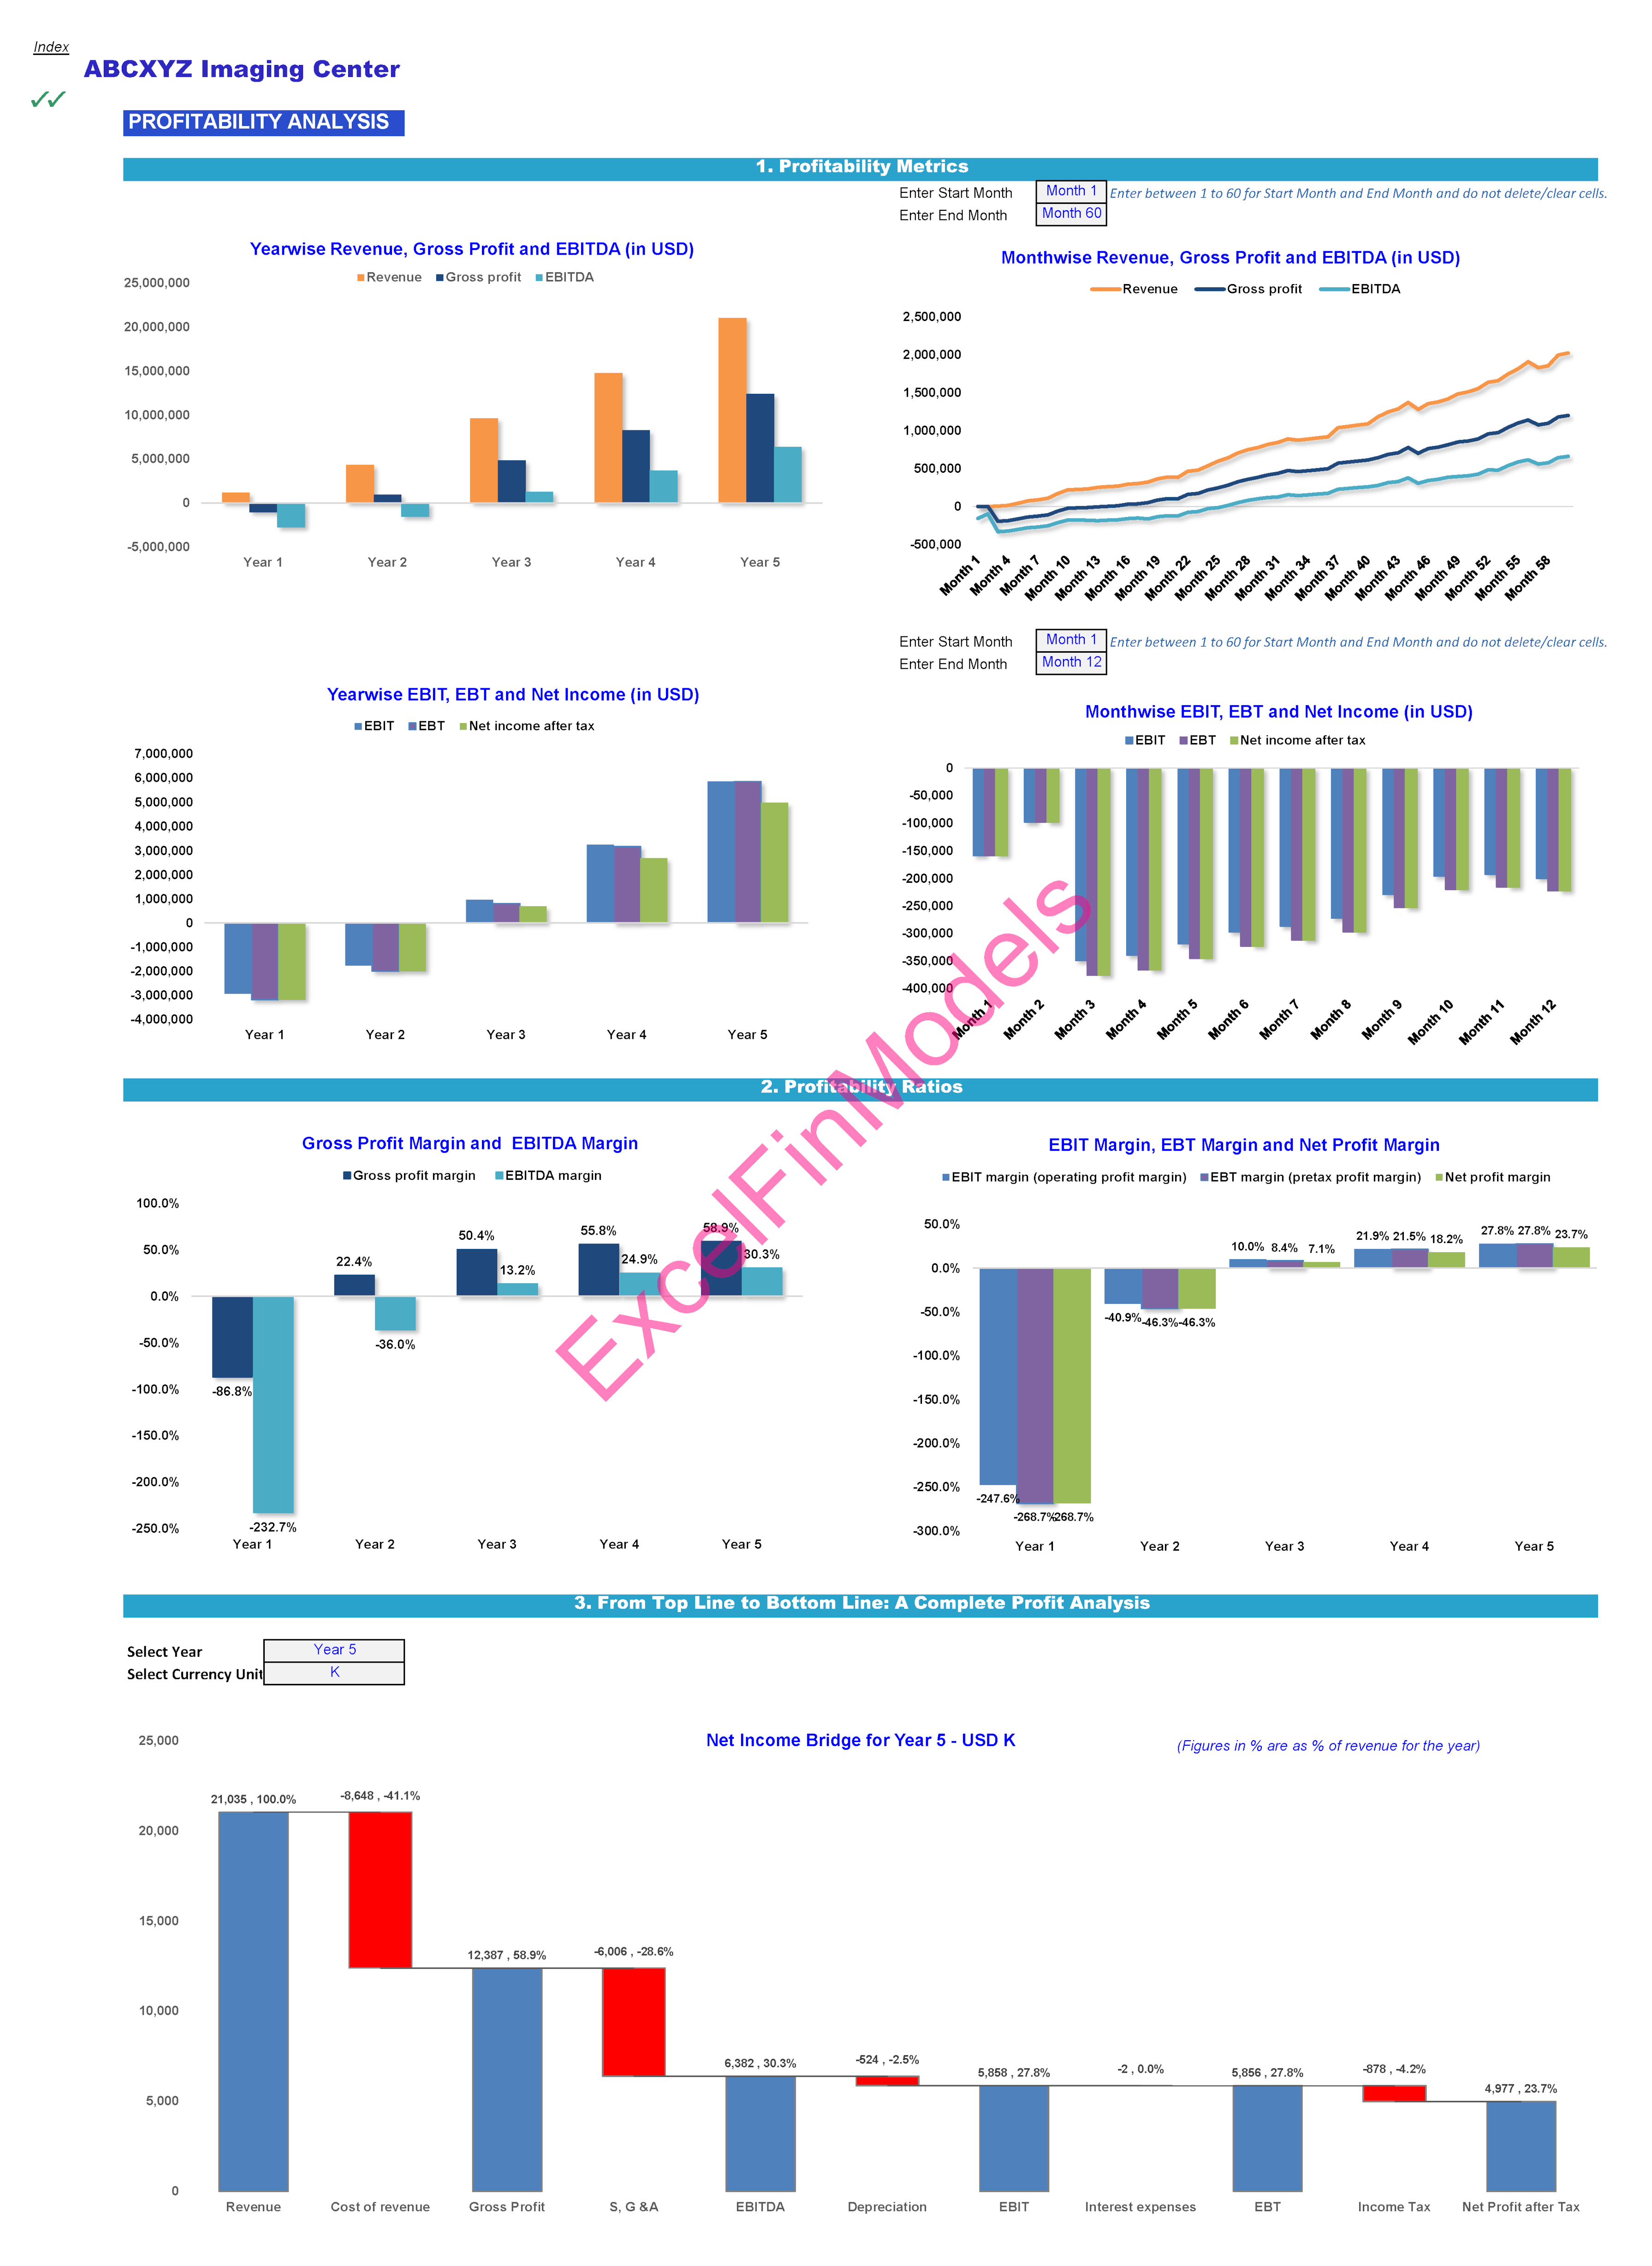
o Profitability Analysis: Offering a dynamic visual exploration of the company's profitability landscape, this tab enables a quick assessment of profitability drivers and potential areas of improvement. It includes detailed graphs of key profitability metrics such as gross profit, EBITDA, net profit, profit margins, and a net income bridge. These visualizations help in identifying trends and analyzing the impact of different factors on the company's overall profitability.
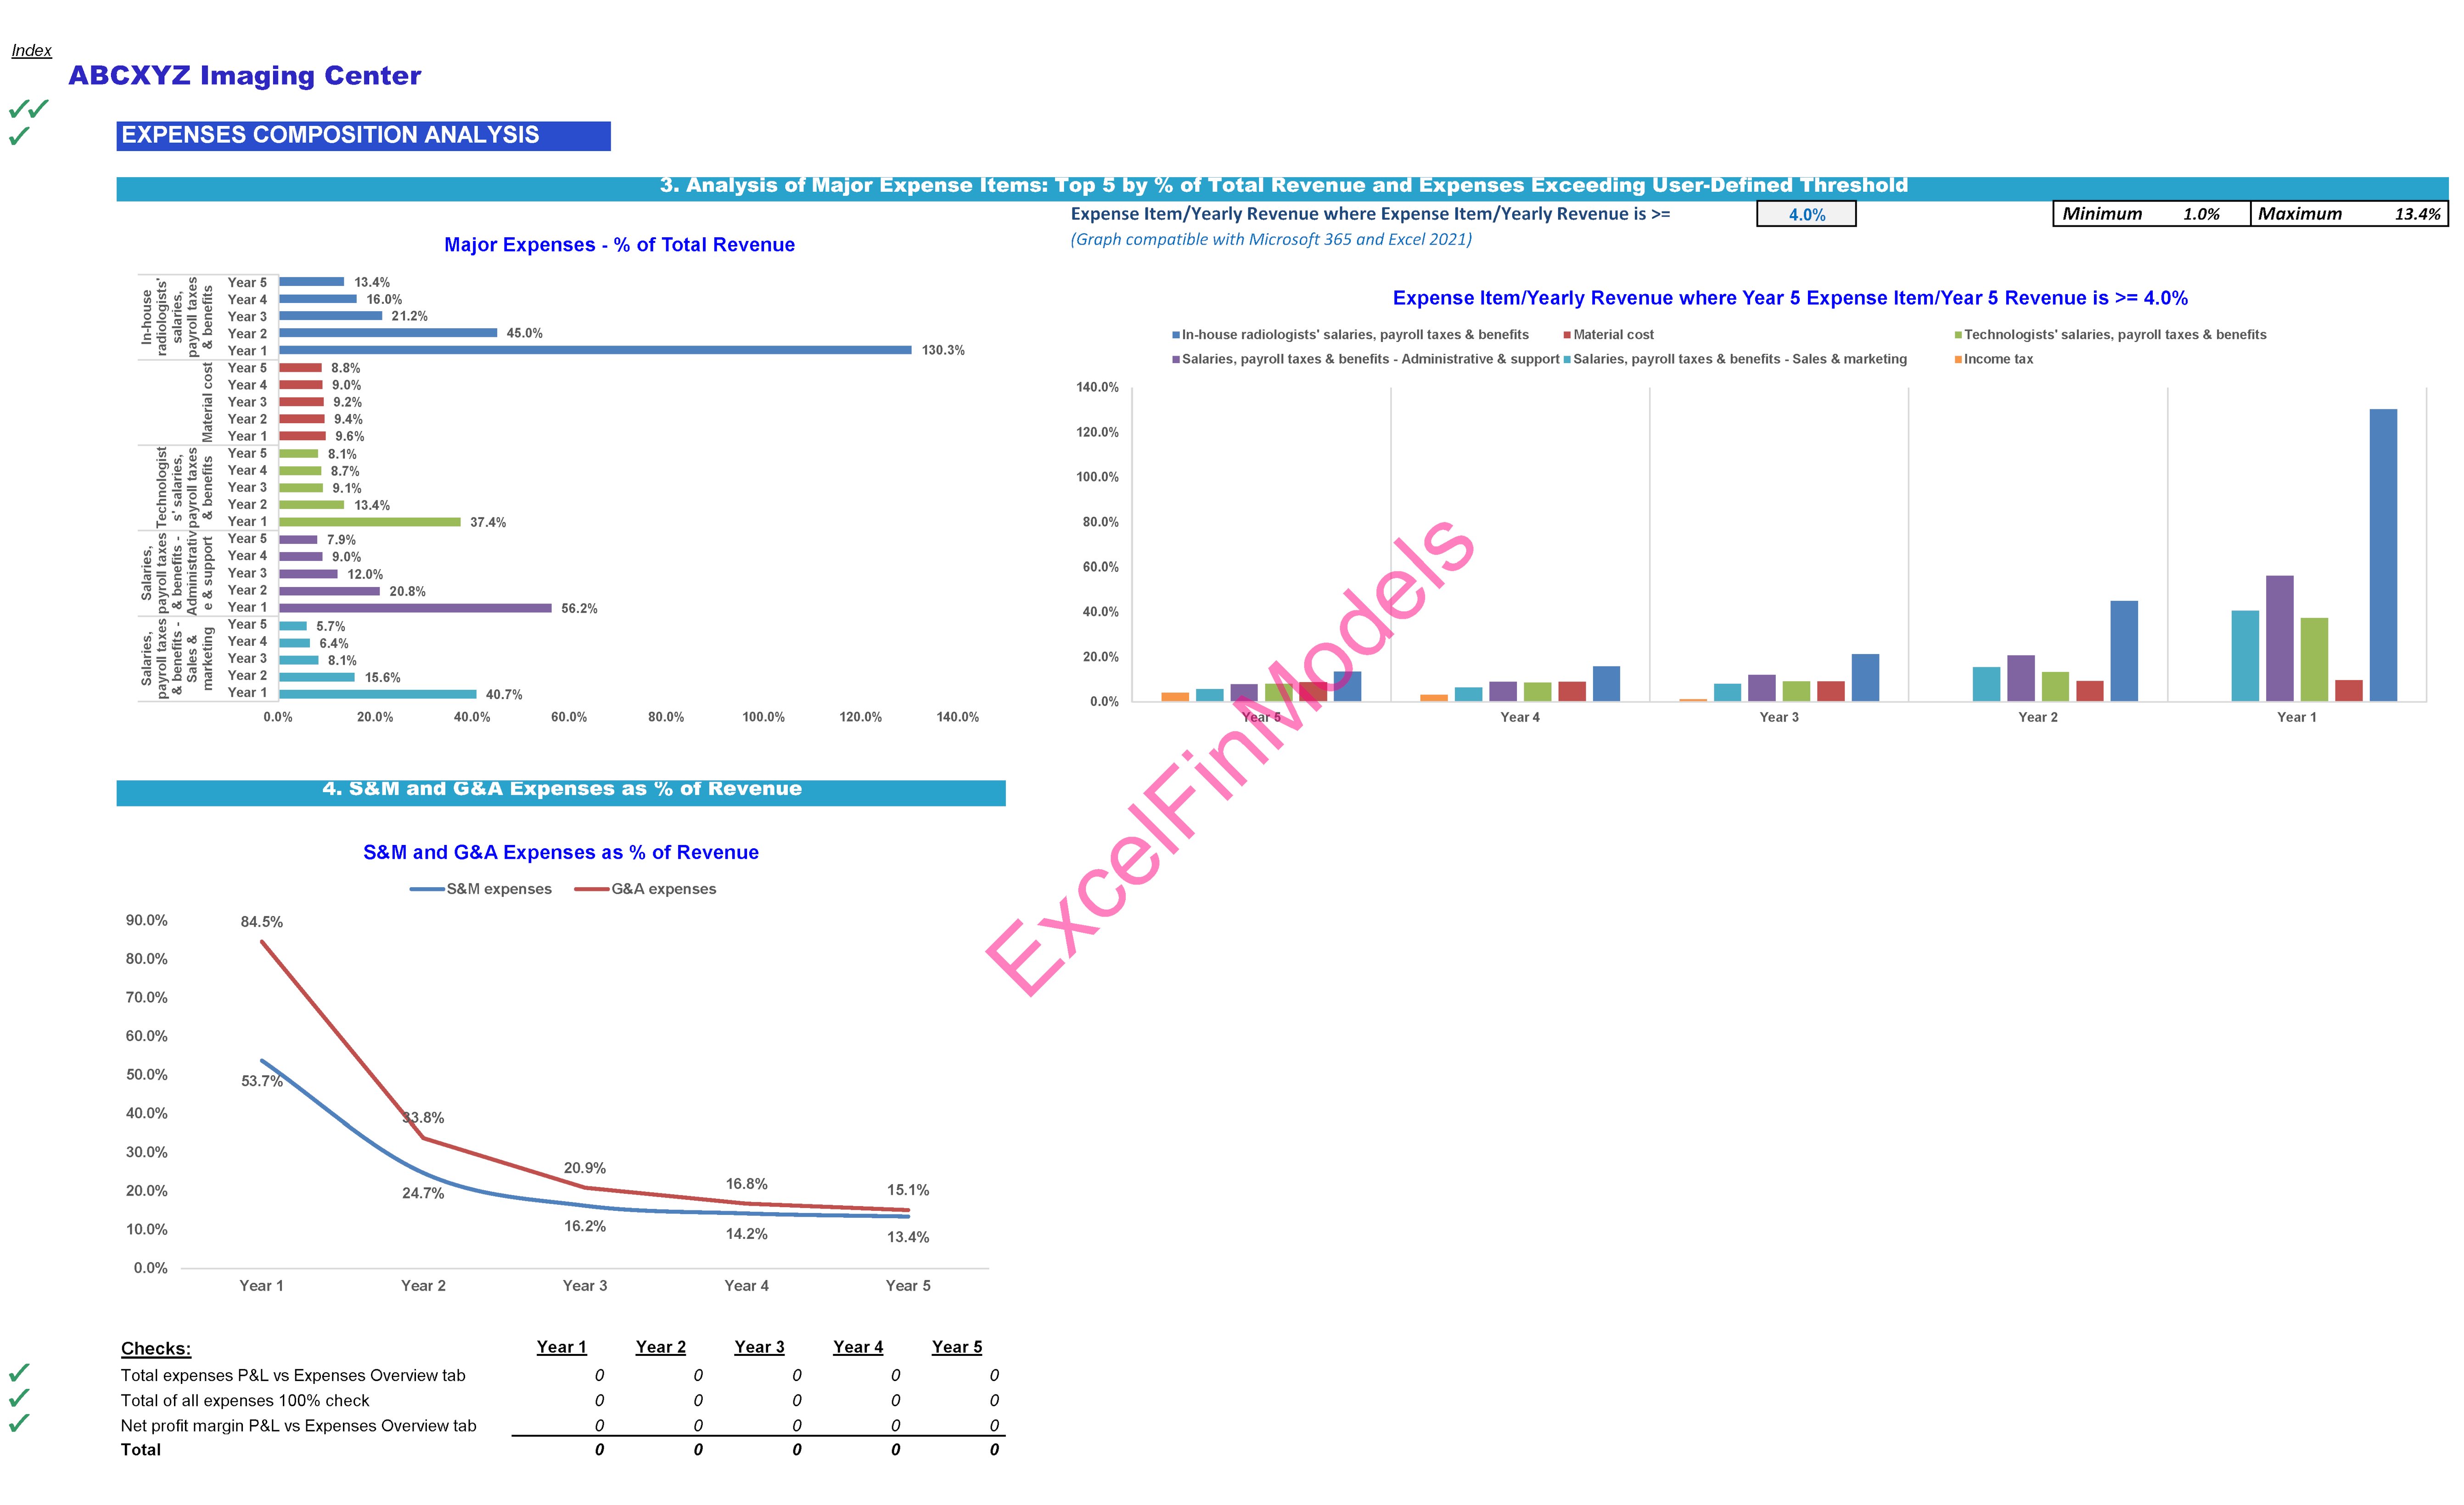
o Expense Composition Analysis: The Expense Composition Analysis tab features graphs that concentrate on major expense items, offering insights to fine-tune cost structures and make informed decisions on expenditure management. These graphs provide a detailed view of expenses in terms of their absolute amounts, their proportions relative to total revenue, and their percentages of total expenses. This comprehensive analysis aids in identifying areas for cost optimization and understanding the impact of different expenses on the company's financial health.
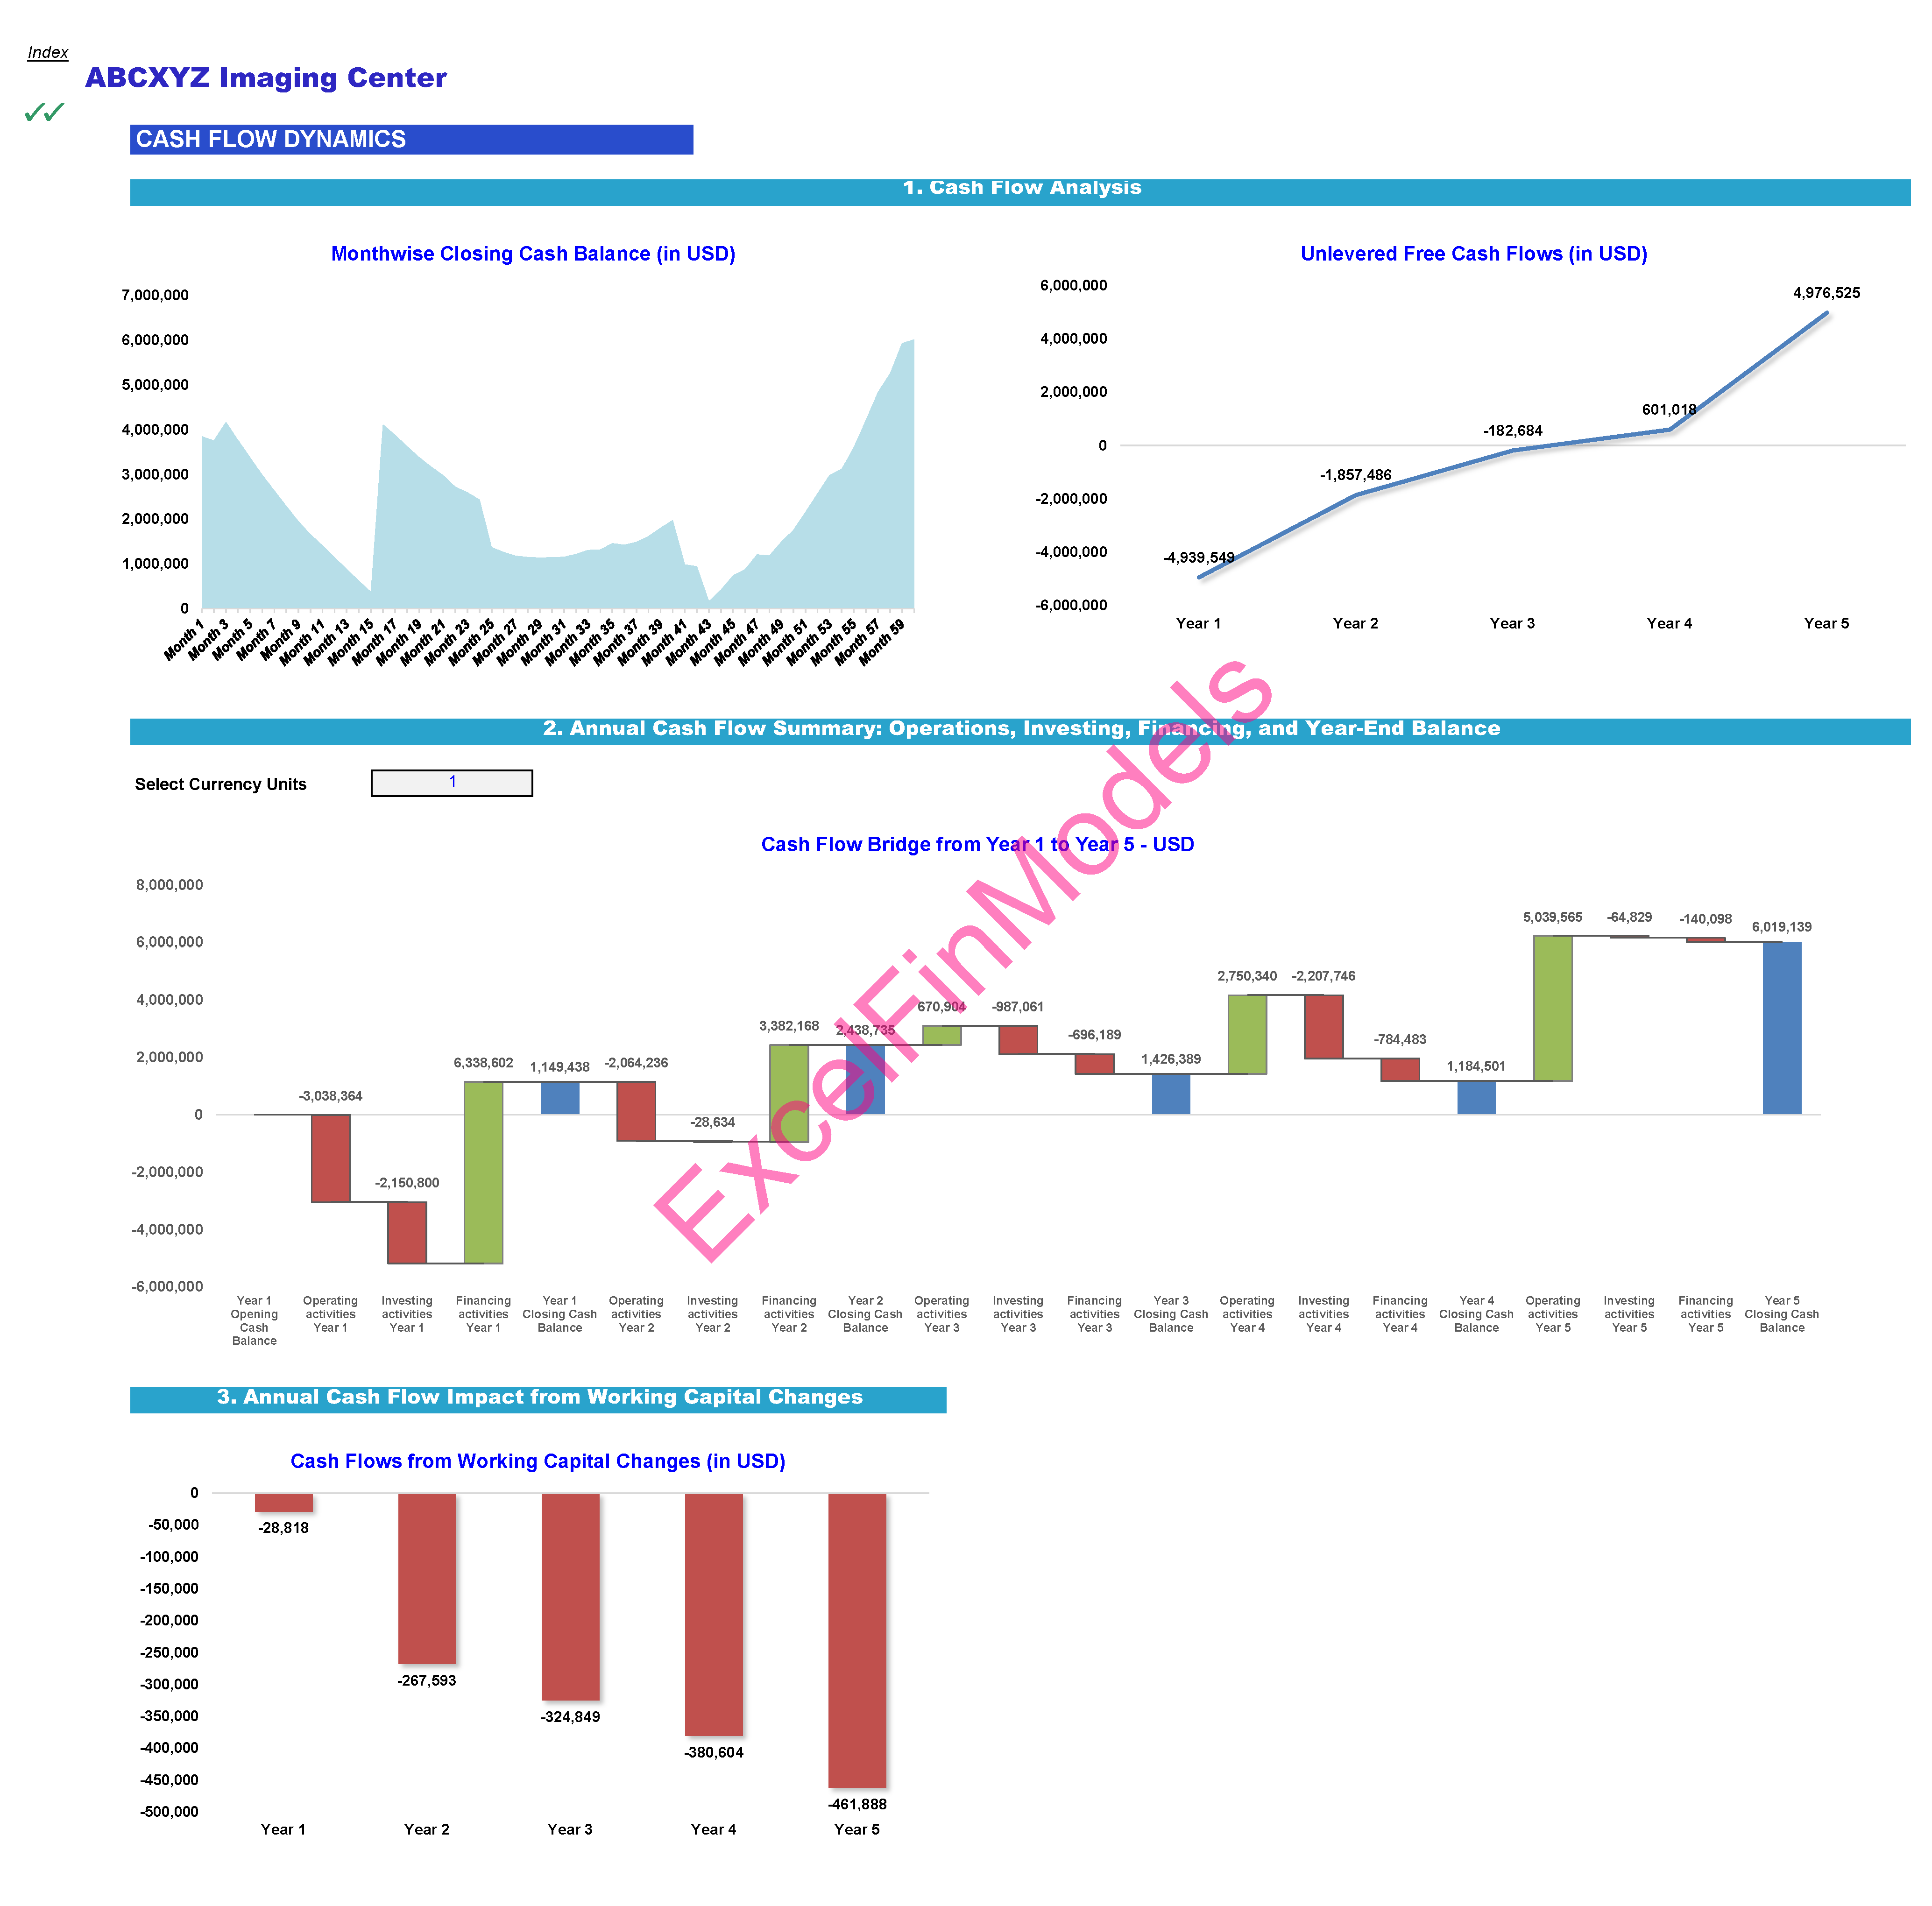
o Cash Flow Dynamics: This tab visualizes cash flow dynamics, including year-wise breakdowns of operating, financing, and investing activities. It tracks monthly closing cash balances and provides comprehensive graphs of yearly unlevered free cash flows. Additionally, the tab offers insights into the sources and uses of cash, helping to identify trends and forecast future cash positions.
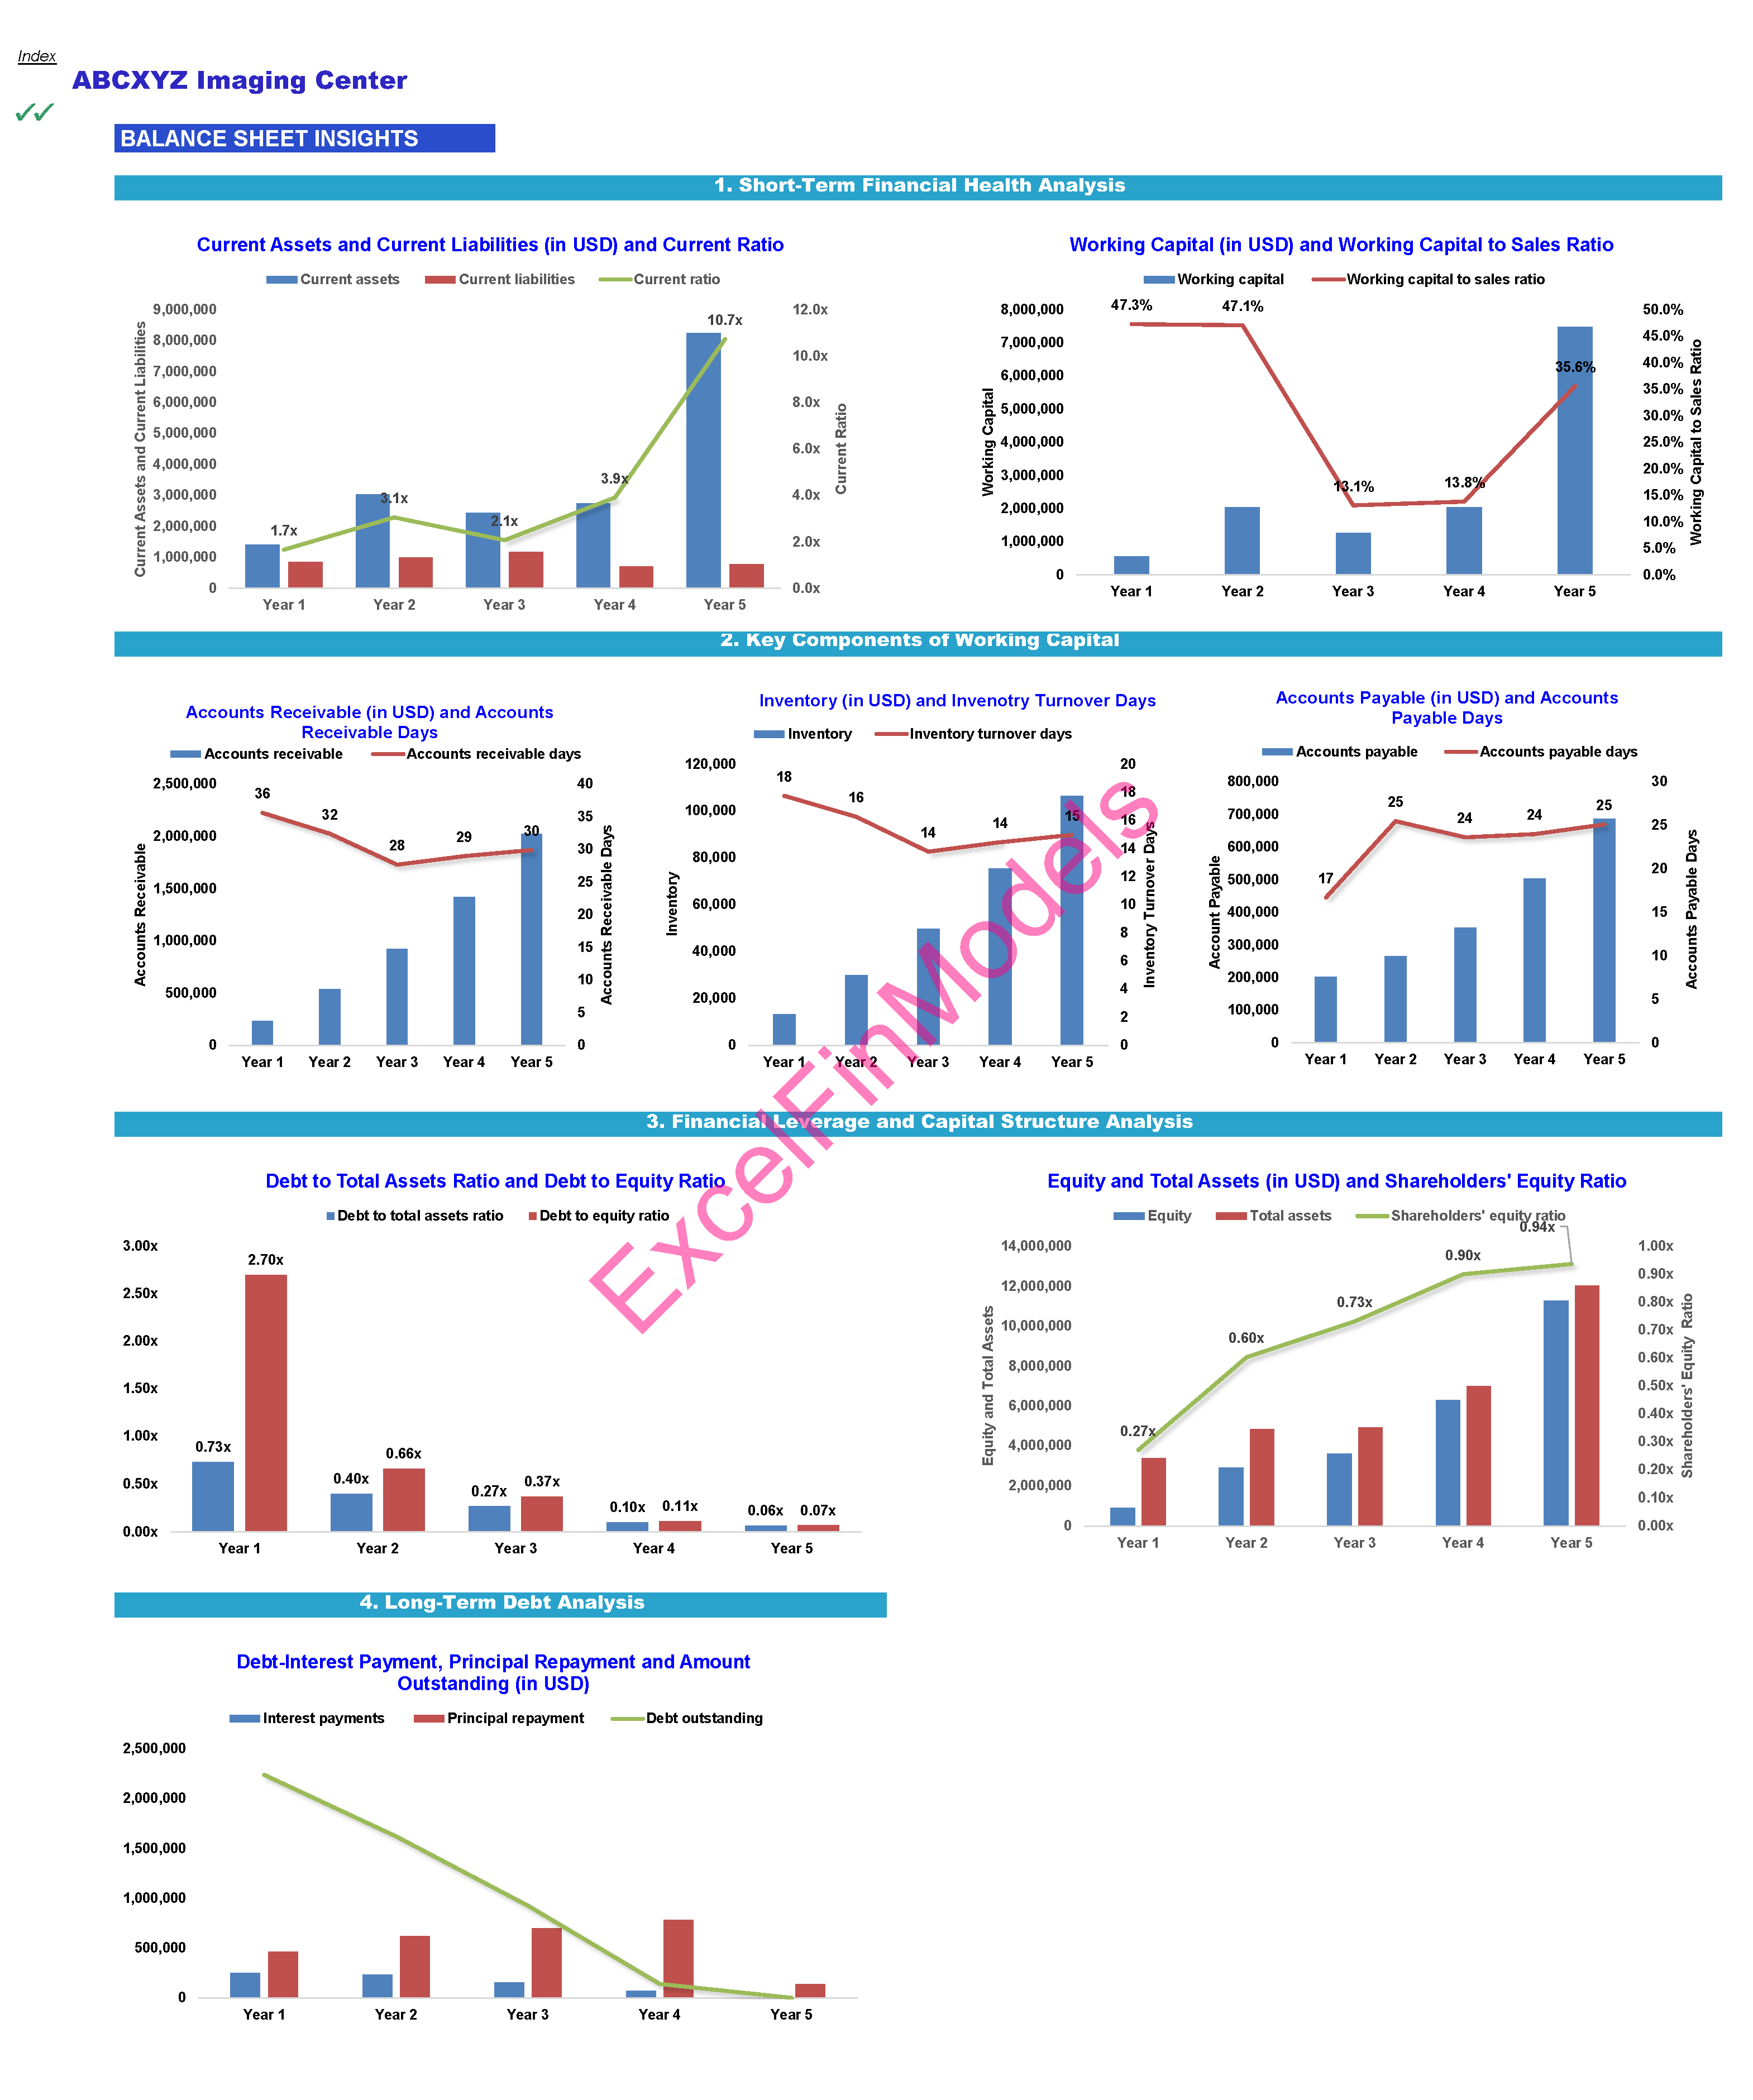
o Balance Sheet Insights: Offering a visual representation of the balance sheet dynamics, this section provides insights into assets, liabilities, and equity changes over time.
Besides year-wise graphs, the above-mentioned graph tabs also contain month-wise graphs where you can input the start and end months. These graphs are tailored for compatibility with Excel for Microsoft 365 and Excel 2021, allowing you to explore month-wise trends.
7. Cap Table Tab: This tab shows ownership structures across funding rounds, from pre-money to Series A.
Technical Specification:
· No VBA or Macros: The model is devoid of any VBA or macro components.
· Circular Reference-Free: The model does not contain any circular reference.
· Excel Compatibility: The model is compatible with Excel versions 2010 and above. However, certain graphs featuring inputs for start and end months are compatible only with Excel for Microsoft 365 and Excel 2021.
· In the DCF Valuation tab of the financial model, there are two data tables that can potentially impact calculation speed. To optimize performance, the calculation option has been configured to “Automatic Except for Data Tables,” which can be found under 'File' -> 'Options' -> 'Formulas' -> 'Calculation Options' -> 'Workbook Calculation' in Excel. With this setting, the data tables will be calculated only upon saving the file, ensuring smoother and more efficient calculations during regular usage.
Should any challenges arise while navigating or utilizing this financial model, our dedicated support team is readily available. We commit to getting back to you as soon as possible to ensure a seamless experience. For tailored solutions to your specific business requirements, kindly reach out to us with a concise overview of your needs. Your success is our priority, and we look forward to supporting your financial endeavors.
Disclaimer: Financial Model Usage and Liability
This financial model ("the model") is developed by Mahender Kumar Punhani ("the author") and is provided to the user ("the user") under the following terms and conditions:
1. License Duration: This license grants the user unlimited use of the model for personal or business purposes but does not include future updates.
2. Restrictions: Redistribution, sale, sublicensing, or public provision of this model is strictly prohibited.
3. Disclaimer of Liability: Despite meticulous effort in developing this financial model, the author disclaims any liability for mistakes, errors, inaccuracies, or omissions. The model is provided "as is," and its use is at the user’s own risk. The author is not liable for any losses, damages, or consequences resulting from its use.
4. Data Reliability: All data included in the model is for illustrative purposes only and cannot be relied upon as accurate. The user is responsible for verifying the data and ensuring its accuracy and appropriateness for their specific needs.
5. Customization and Review: The template model may require customization by the user to suit their individual requirements. The author does not guarantee the model's fitness for any particular purpose or its compatibility with the user's specific circumstances.
6. Feedback: ExcelFinModels encourage users of our financial model to provide feedback to enhance its utility and accuracy. ExcelFinModels reserves the right to determine the applicability and implementation of any suggested changes.
7. Refund Policy: Given the digital and intellectual nature of our financial model, all sales are considered final. We encourage users to review the model's features and limitations before purchase. In exceptional cases where a product is found to be significantly not as described, please contact us within 7 days of purchase for review.
8. All rights reserved: ExcelFinModels exclusively owns this financial model template. All rights are reserved.
This Best Practice includes
1 Excel Sheet
Further information
The objective of this financial model is to provide a comprehensive framework for forecasting the financial performance of an imaging center, excluding interventional radiology procedures. By projecting revenues, expenses, and profitability metrics, this model empowers stakeholders, potential investors, financial analysists and consultants to make informed decisions, optimize resource allocation, and drive the success of the imaging center business.
This financial model is best suited for entrepreneurs and investors seeking to analyze and forecast the financial performance of an imaging center that primarily focuses on diagnostic imaging services (such as MRI, CT scan, X-Ray, ultrasound, mammography, Bone density scan (DEXA) etc.) excluding interventional radiology procedures. It is particularly valuable for stakeholders looking to optimize financial planning and decision-making processes tailored to the unique needs of imaging centers.
