


Originally published: 29/06/2023 12:19
Publication number: ELQ-80813-1
View all versions & Certificate
Publication number: ELQ-80813-1
View all versions & Certificate

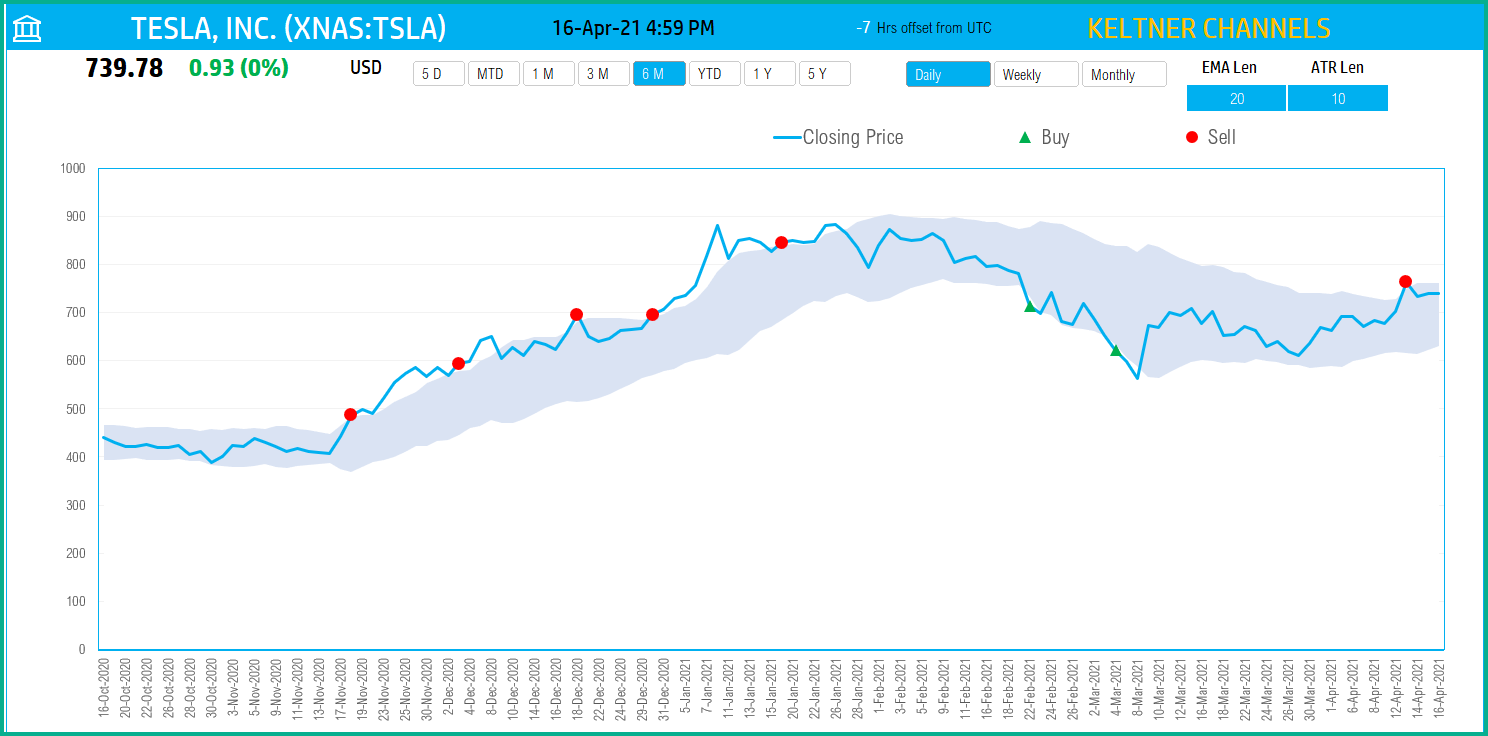
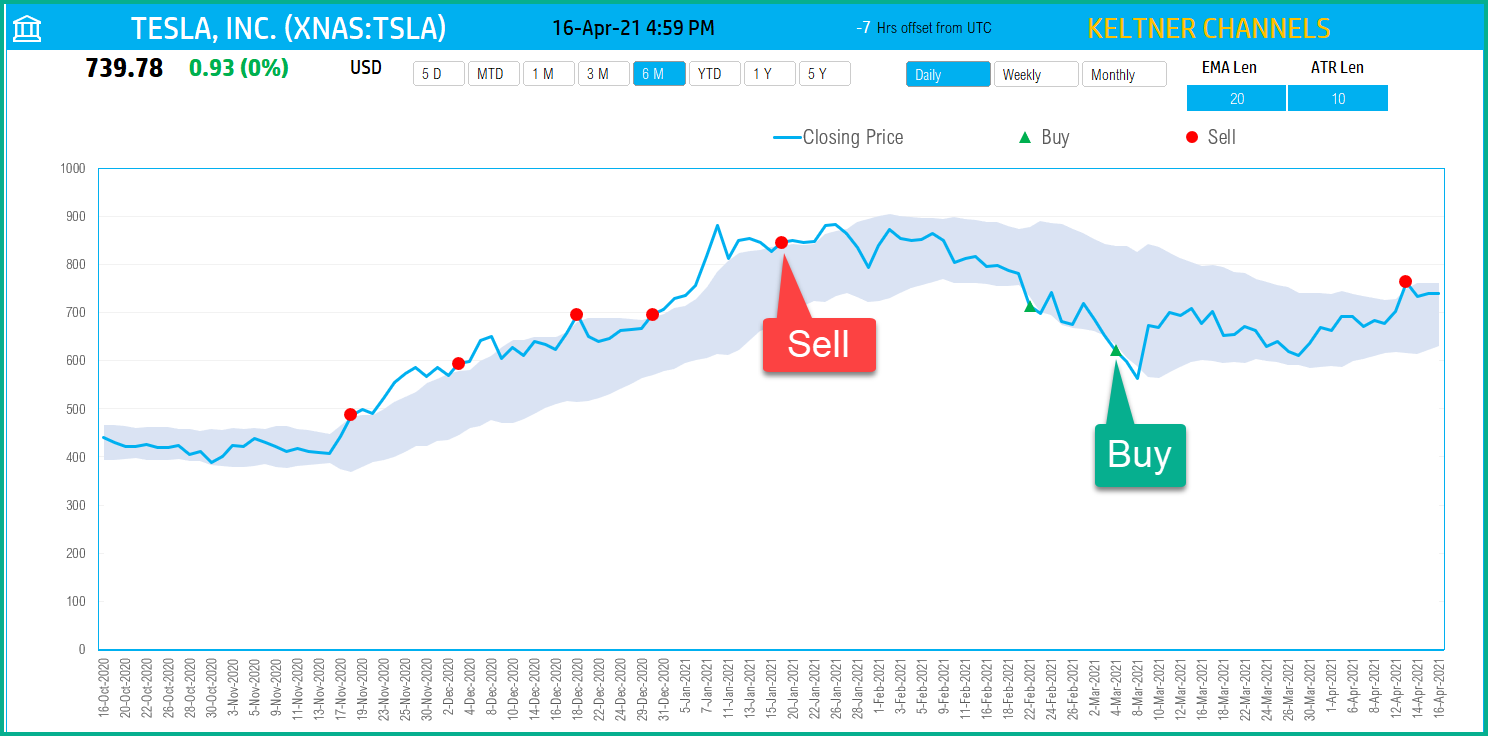
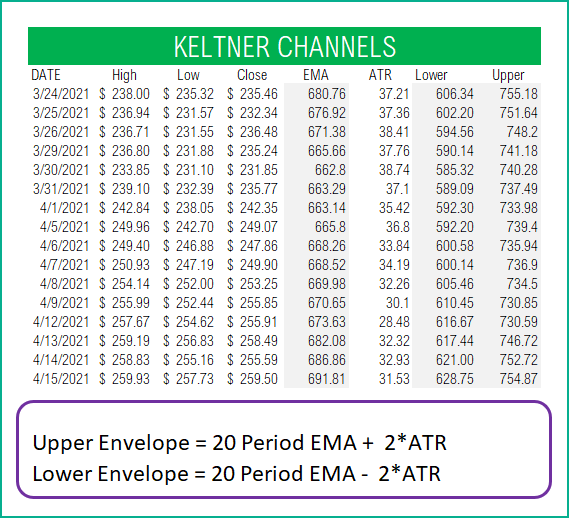
Keltner Channels Indicator & Strategy Signals in Excel
This free excel template is for Keltner Channels technical indicator that is used to analyze stock performance.
