
Originally published: 25/10/2021 12:57
Last version published: 26/10/2021 07:58
Publication number: ELQ-99115-2
View all versions & Certificate
Last version published: 26/10/2021 07:58
Publication number: ELQ-99115-2
View all versions & Certificate

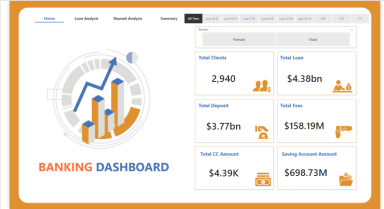
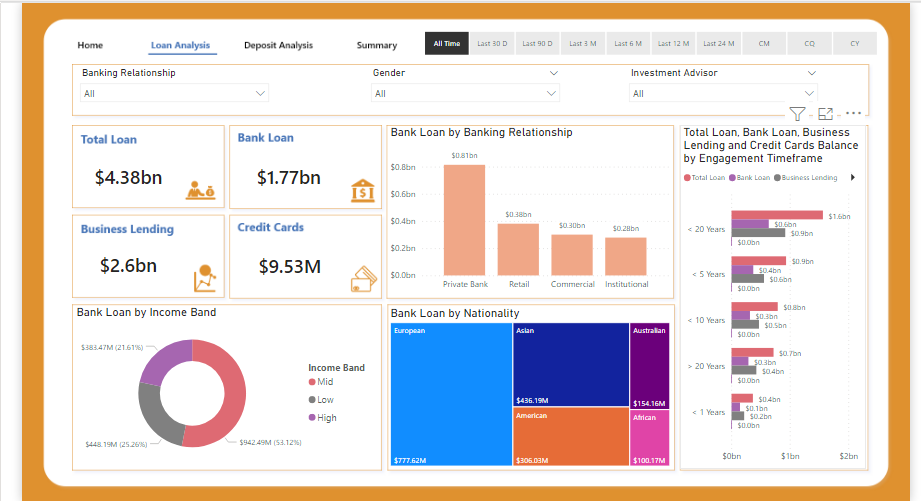
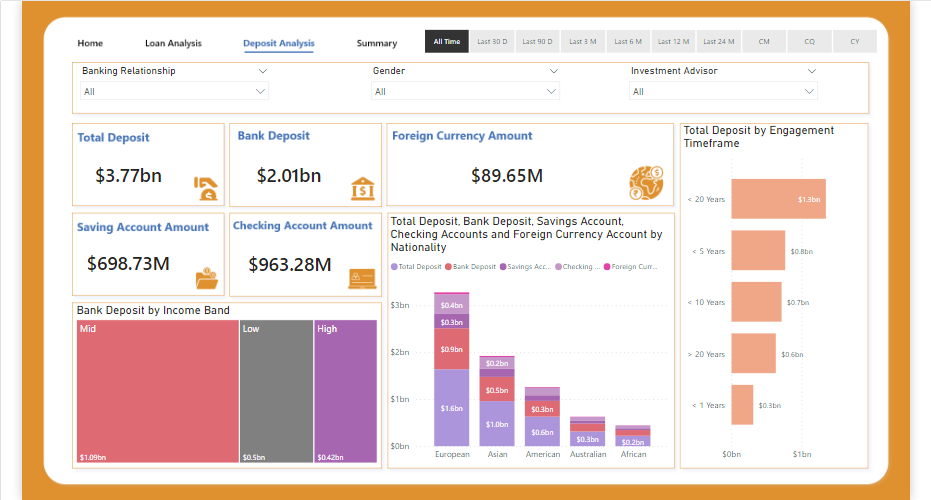
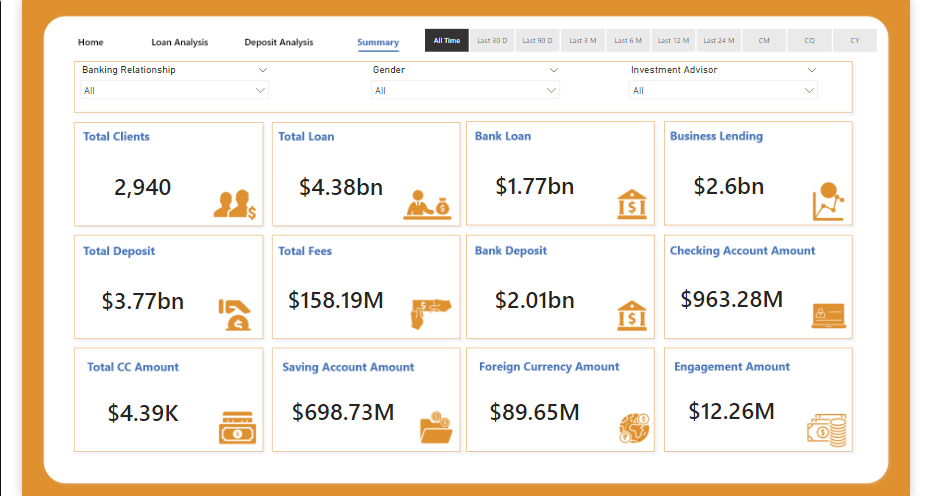
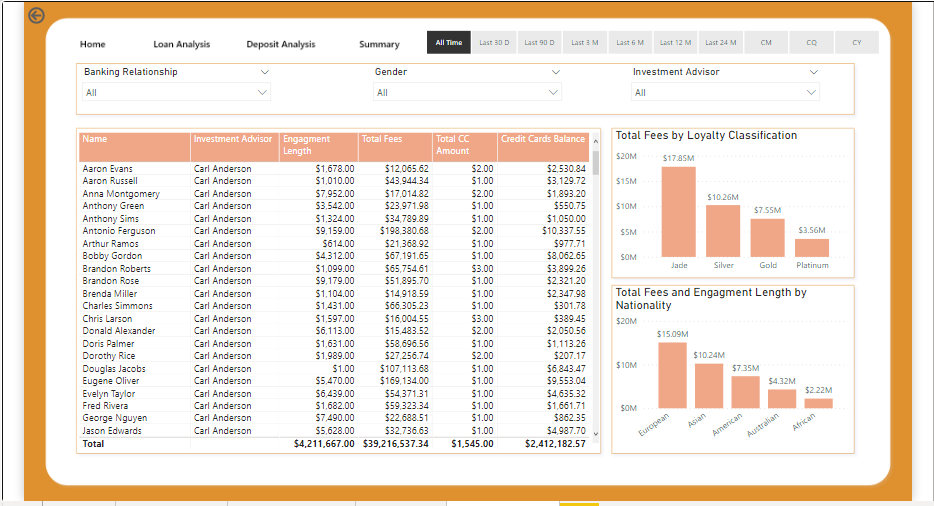
Banking Analysis Dashboard
Banking Analysis Dashboard using Excel and pbix
BI Analyst | Power BI Reporting | Data Analyst | Data Visualization Expert | Power Automation | SQLFollow 49
Further information
You can use this report for learning purposes or entering into a competition or commercial use. Also for real time Projects.
