Create and use your own Mekko or Marimekko chart on Excel unlocked
Management consultants' favorite chart: Mekko chart or variable-width chart
Useful, clever and interesting excel tools, templates and models particularly catered for management consultantsFollow

Description
This tool is for the advanced excel user. It's a consultant's dream to embed this into their dynamic and live excel spreadsheets.
A Mekko chart (sometimes also called marimekko chart) is a two-dimensional stacked chart. In addition to the varying segment heights of a regular stacked chart, a Mekko chart also has varying column widths. Column widths are scaled such that the total width matches the desired chart width.
Excel doesn't have a standard integrated Mekko chart in its graph system and sometimes it is useful to have a fully dynamic Mekko chart that is updated based on cell data.
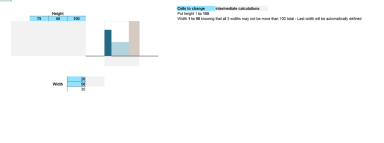
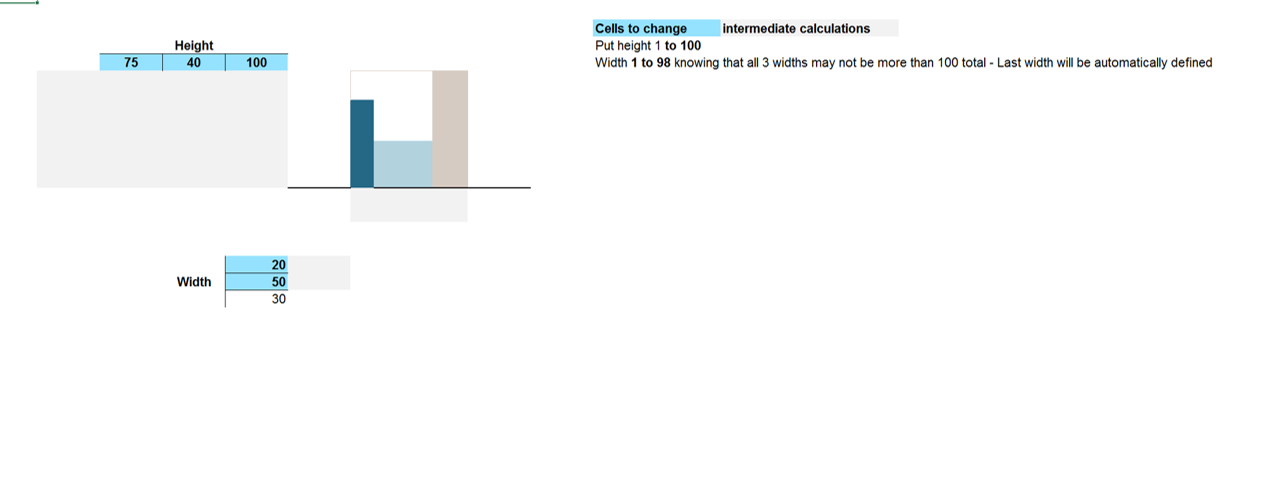
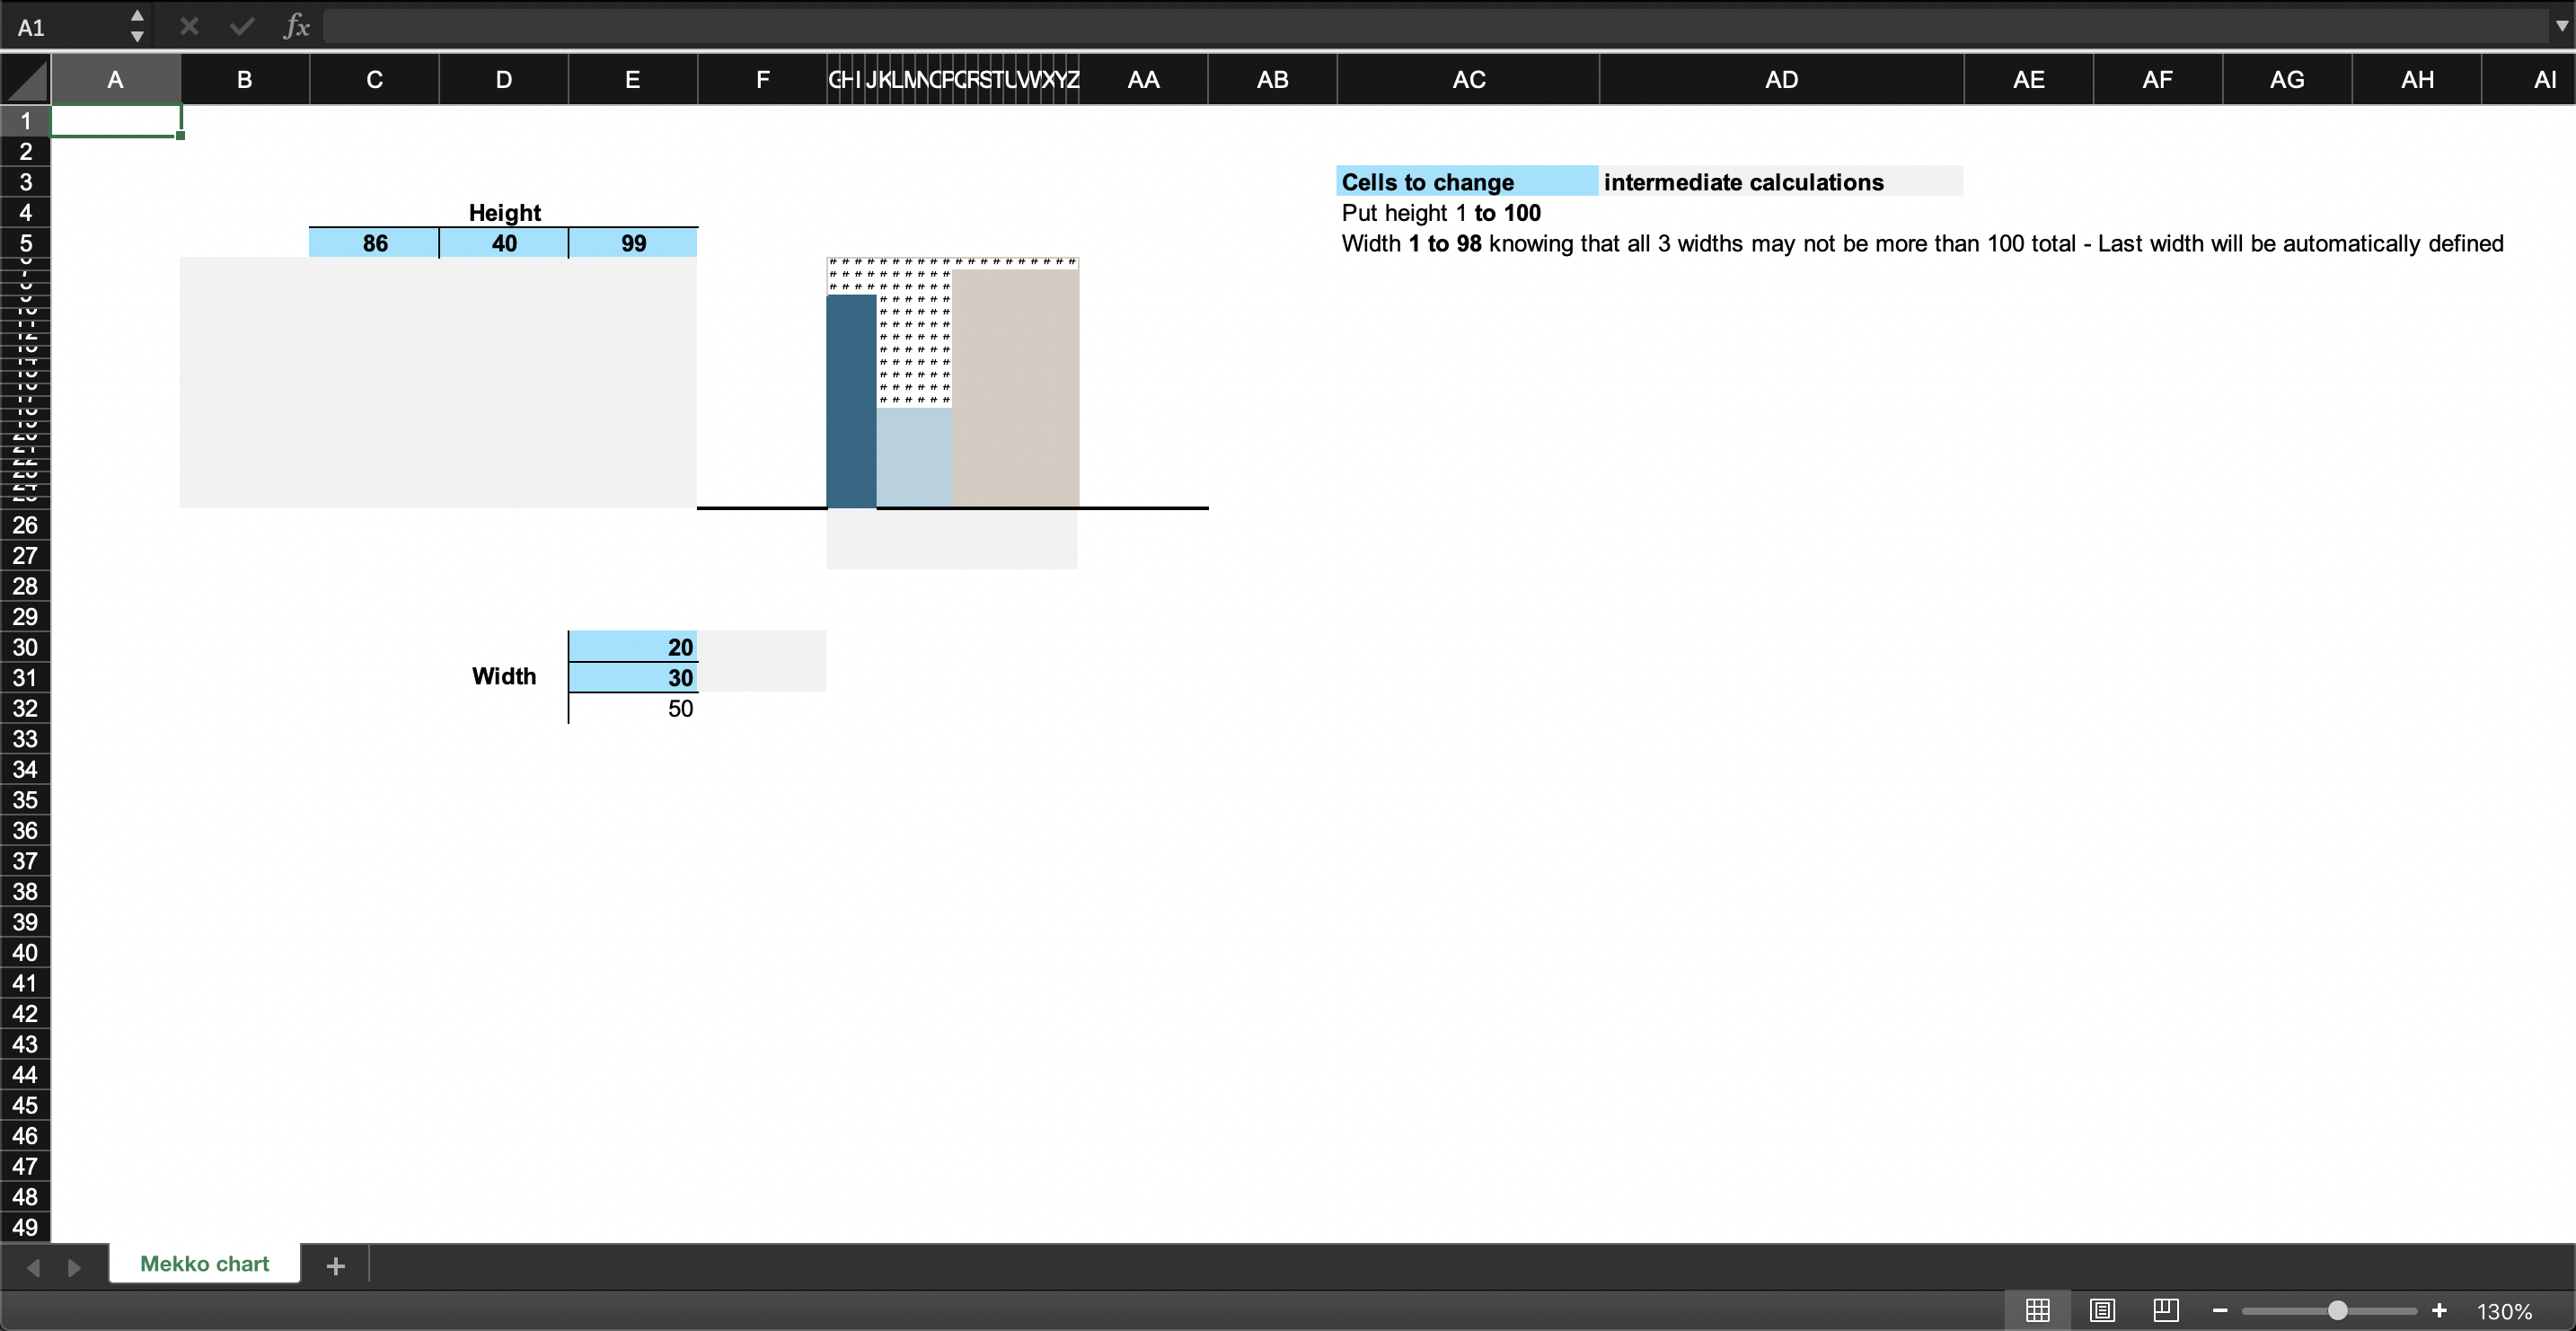
This graph is created in a 20 by 20 cell where you could have 3 bars. This is an example that can be used to replicate more complex Mekko charts are needed. Would be great for automated report that require updating.
The user basically needs to enter the height of each of the 3 graphs (this could of course come from outside data eventually). Then also need to define 2 of the graphs' width. The 3rd and last graph will be automatically calculated to fill the space.
There are a series of intermediary calculations that then output in the 20 x 20 cells either 1, 2, or 3. These are then interpreted by conditional formatting to the right colors as seen.
Excellent tool for consultants
This tool is for the advanced excel user. It's a consultant's dream to embed this into their dynamic and live excel spreadsheets.
A Mekko chart (sometimes also called marimekko chart) is a two-dimensional stacked chart. In addition to the varying segment heights of a regular stacked chart, a Mekko chart also has varying column widths. Column widths are scaled such that the total width matches the desired chart width.
Excel doesn't have a standard integrated Mekko chart in its graph system and sometimes it is useful to have a fully dynamic Mekko chart that is updated based on cell data.
This graph is created in a 20 by 20 cell where you could have 3 bars. This is an example that can be used to replicate more complex Mekko charts are needed. Would be great for automated report that require updating.
The user basically needs to enter the height of each of the 3 graphs (this could of course come from outside data eventually). Then also need to define 2 of the graphs' width. The 3rd and last graph will be automatically calculated to fill the space.
There are a series of intermediary calculations that then output in the 20 x 20 cells either 1, 2, or 3. These are then interpreted by conditional formatting to the right colors as seen.
Excellent tool for consultants
This Best Practice includes
1 Excel chart


