Publication number: ELQ-65931-1
View all versions & Certificate

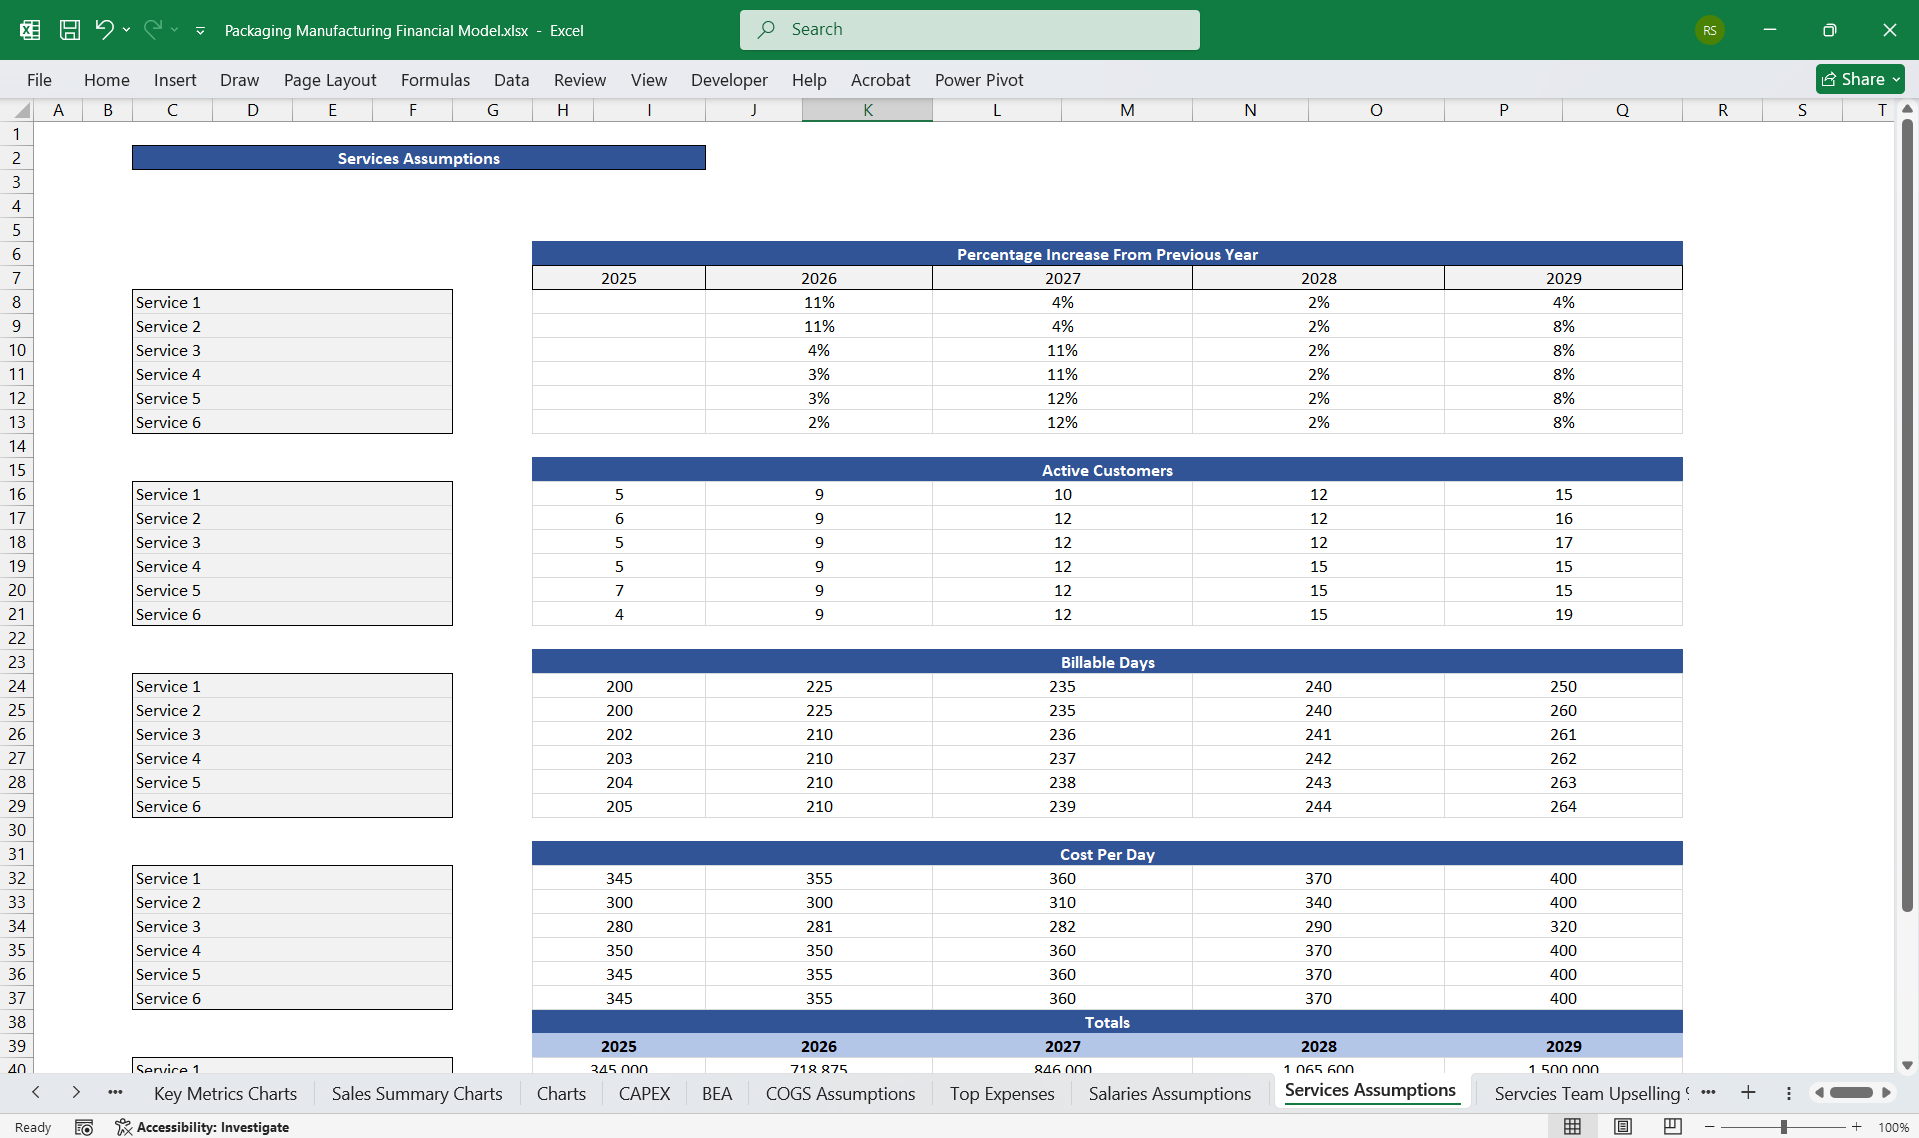
Packaging Manufacturer Financial Model Excel Template
A comprehensive editable, 5-year 3 statement MS Excel spreadsheet for tracking a Packaging Company's finances.
AllFinancialModels offer a curated selection of high-quality yet financial model templates designed to support a wide range of business needs.Follow
1. Overview
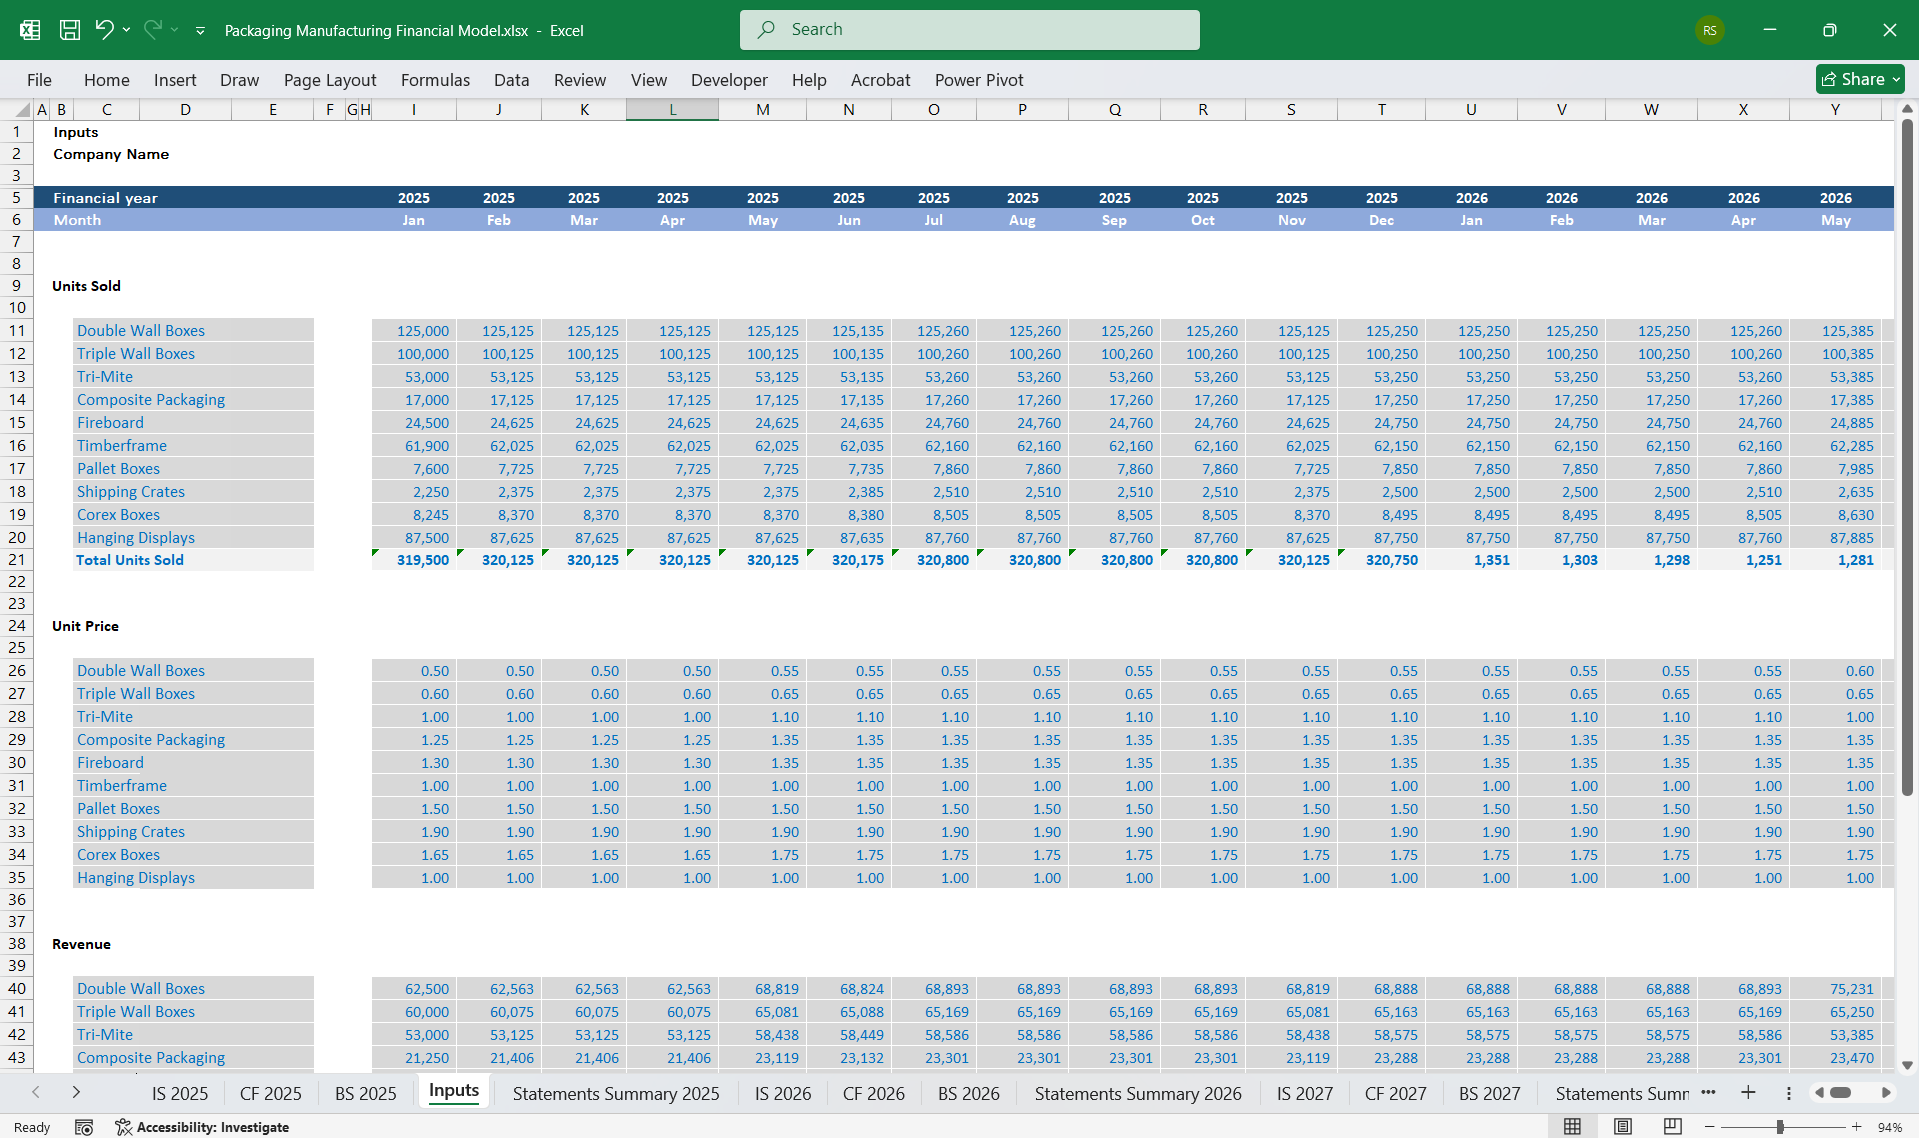
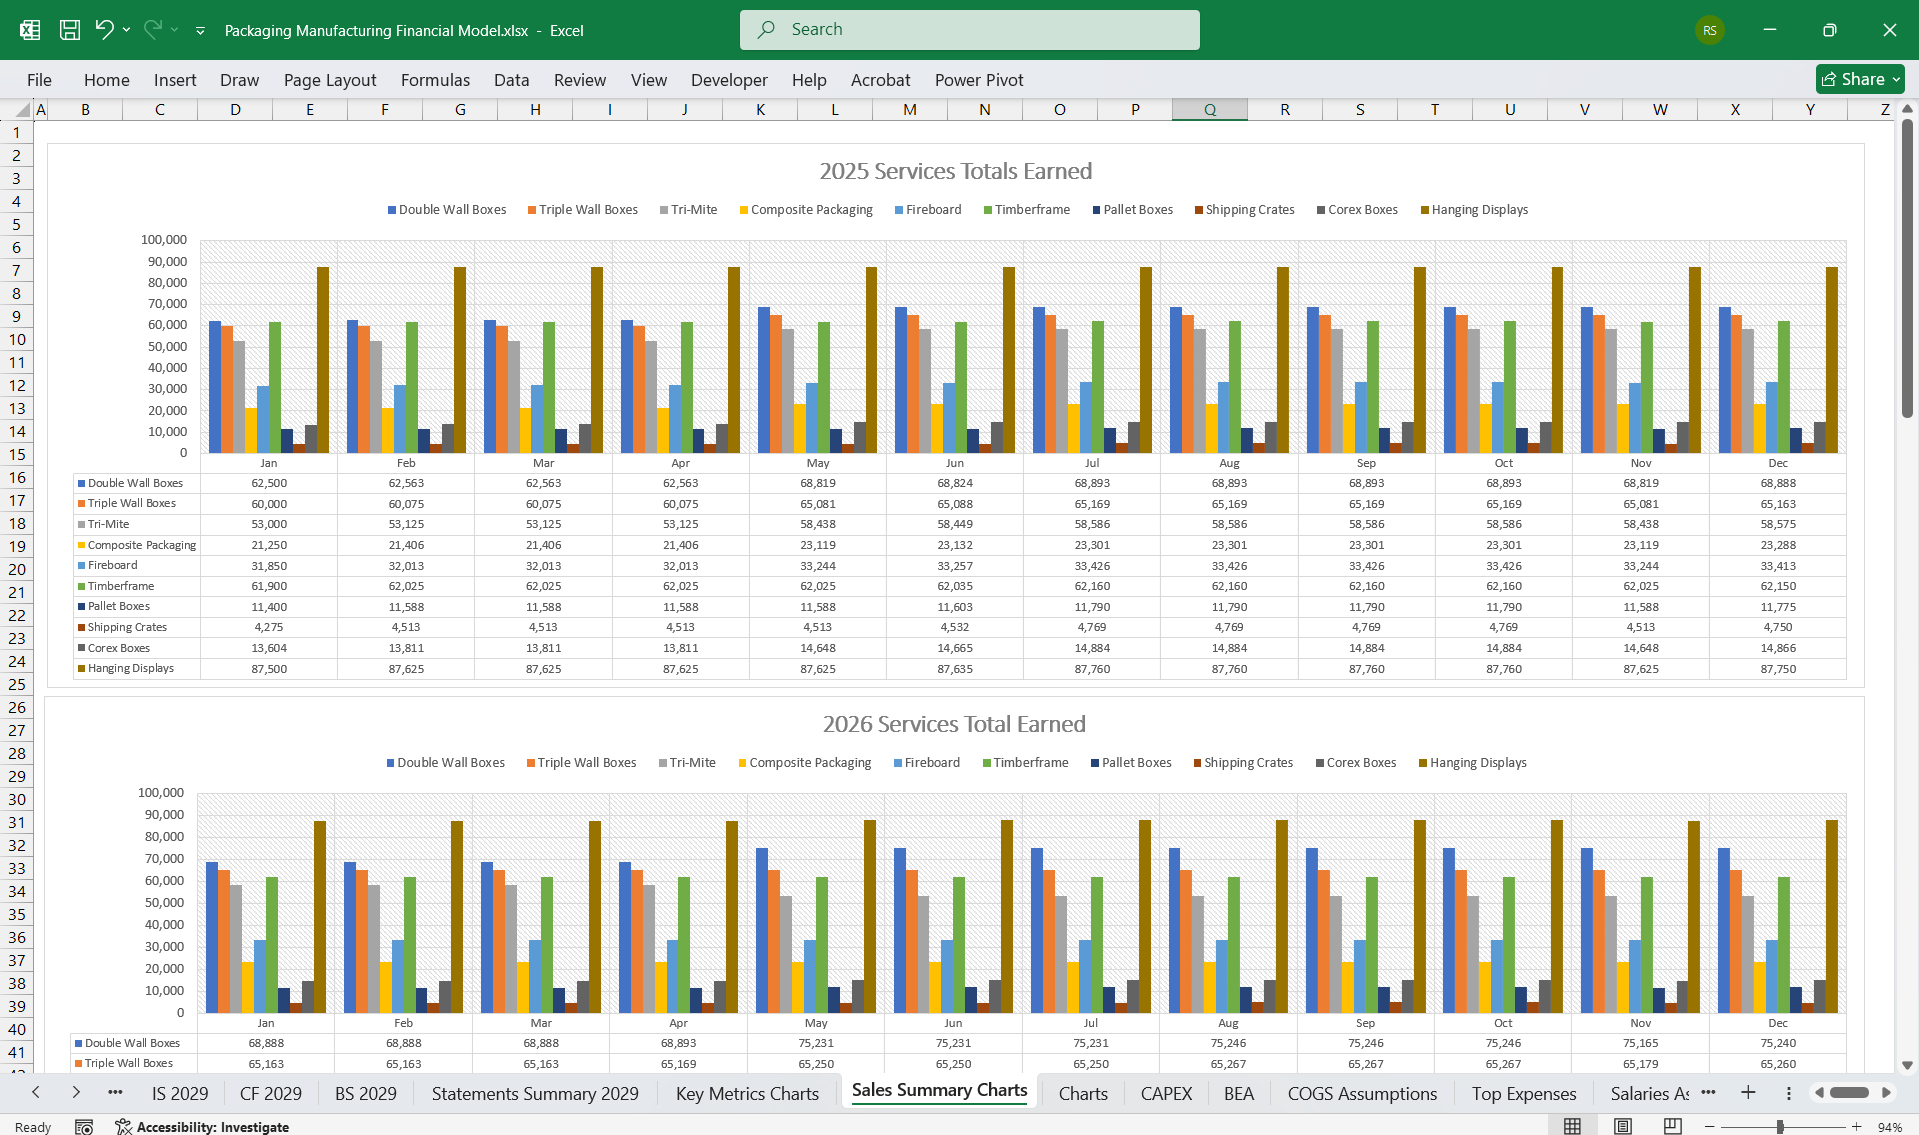
This financial model assesses a packaging company’s performance based on revenues from various packaging products, cost of production, operating expenses, and profitability. It includes detailed sections for possible revenue streams related to Double-Walled Boxes, Triple-Walled Boxes, Composite Packaging, Fiberboard Boxes, Pallet Boxes, Shipping Crates, and Corex Boxes. Operational metrics such as production costs, material sourcing, and sales volume drive the model.
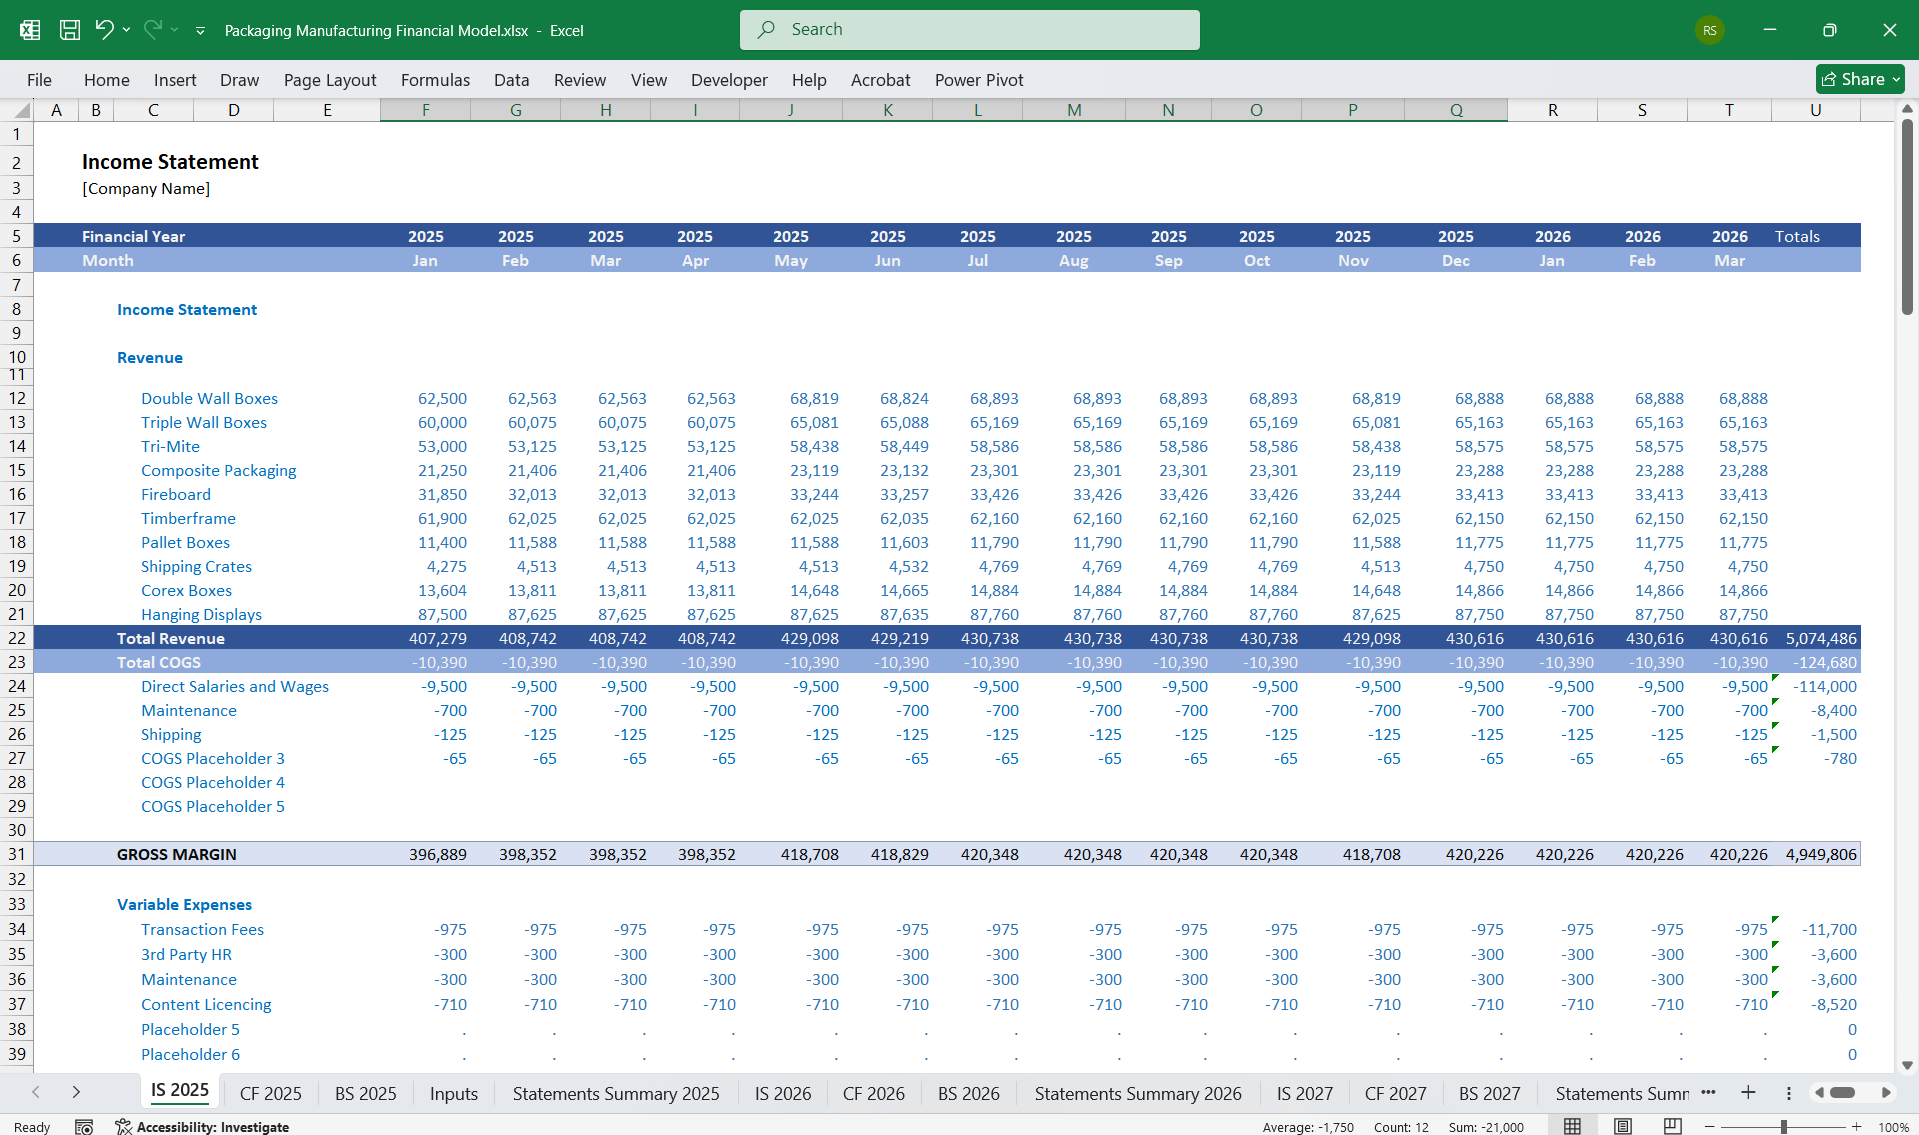
2. Income Statement
Possible Revenue Streams (All fully editable)
Product-Specific Sales Revenue:
Each product category contributes to revenue, modeled separately:- Double-Walled Boxes:
- Sold to medium to large businesses for moderate-strength needs.
- Revenue calculated as Units Sold × Price per Unit.
- Triple-Walled Boxes:
- Heavy-duty packaging for industrial uses.
- Higher pricing reflects durability and premium materials.
- Composite Packaging:
- Includes multi-material (e.g., plastic + fiber) solutions.
- Suited for specialized shipping, commands premium pricing.
- Fiberboard Boxes:
- Lightweight but sturdy boxes, popular for retail and small e-commerce.
- Priced lower but sold in higher volumes.
- Pallet Boxes:
- Used for large goods or bulk shipments.
- Typically sold to wholesalers or manufacturers.
- Shipping Crates:
- Heavy-duty wooden or composite crates for secure transport of goods.
- Includes custom design options, leading to varied pricing.
- Corex Boxes:
- Plastic corrugated boxes with superior durability.
- Used for reusability-focused industries such as healthcare and logistics.
Key Inputs for Each Product Category:
- Units sold.
- Average unit price.
- Seasonality impacts on demand.
- Double-Walled Boxes:
Add-On Revenue:
- Custom branding, logos, and print designs for packaging.
- Bulk discounts reducing per-unit revenue but increasing overall volume.
- Consulting and design services for custom solutions.
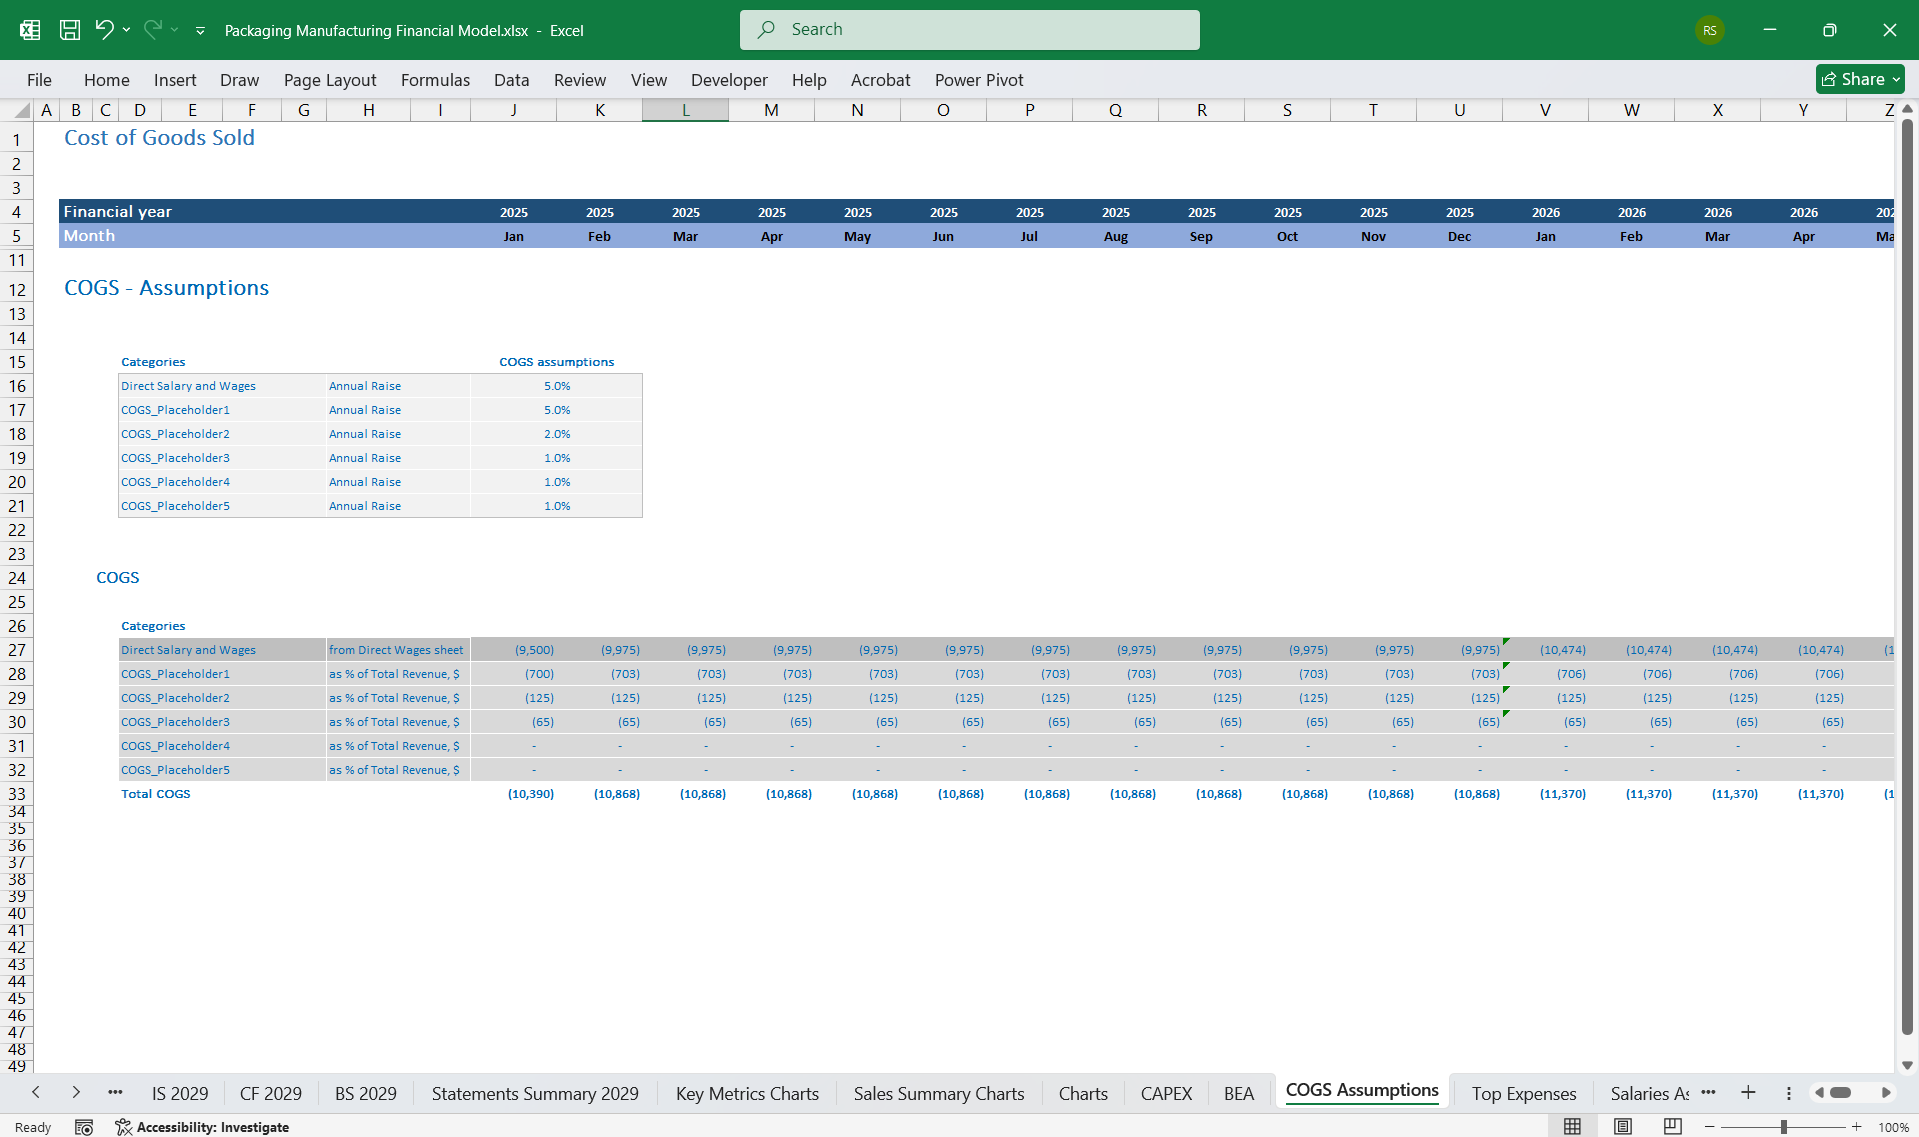
Cost of Goods Sold (COGS):
Direct costs of producing packaging. Components include:
- Raw Materials: Paperboard, corrugated cardboard, plastics, adhesives, wooden panels.
- Labor Costs: Manufacturing labor costs (variable with volume).
- Utilities: Power consumption for machinery.
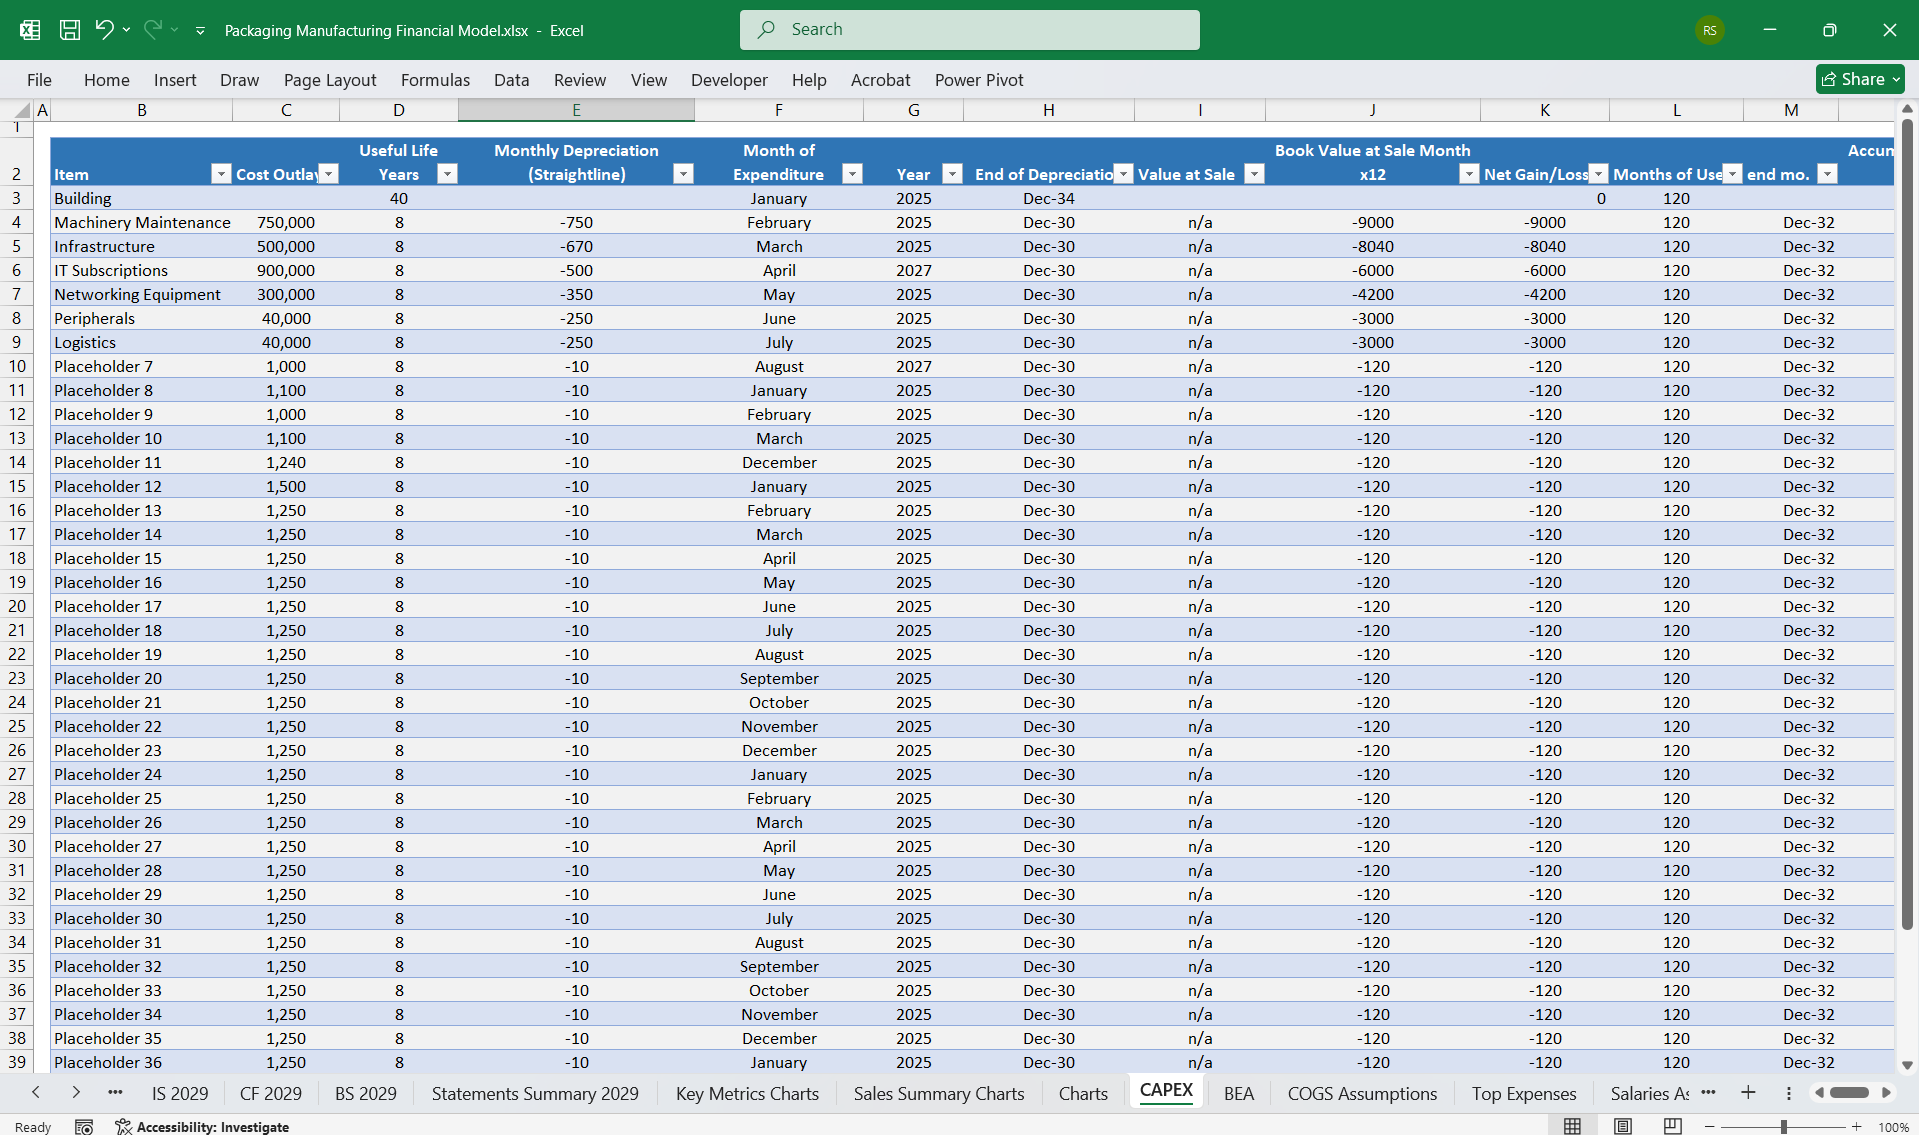
- Depreciation: Equipment depreciation attributed to production.
- Freight and Distribution Costs: Shipping finished products to clients.
Operating Expenses:
Costs not directly tied to production but necessary to operate. Components include:
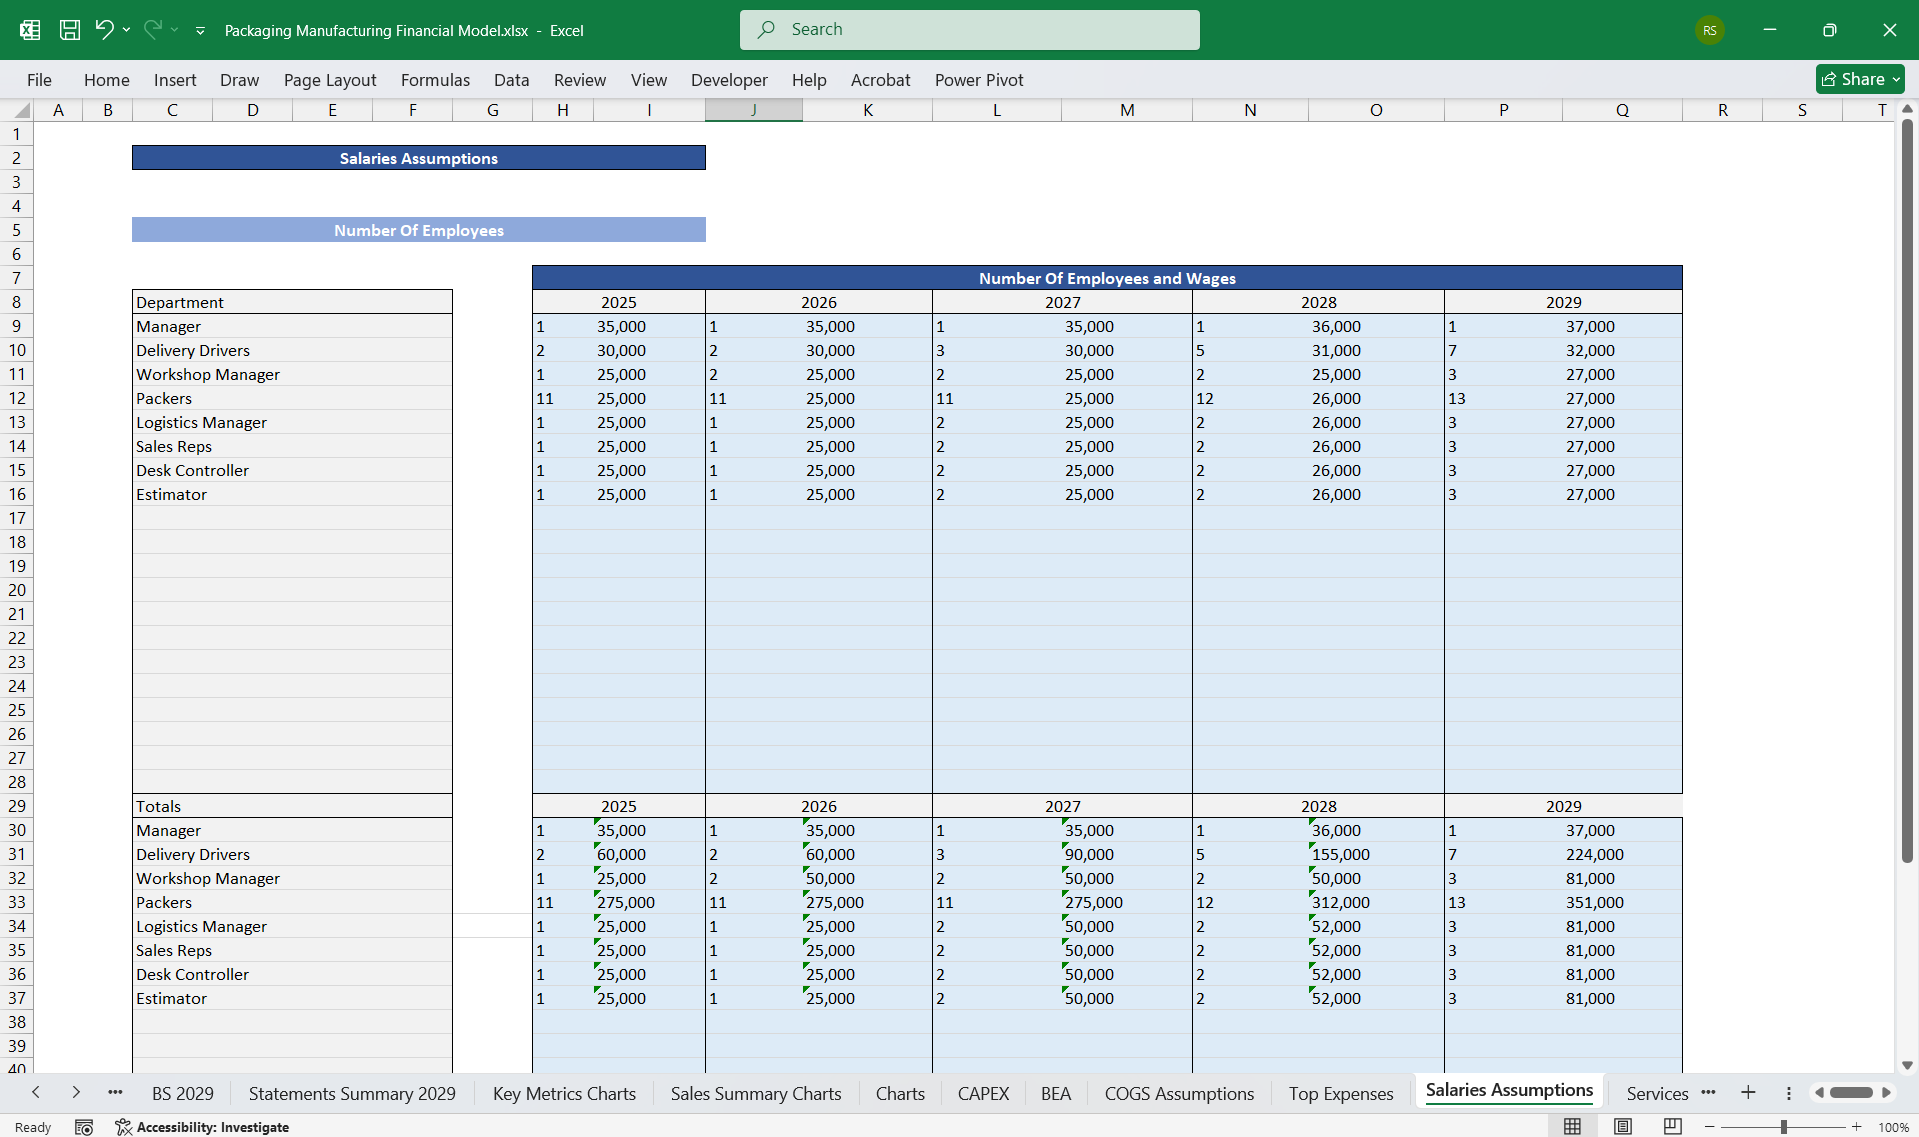
- Sales and Marketing: Branding, digital campaigns, sales team salaries, and commissions.
- Administrative Costs: Management salaries, rent, and utilities.
- R&D and Product Innovation: Developing sustainable or recyclable packaging options.
- IT Infrastructure: Systems for customer orders, invoicing, and supply chain management.
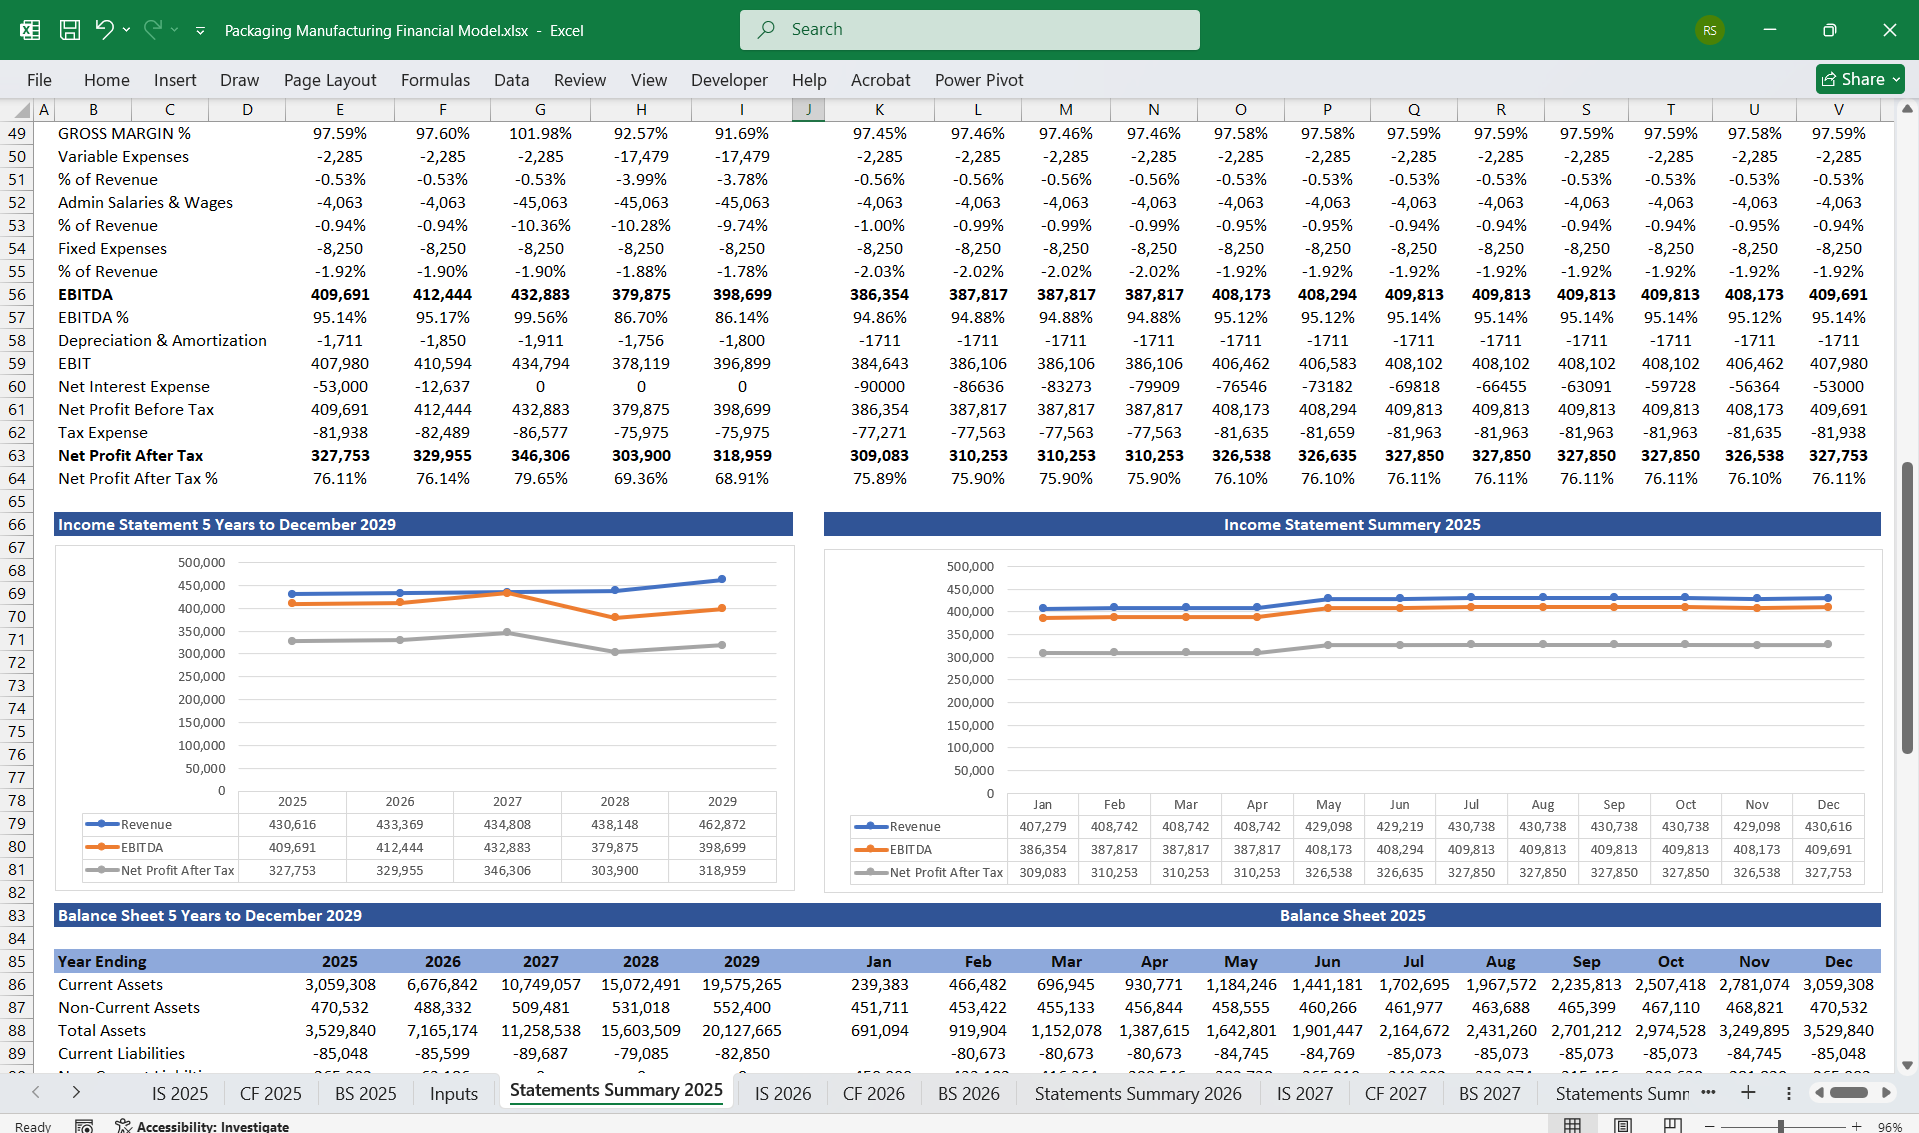
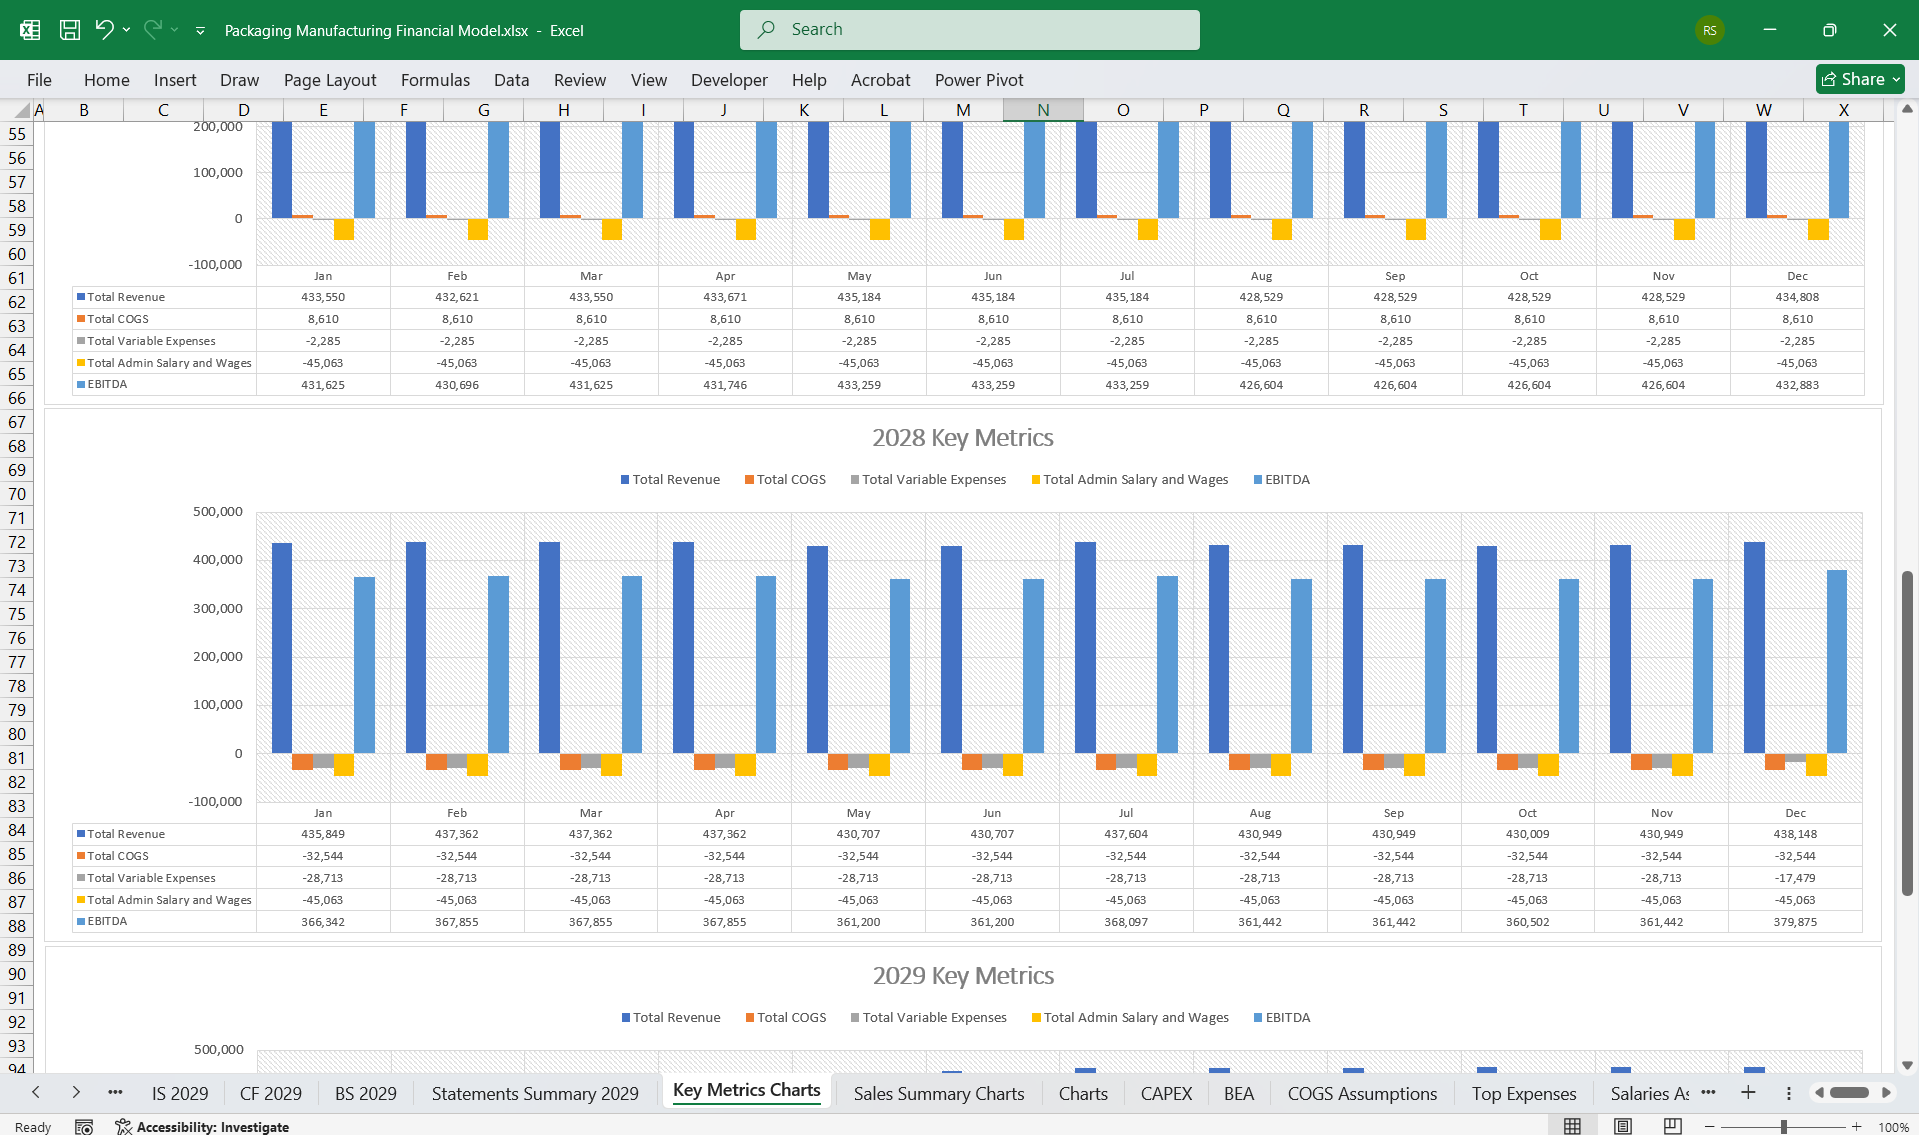
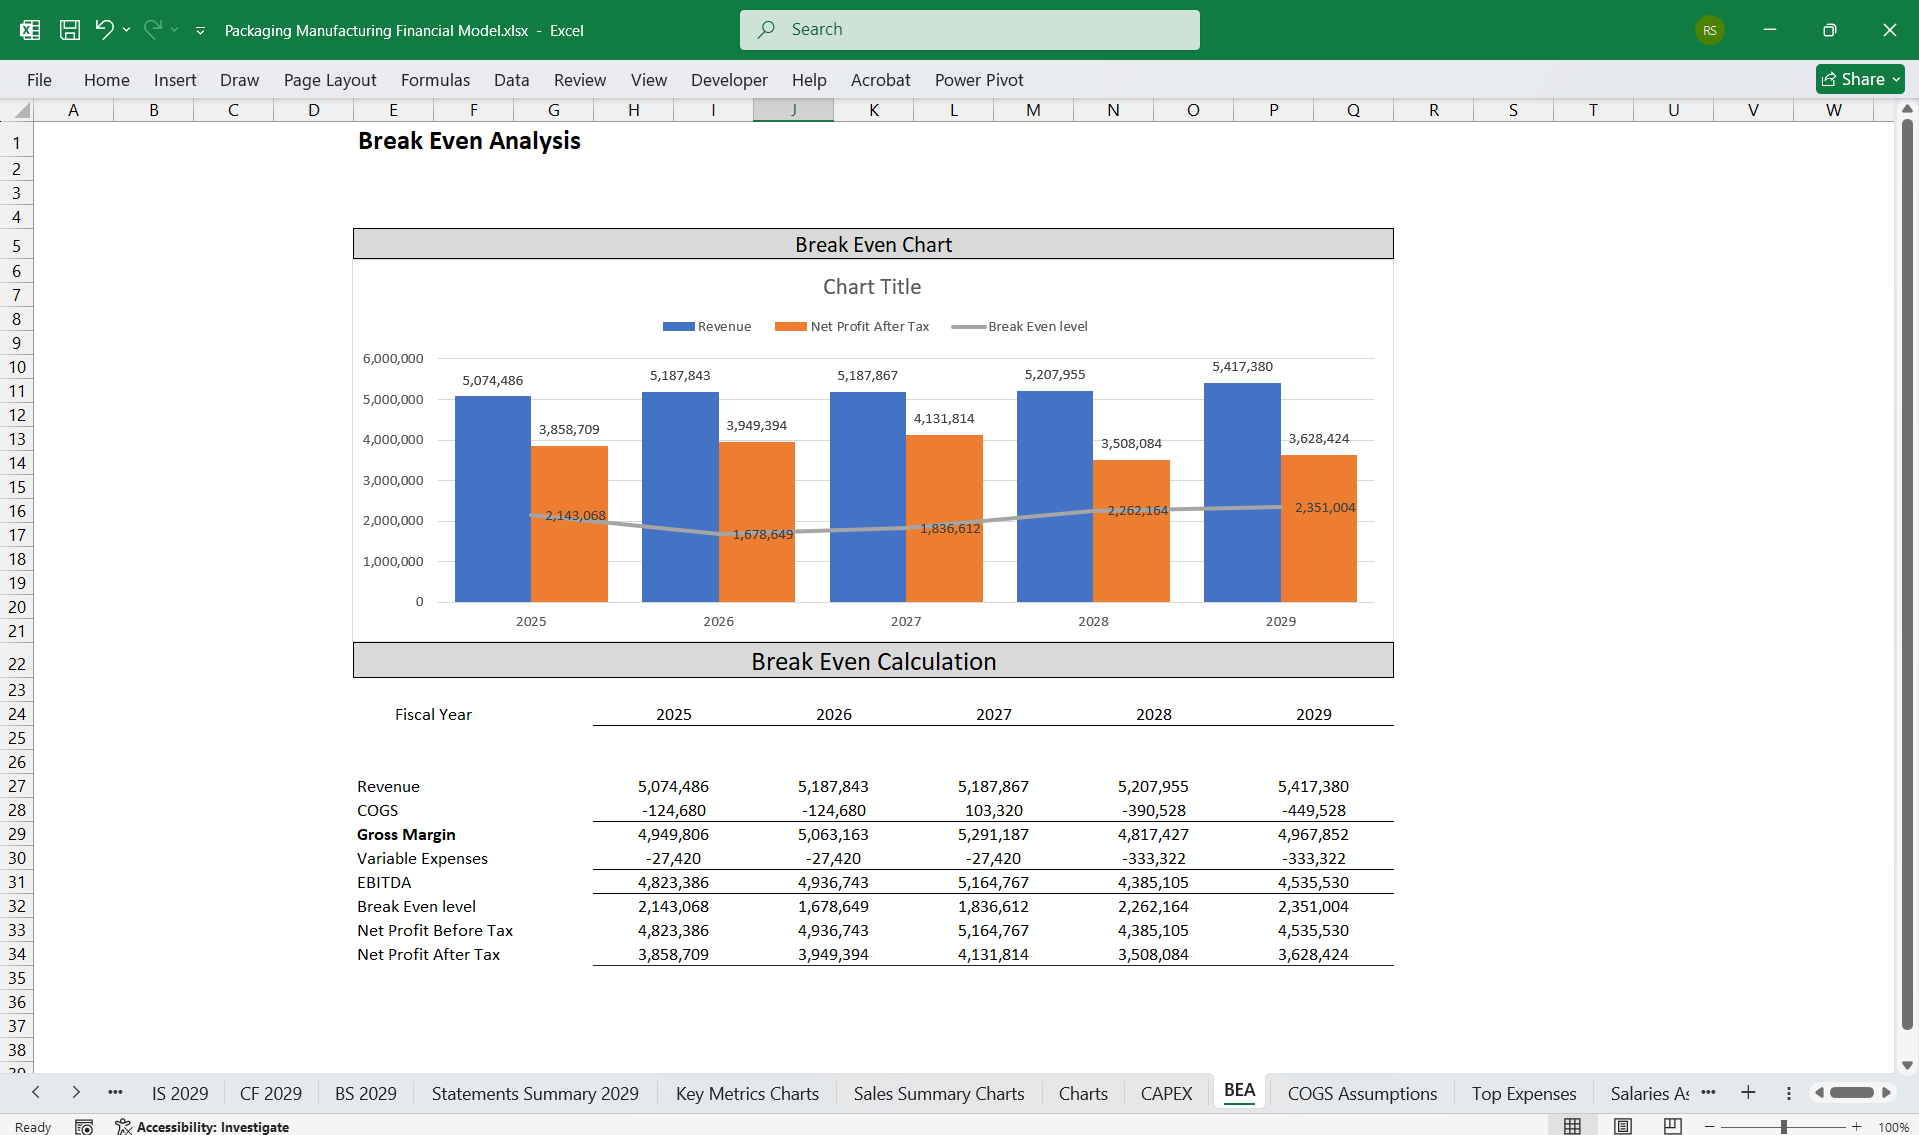
Profitability Metrics:
- Gross Profit = Revenue - COGS.
- Operating Profit = Gross Profit - Operating Expenses.
- Net Profit = Operating Profit - Taxes & Interest.
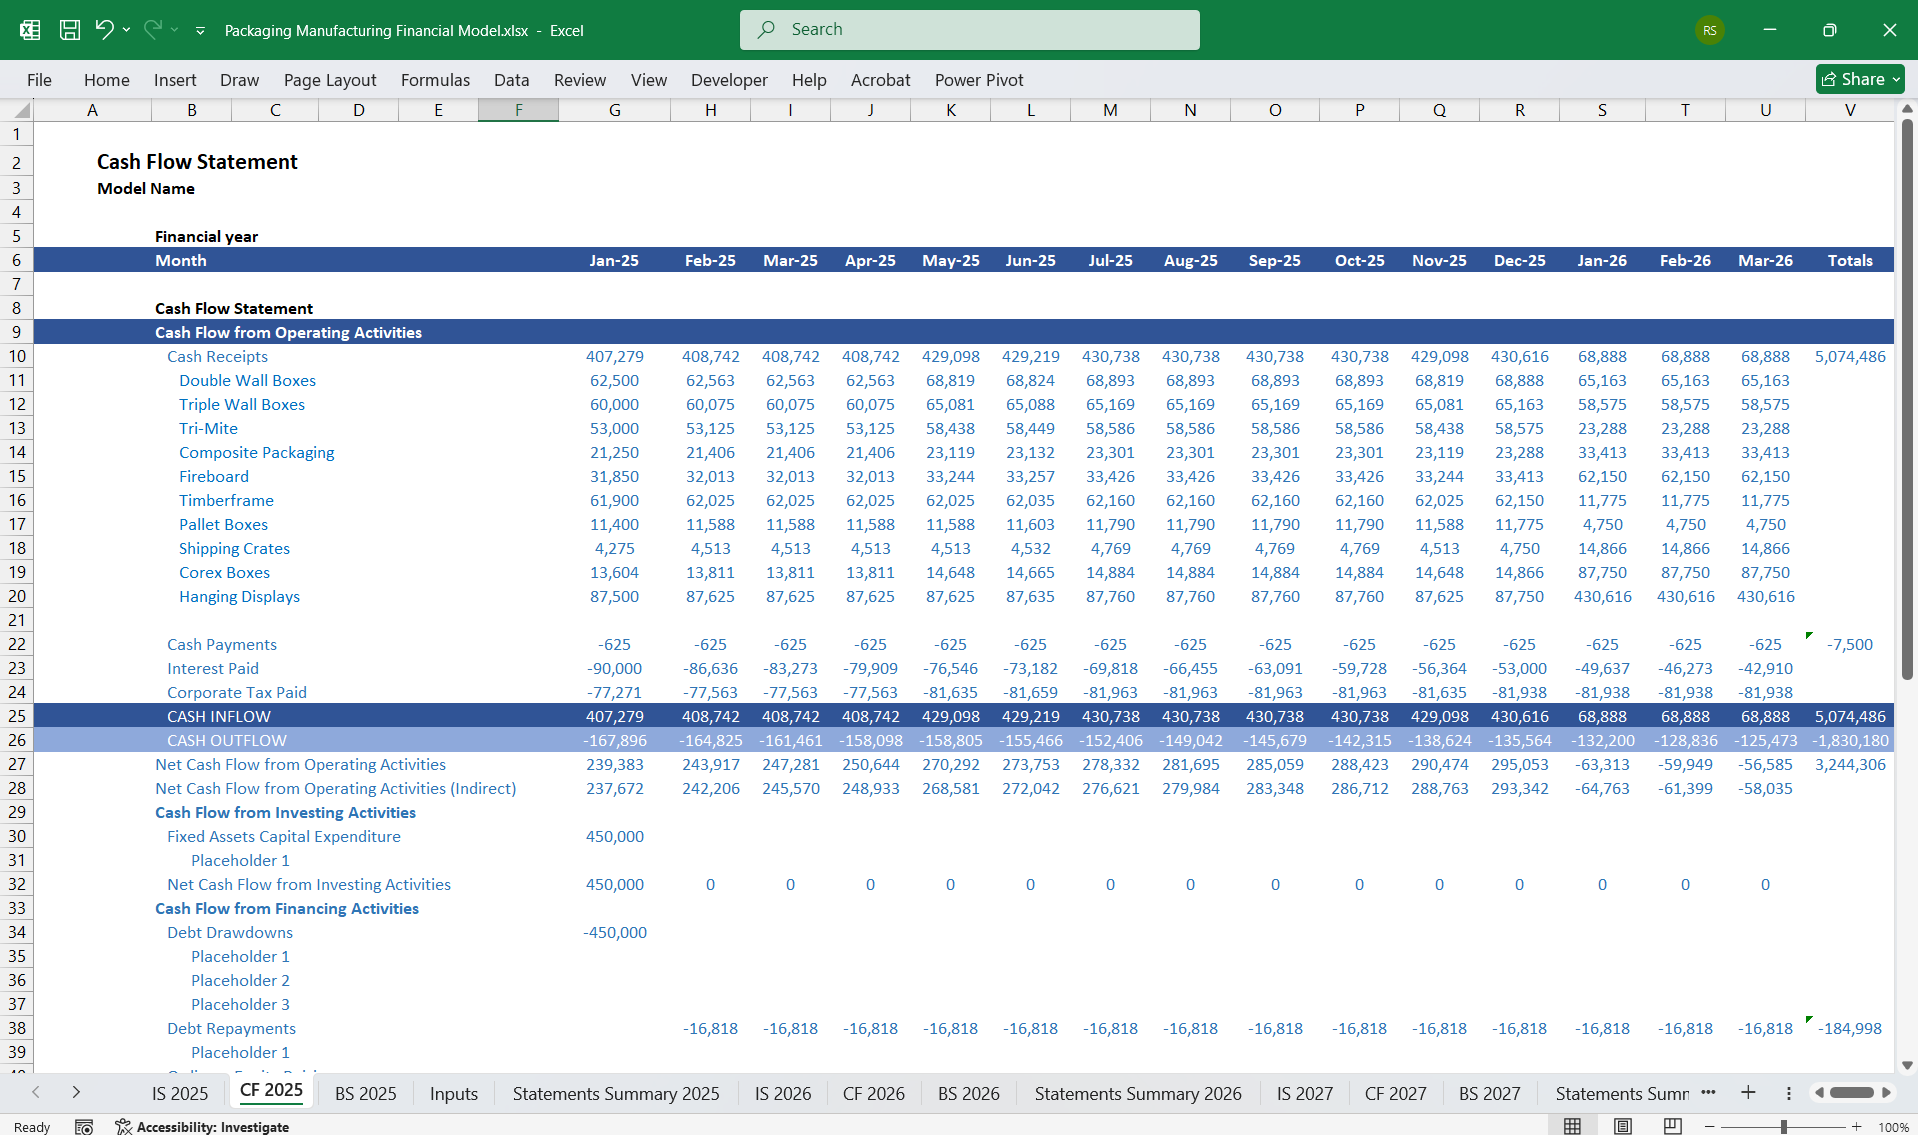
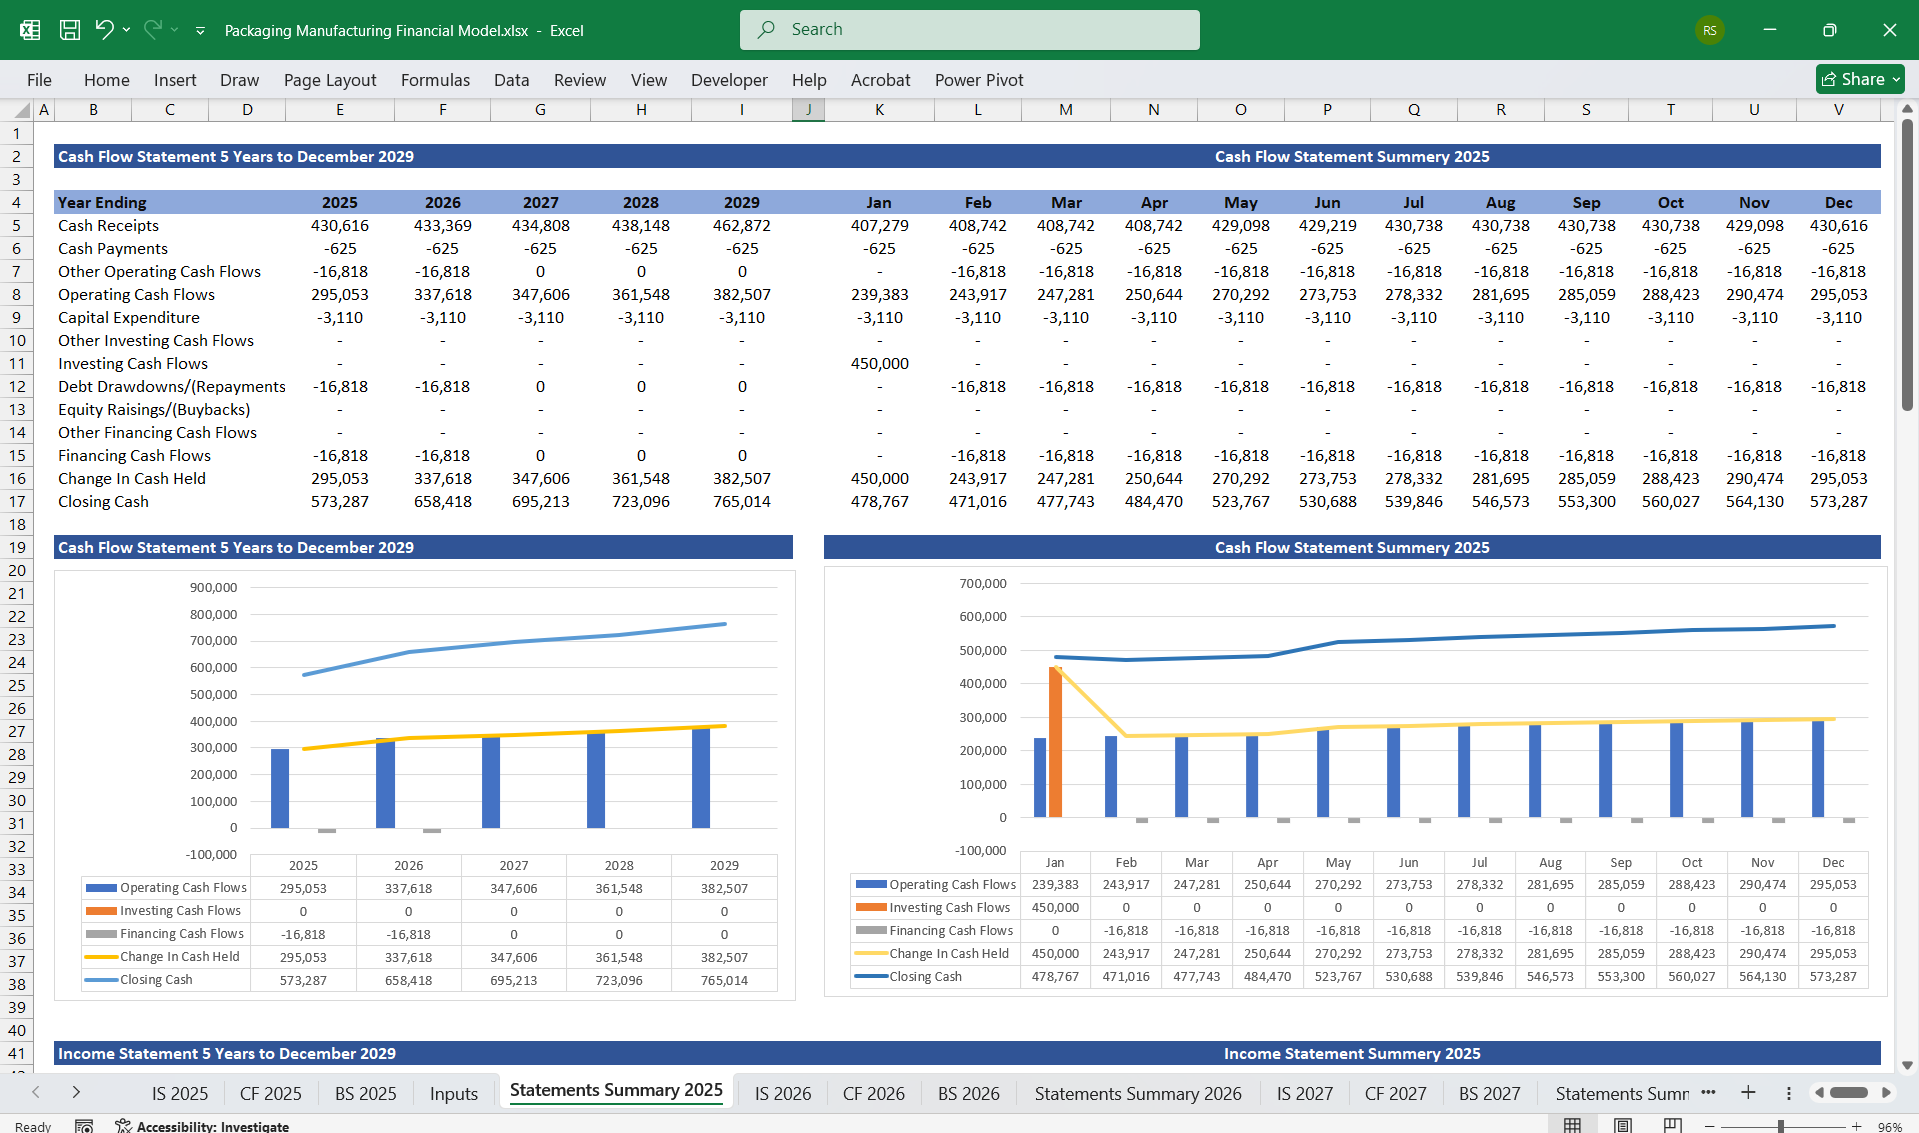
3. Cash Flow Statement
Cash Inflows:
- Sales of packaging products across categories.
- Payments for custom orders or add-on services.
- Advance payments from long-term clients.
- External funding (equity or loans).
Cash Outflows:
- Raw material procurement (monthly/quarterly based on production).
- Employee wages and benefits.
- Capital expenditures (machinery, warehouse upgrades, or automation).
- Marketing expenses.
- Loan repayments (principal + interest).
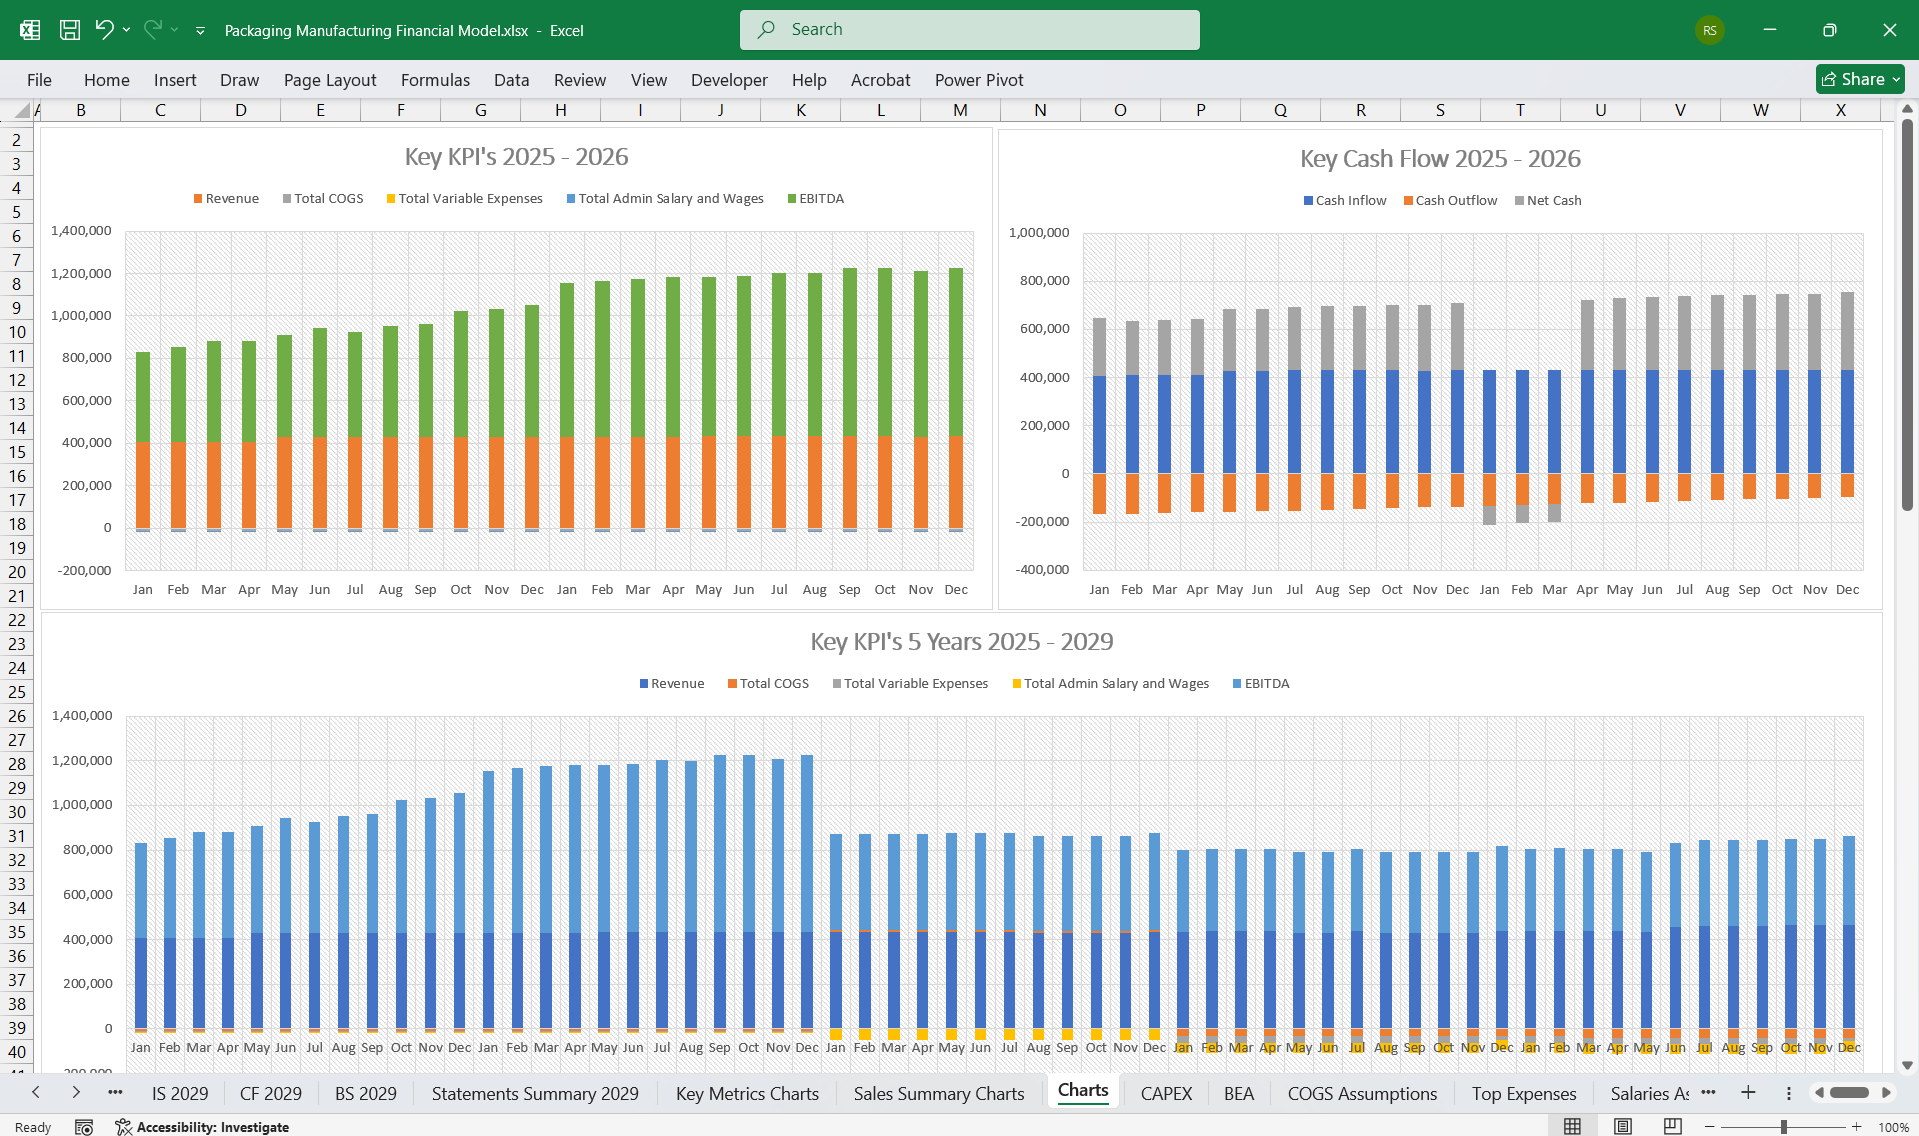
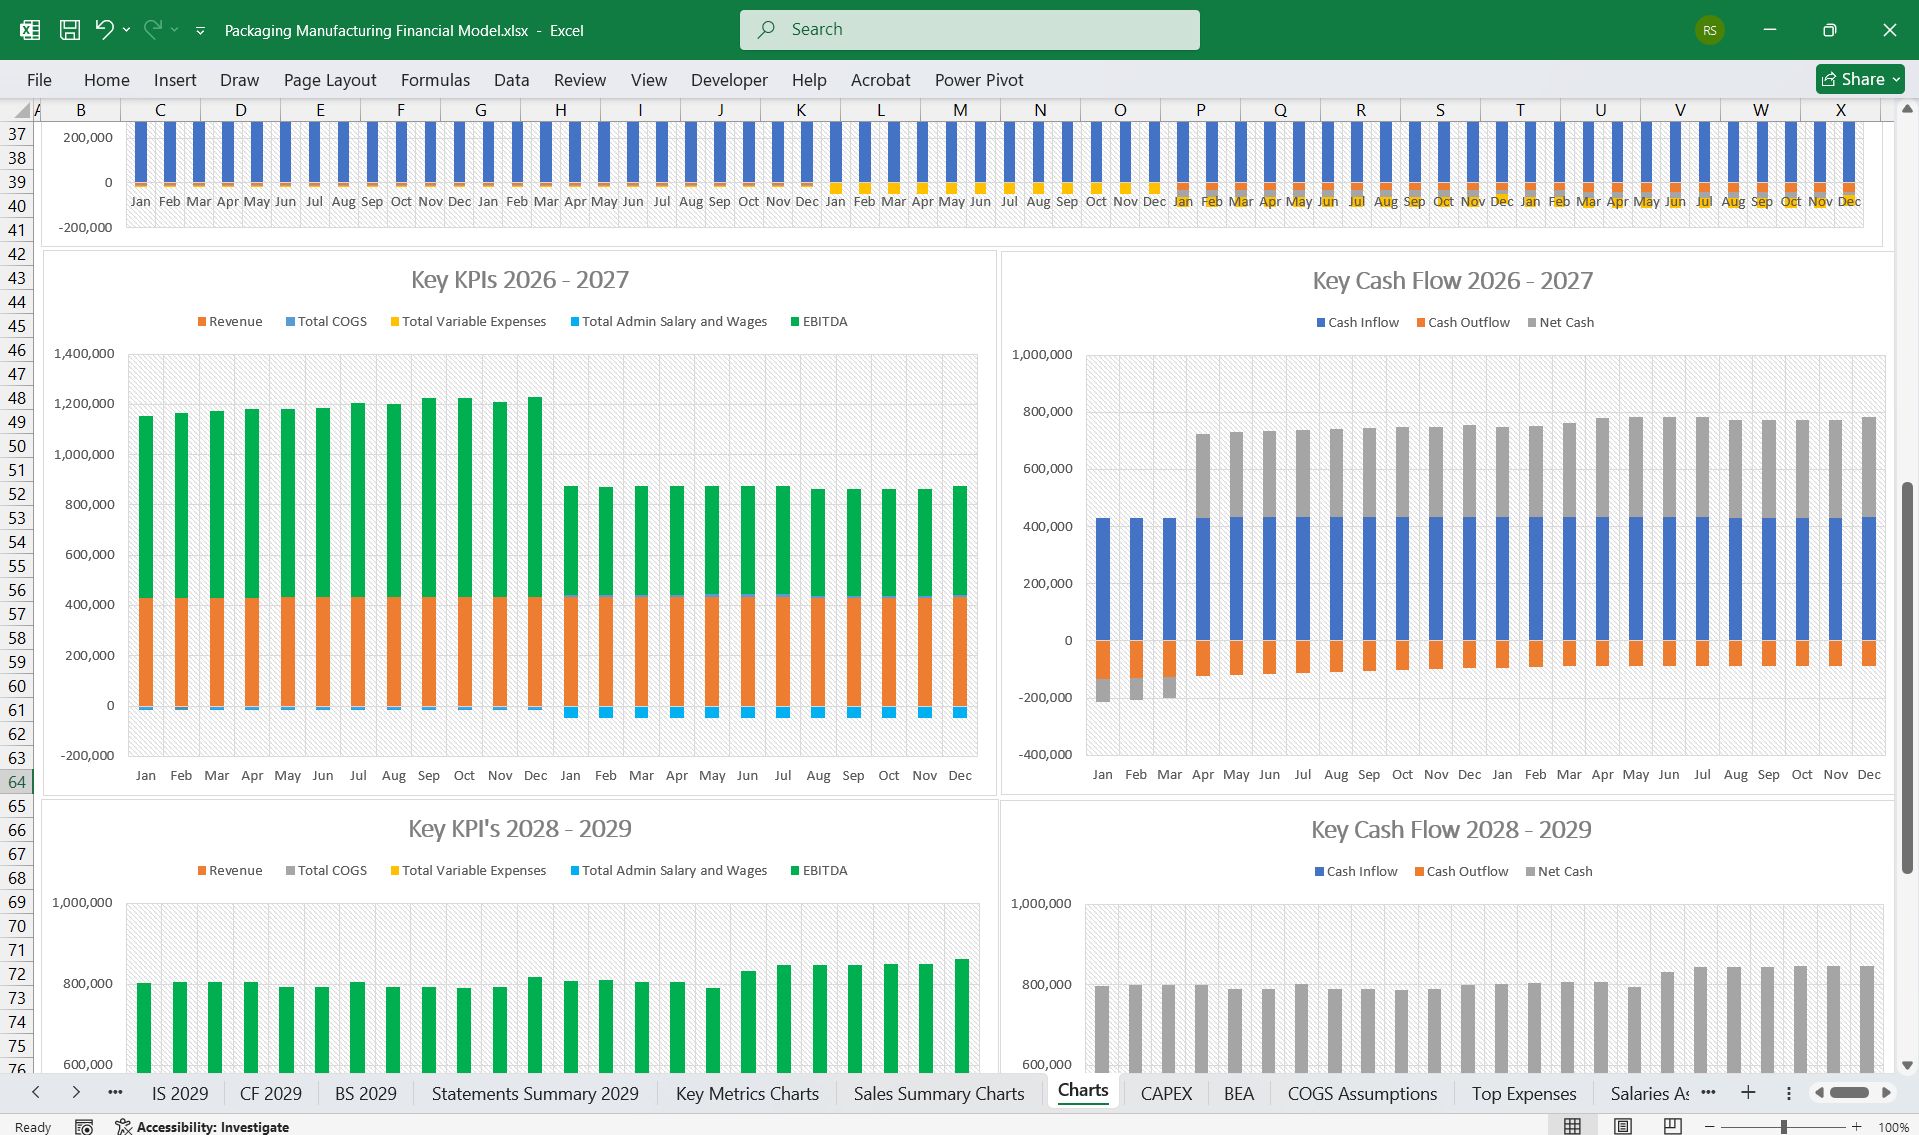
Net Cash Flow:
Calculated as Total Inflows - Total Outflows.
Key Metrics:
- Free Cash Flow = Operating Cash Flow - Capital Expenditures.
- Net Cash Burn = Outflows during initial phases (before positive cash flow).
- Days Payable Outstanding (DPO): Payment terms with vendors.
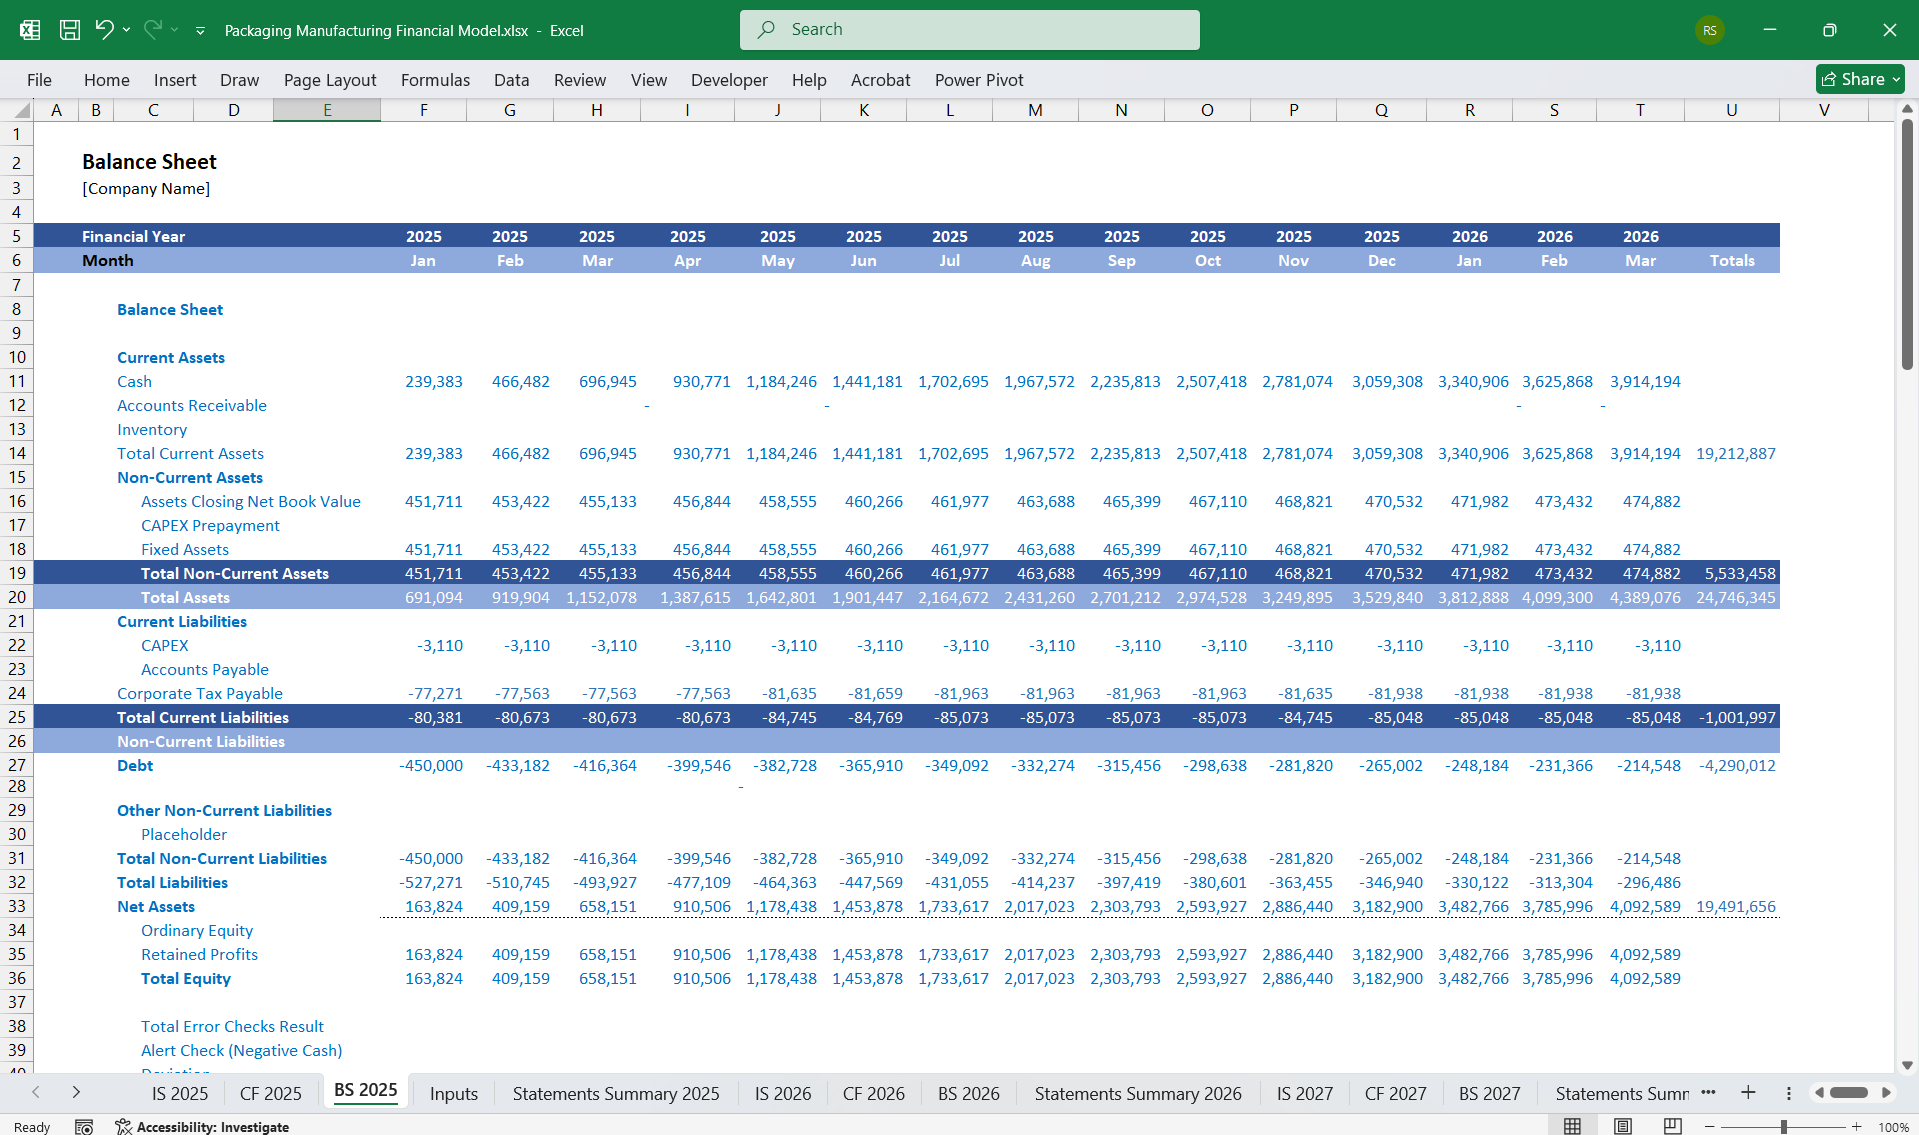
4. Balance Sheet
Assets:
- Current Assets:
- Cash and Cash Equivalents: Reserves for operational liquidity.
- Accounts Receivable: Payments due from clients for completed orders.
- Inventory: Raw materials and finished goods.
- Non-Current Assets:
- Factory equipment and machines for cutting, printing, and laminating.
- Warehouse spaces and storage systems.
- Intangible assets, like patents (if applicable) and proprietary designs.
Liabilities:
- Current Liabilities:
- Accounts payable (supplier payments).
- Accrued expenses (wages, utilities).
- Short-term loans or credit lines.
- Non-Current Liabilities:
- Long-term debt for factory upgrades or R&D.
- Lease liabilities for large warehouse facilities.
Equity:
- Owner’s investment + retained earnings from prior years.
5. Product-Specific Sections
Each product’s financial performance should include:
- Sales Volumes:
- Measured monthly and annually.
- Seasonal trends factored into predictions.
- Pricing Sensitivity:
- Low, medium, or high elasticity based on customer and market demand.
- Production Costs:
- Variable costs (e.g., material consumption per unit).
- Fixed costs (e.g., factory running costs).
6. Scenario Analysis
Scenarios:
- Best Case:
- Strong sales growth across all categories.
- Low raw material inflation and strong operational efficiency.
- Base Case:
- Moderate and steady growth with stable costs.
- Worst Case:
- Fluctuating raw material prices (e.g., wood, cardboard).
- Lower-than-expected volume growth, higher utility costs.
Sensitivity Analysis:
- Impact of raw material price fluctuations on gross margins.
- Revenue variation due to price changes for products.
- Customer churn rate in bulk buyer categories (e.g., manufacturing clients).
8. KPIs and Dashboards
Key Performance Indicators:
- Gross Profit Margin (GPM): (Revenue - COGS) ÷ Revenue.
- Manufacturing Efficiency: Units produced per hour/machine/day.
- Customer Retention Rate: Repeat buyers versus one-off clients.
- Average Order Value (AOV): Total Revenue ÷ Number of Orders.
- Production Downtime: Lost hours due to machine maintenance or labor shortages.
Dashboards:
- Real-time revenue tracking by product category.
- Cost breakdowns by raw materials, labor, and overheads.
- Inventory levels and turnover rates.
- Cash flow and profit trends.
This comprehensive model allows for robust tracking of all aspects of your packaging company's operations, ensuring scalability and profitability.
How to Use This in Word
- Copy all of the text above (starting from “Below is the same content...” through the last line).
- Open Microsoft Word (or any other word processor).
- Paste the text into a blank document.
- Adjust headings, fonts, and spacing as you wish.
This Best Practice includes
1 Excel Financial Model
Further information
Provides thorough oversight, tracking, and reporting of a Package Manufacturer's finances, including budget utilisation and projections updates.
