Originally published: 18/11/2020 09:33
Publication number: ELQ-65281-1
View all versions & Certificate
Publication number: ELQ-65281-1
View all versions & Certificate

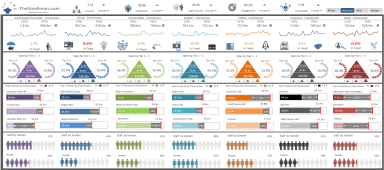
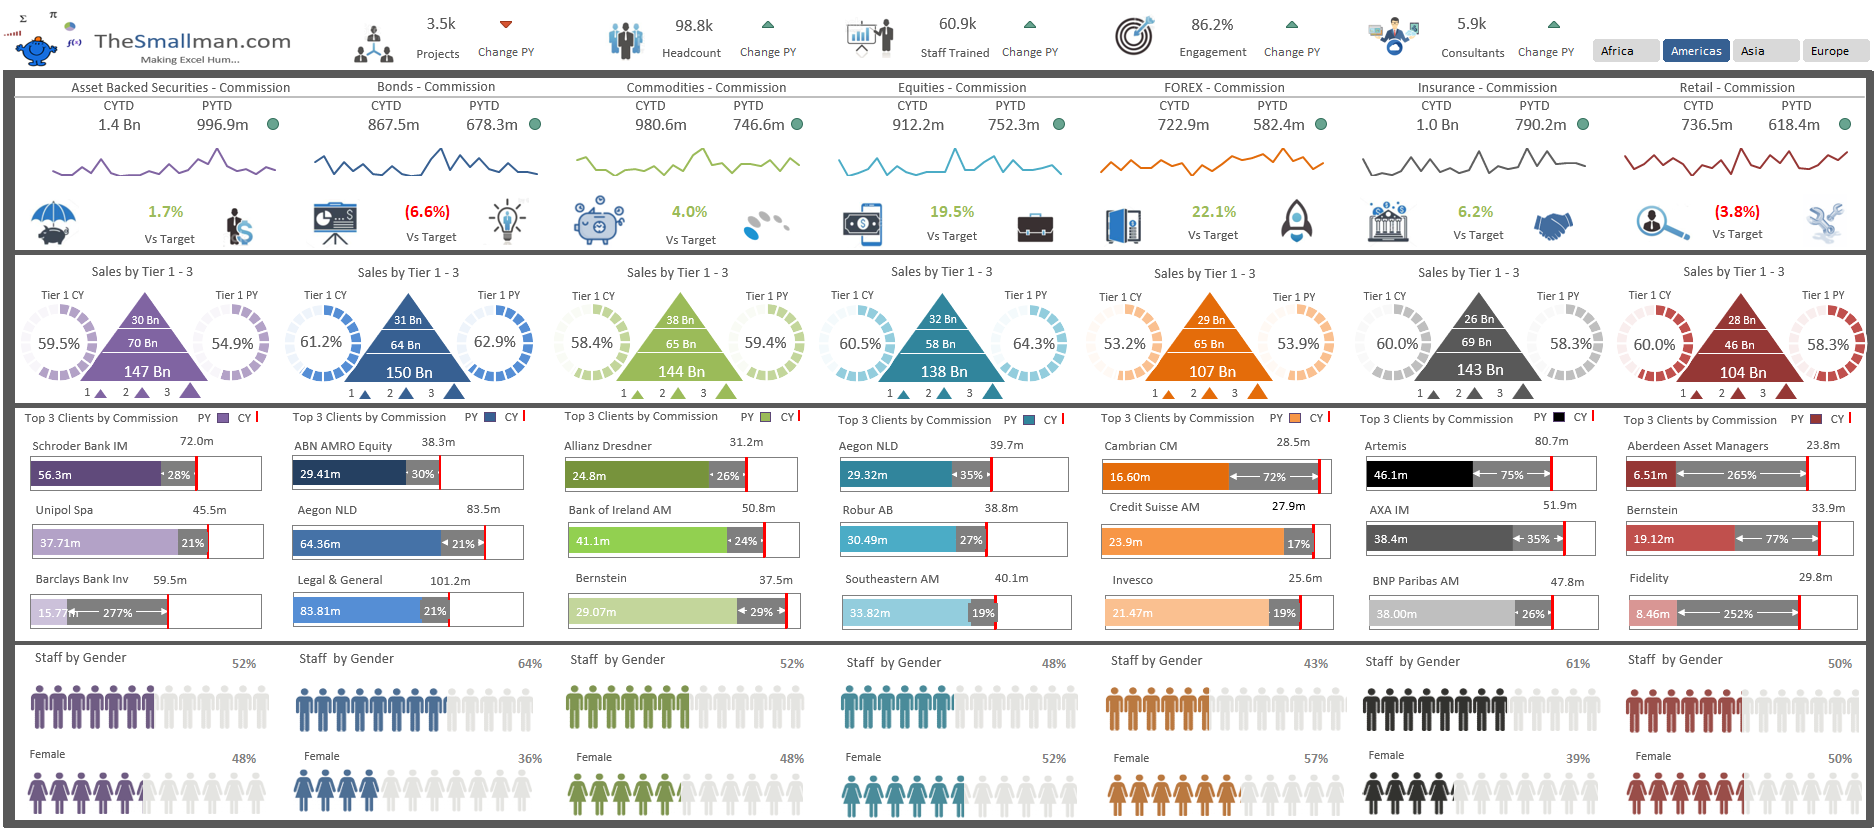
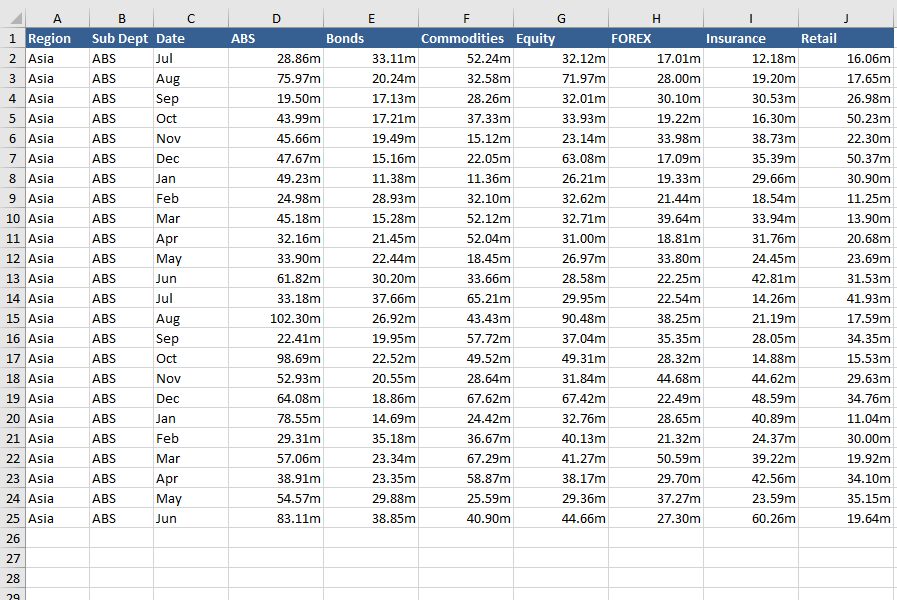
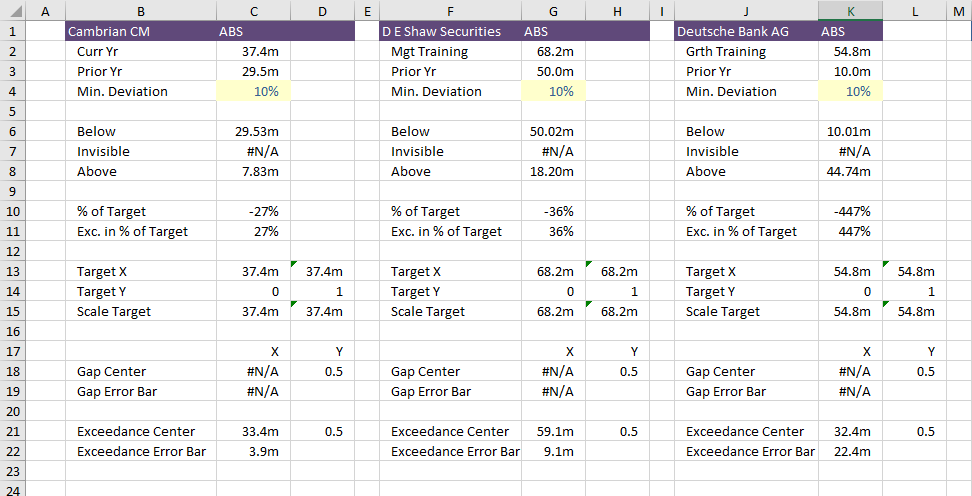
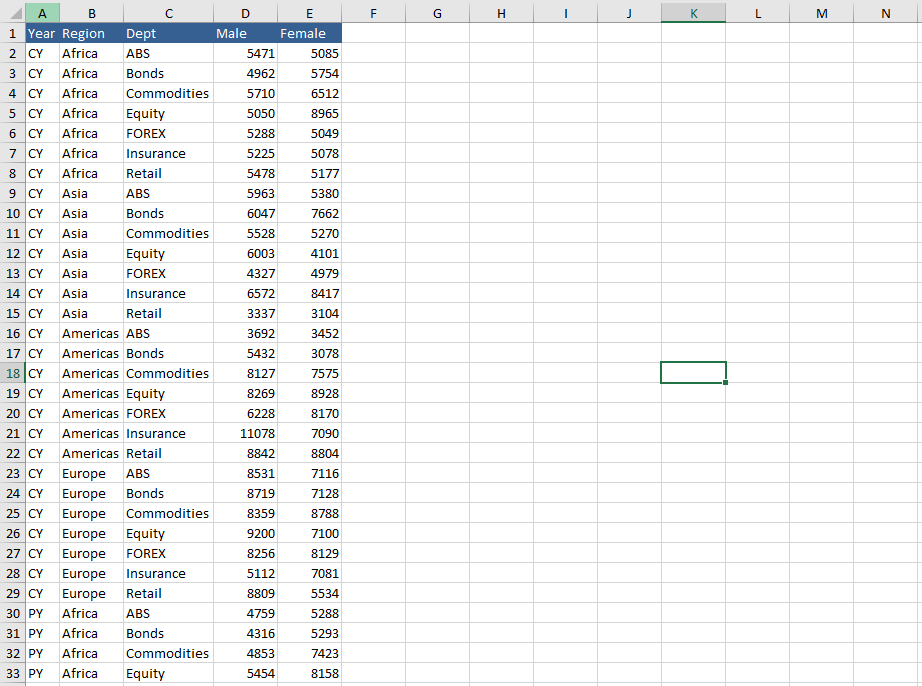
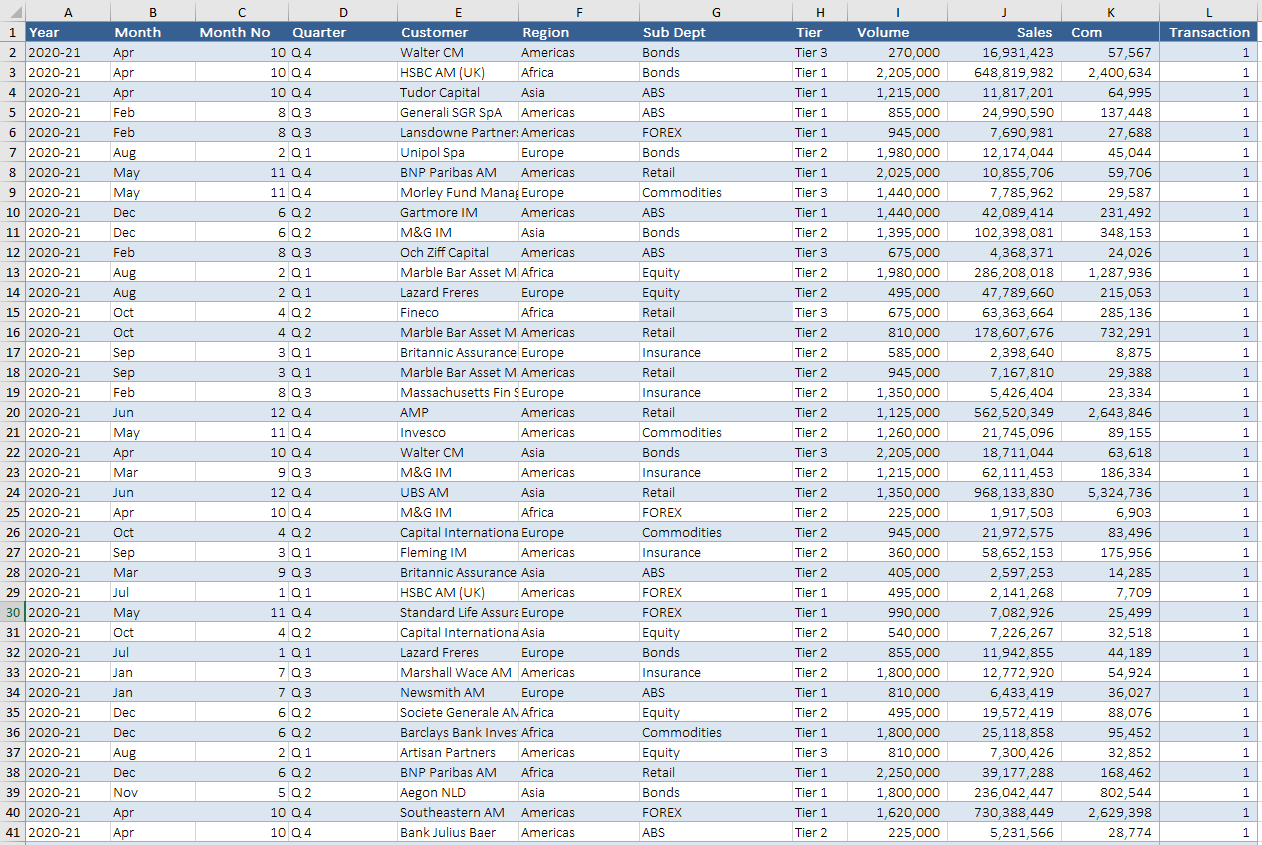
Company Dashboard by Department
An Excel dashboard that displays data by department and region.
Further information
Provide a one stop shop for key financial information in a clear succinct one pager.
Where ever succulent summaries are sought.
