
Originally published: 08/11/2023 09:03
Last version published: 09/09/2026 12:18
Publication number: ELQ-43118-2
View all versions & Certificate
Last version published: 09/09/2026 12:18
Publication number: ELQ-43118-2
View all versions & Certificate

Fourier Transformation Tool
HTML-based tool for the FFT analysis of your signal data.
Description
π FFT Signal Analyzer β Interactive HTML ToolBy Data'sOk
Find the hidden cycles in any time series β no Excel add-ins, no macros, nothing to enable.Every dataset with a time component has cycles buried in it: seasonality in sales, resonance in a vibration sensor, a recurring pattern in web traffic. A Fast Fourier Transform (FFT) finds them β but most Excel-based FFT tools depend on the Analysis ToolPak add-in, which isn't on by default, doesn't work in Excel Online, and is unreliable on Mac. This tool doesn't have that problem: it's a single self-contained HTML file with its own FFT engine built in JavaScript. Open it in any browser, on any device, and it just works.
WHAT YOU GET
A single interactive HTML file, fully unlocked:
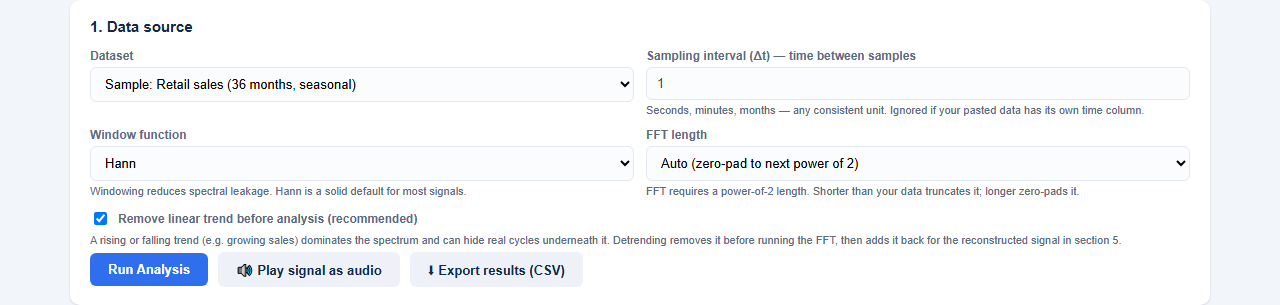
π₯ Flexible data input β paste one value per line, paste "time,value" pairs for irregular sampling, upload a CSV/TXT file, or start from one of three built-in sample datasets (retail sales seasonality, a machine vibration sensor, an audio tone mix).
π Automatic trend removal β a rising or falling trend (like growing sales) can bury a real seasonal cycle in the spectrum. One click removes it before analysis and adds it back for the reconstructed signal, so you see the real pattern, not an artifact.
ποΈ Windowing functions β Hann, Hamming, and Blackman windows to reduce spectral leakage, with plain-English guidance on when to use each.
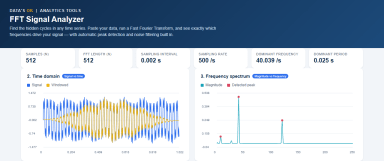
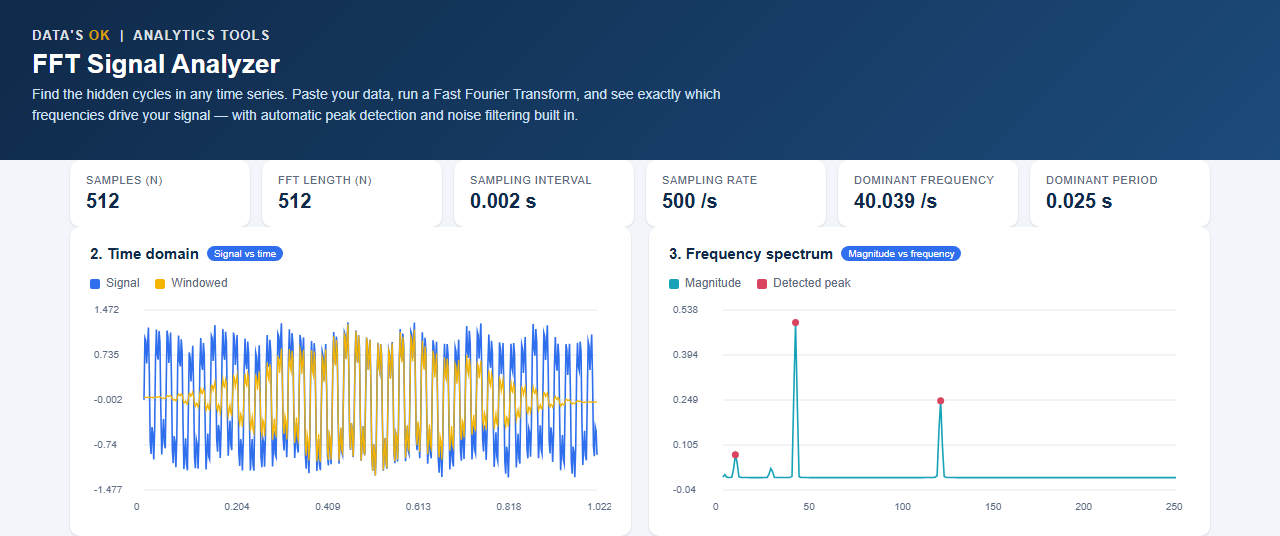
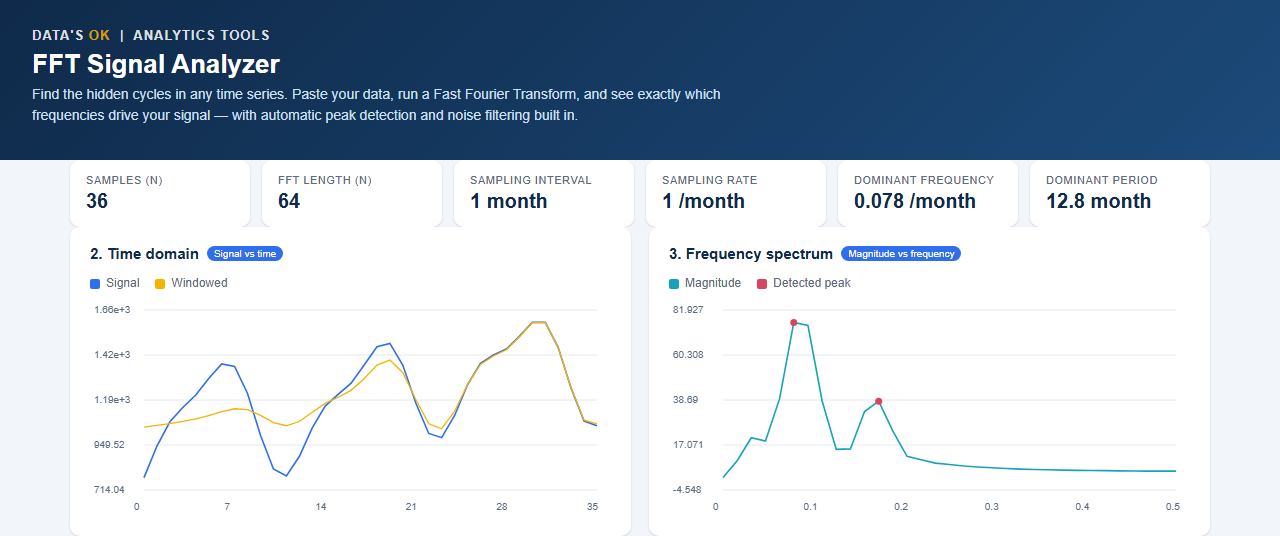
π Live time-domain and frequency-spectrum charts β see your signal and its spectrum side by side, redrawn instantly as you change settings.
π― Automatic cycle detection β the dominant frequencies are found and labeled for you, with frequency, period, magnitude, and share of total signal energy, so you don't have to eyeball a chart to find the peak.
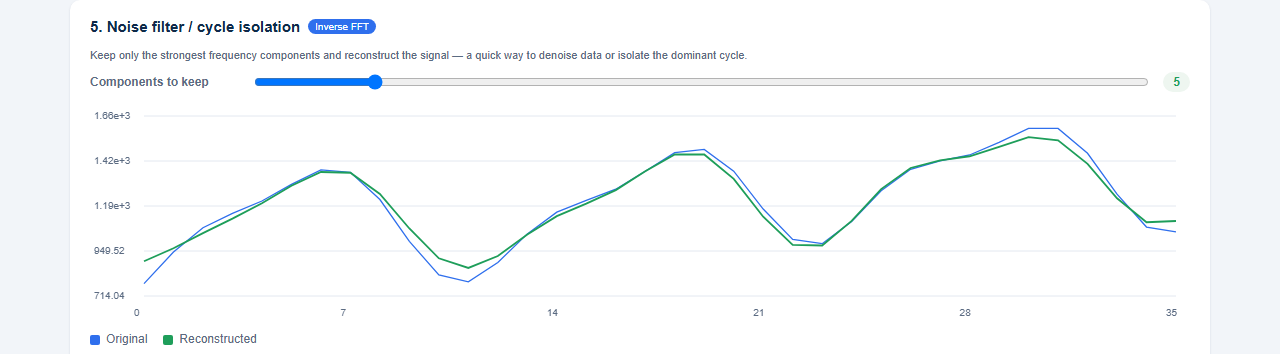
π§ Noise filter / cycle isolation β rebuild your signal using only its strongest frequency components with a single slider. A fast, visual way to denoise data or isolate one specific recurring cycle.
π Sonify your data β play any dataset as audio, a genuinely useful sanity-check for vibration and audio-style signals (and just fun on anything else).
β¬οΈ CSV export β download the full spectrum or the filtered/reconstructed signal for use elsewhere.
π Included user manual β a plain-English walkthrough of every option and how to read the results.
WHO IT'S FOR
β Analysts and category managers checking for seasonality in sales, demand, or web trafficβ Engineers and technicians reviewing vibration or sensor data for dominant frequenciesβ Anyone who has tried an Excel FFT tool before and hit an Analysis ToolPak errorβ Students and researchers who want a working FFT without setting up softwareβ Consultants who need a fast, presentable frequency analysis for a client.
WHY IT'S DIFFERENT
Most FFT tools on this marketplace are Excel files that quietly depend on an add-in most buyers don't have enabled β the single most common way an FFT template fails after purchase. This tool has no such dependency: it's real JavaScript running in your browser, tested against known signals for accuracy. It also goes further than a bare FFT β automatic peak labeling and one-click noise filtering are features you won't find in a plain spreadsheet version.No subscription. No software to install. No data uploaded anywhere β everything runs locally in your browser.
REQUIREMENTS
Any modern browser (Chrome, Edge, Firefox, Safari) on Windows, Mac, or Linux. No installation, no add-ins, no internet connection required after download.This Best Practice includes1 HTML file, 1 PDF/Word user manual.
π FFT Signal Analyzer β Interactive HTML ToolBy Data'sOk
Find the hidden cycles in any time series β no Excel add-ins, no macros, nothing to enable.Every dataset with a time component has cycles buried in it: seasonality in sales, resonance in a vibration sensor, a recurring pattern in web traffic. A Fast Fourier Transform (FFT) finds them β but most Excel-based FFT tools depend on the Analysis ToolPak add-in, which isn't on by default, doesn't work in Excel Online, and is unreliable on Mac. This tool doesn't have that problem: it's a single self-contained HTML file with its own FFT engine built in JavaScript. Open it in any browser, on any device, and it just works.
WHAT YOU GET
A single interactive HTML file, fully unlocked:
π₯ Flexible data input β paste one value per line, paste "time,value" pairs for irregular sampling, upload a CSV/TXT file, or start from one of three built-in sample datasets (retail sales seasonality, a machine vibration sensor, an audio tone mix).
π Automatic trend removal β a rising or falling trend (like growing sales) can bury a real seasonal cycle in the spectrum. One click removes it before analysis and adds it back for the reconstructed signal, so you see the real pattern, not an artifact.
ποΈ Windowing functions β Hann, Hamming, and Blackman windows to reduce spectral leakage, with plain-English guidance on when to use each.
π Live time-domain and frequency-spectrum charts β see your signal and its spectrum side by side, redrawn instantly as you change settings.
π― Automatic cycle detection β the dominant frequencies are found and labeled for you, with frequency, period, magnitude, and share of total signal energy, so you don't have to eyeball a chart to find the peak.
π§ Noise filter / cycle isolation β rebuild your signal using only its strongest frequency components with a single slider. A fast, visual way to denoise data or isolate one specific recurring cycle.
π Sonify your data β play any dataset as audio, a genuinely useful sanity-check for vibration and audio-style signals (and just fun on anything else).
β¬οΈ CSV export β download the full spectrum or the filtered/reconstructed signal for use elsewhere.
π Included user manual β a plain-English walkthrough of every option and how to read the results.
WHO IT'S FOR
β Analysts and category managers checking for seasonality in sales, demand, or web trafficβ Engineers and technicians reviewing vibration or sensor data for dominant frequenciesβ Anyone who has tried an Excel FFT tool before and hit an Analysis ToolPak errorβ Students and researchers who want a working FFT without setting up softwareβ Consultants who need a fast, presentable frequency analysis for a client.
WHY IT'S DIFFERENT
Most FFT tools on this marketplace are Excel files that quietly depend on an add-in most buyers don't have enabled β the single most common way an FFT template fails after purchase. This tool has no such dependency: it's real JavaScript running in your browser, tested against known signals for accuracy. It also goes further than a bare FFT β automatic peak labeling and one-click noise filtering are features you won't find in a plain spreadsheet version.No subscription. No software to install. No data uploaded anywhere β everything runs locally in your browser.
REQUIREMENTS
Any modern browser (Chrome, Edge, Firefox, Safari) on Windows, Mac, or Linux. No installation, no add-ins, no internet connection required after download.This Best Practice includes1 HTML file, 1 PDF/Word user manual.
This Best Practice includes
1 HTML file, 1 csv file, 1 PDF file.
Further information
The tool converts a signal into individual spectral components and thereby provides frequency information about the signal. Besides, FFT can be applied to data series in order to identify their cyclical pattern and use it for forecasting purposes.
