
Originally published: 02/08/2023 13:26
Publication number: ELQ-29227-1
View all versions & Certificate
Publication number: ELQ-29227-1
View all versions & Certificate

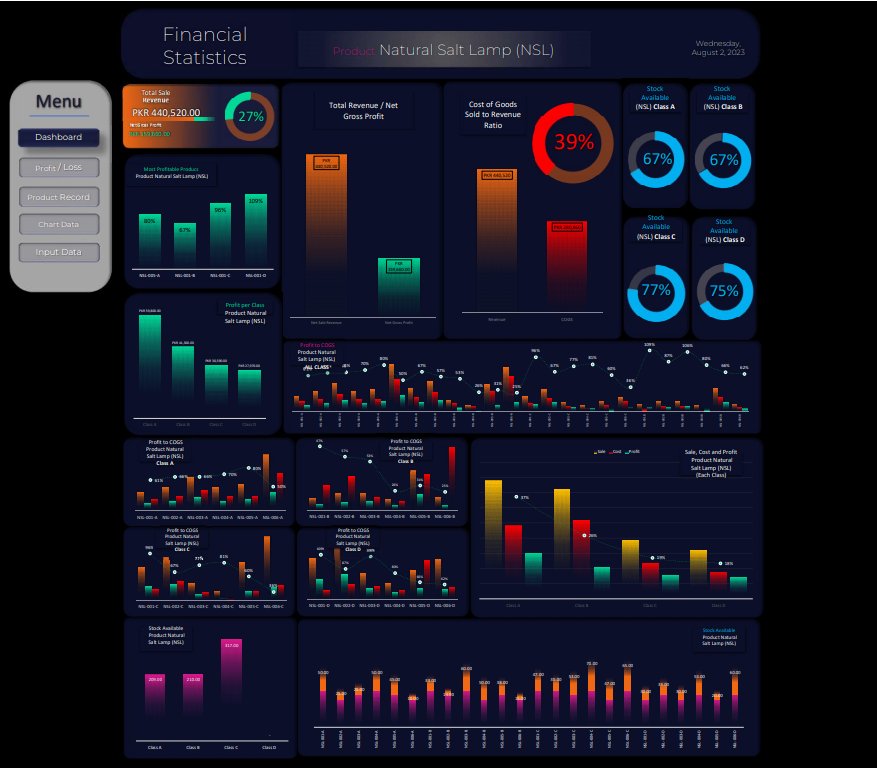
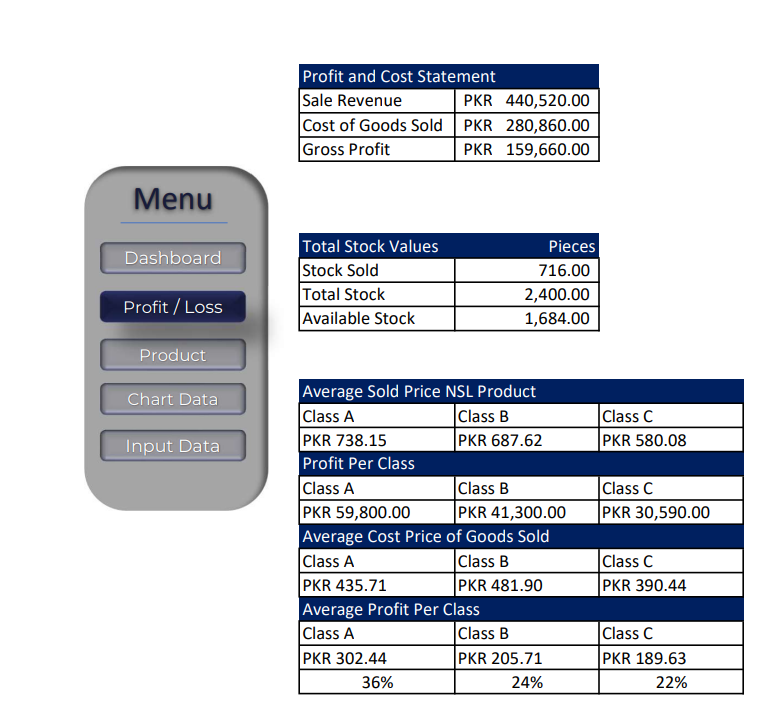
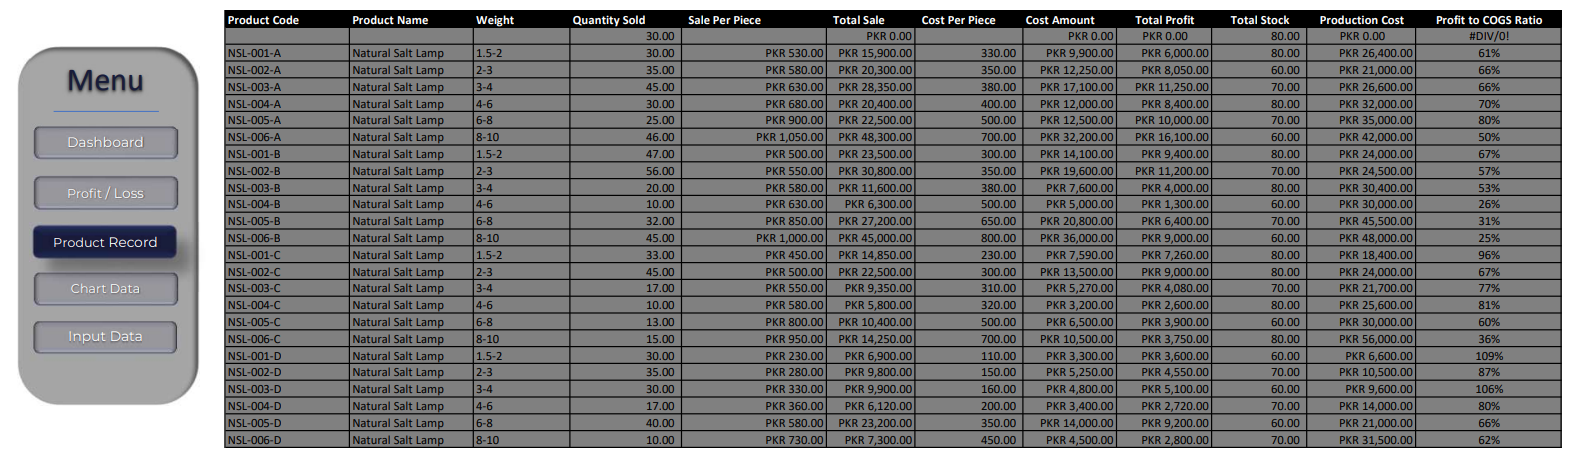
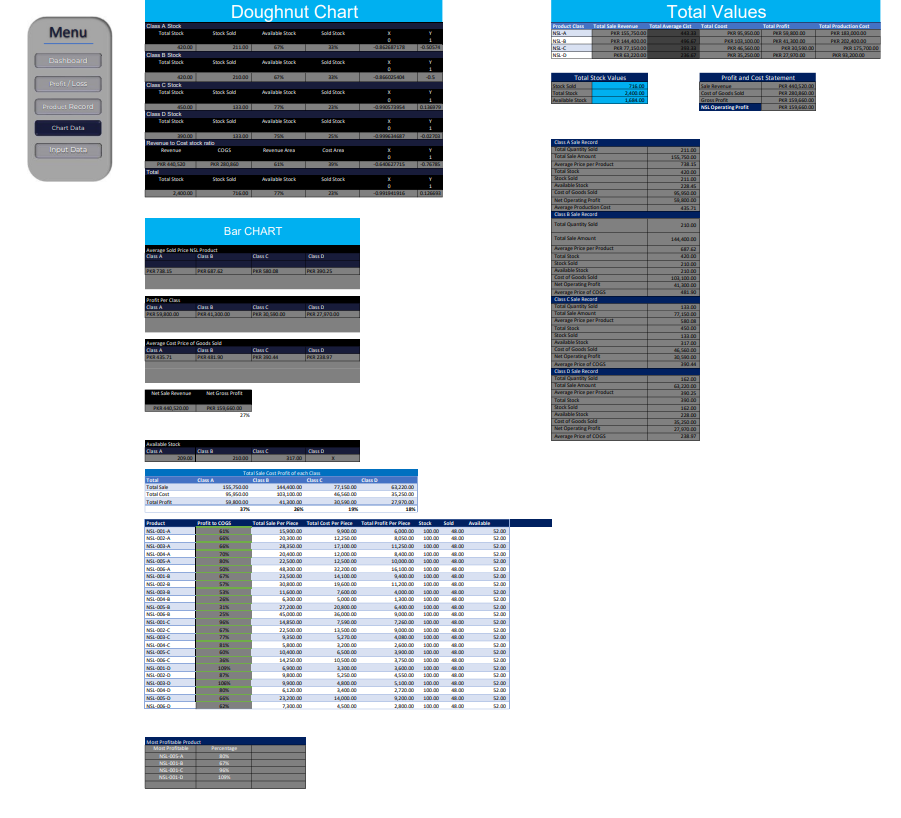
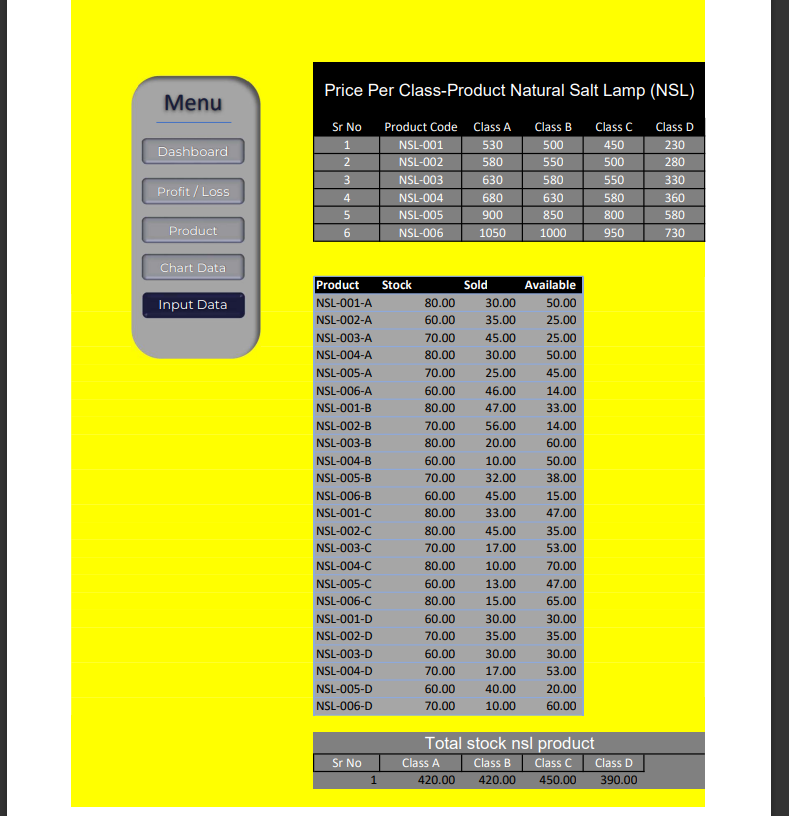
Dashboard: Products Profit and Loss and Available Stock Managment Excel Sheet Version 1.01
Sales, Stock Management and Product Performance Colorful Dashboard. Version 1.0
Ex-Bank Manager United Bank Limited and Muslim Islamic Bank of Pakistan. MBA (Finance) from International Islamic University, Islamabad.Follow
Further information
Stock Performance Managment and Financial Statistics (Month-wise)
