Oil & Gas Production Dashboard – Excel Workbook with Live KPIs, PivotCharts & One-Click Refresh
Originally published: 30/08/2026 12:34
Publication number: ELQ-68849-1
View all versions & Certificate
certified

Oil & Gas Production Dashboard – Excel Workbook with Live KPIs, PivotCharts & One-Click Refresh

complete Oil & Gas production and financial performance dashboard in Excel

Description
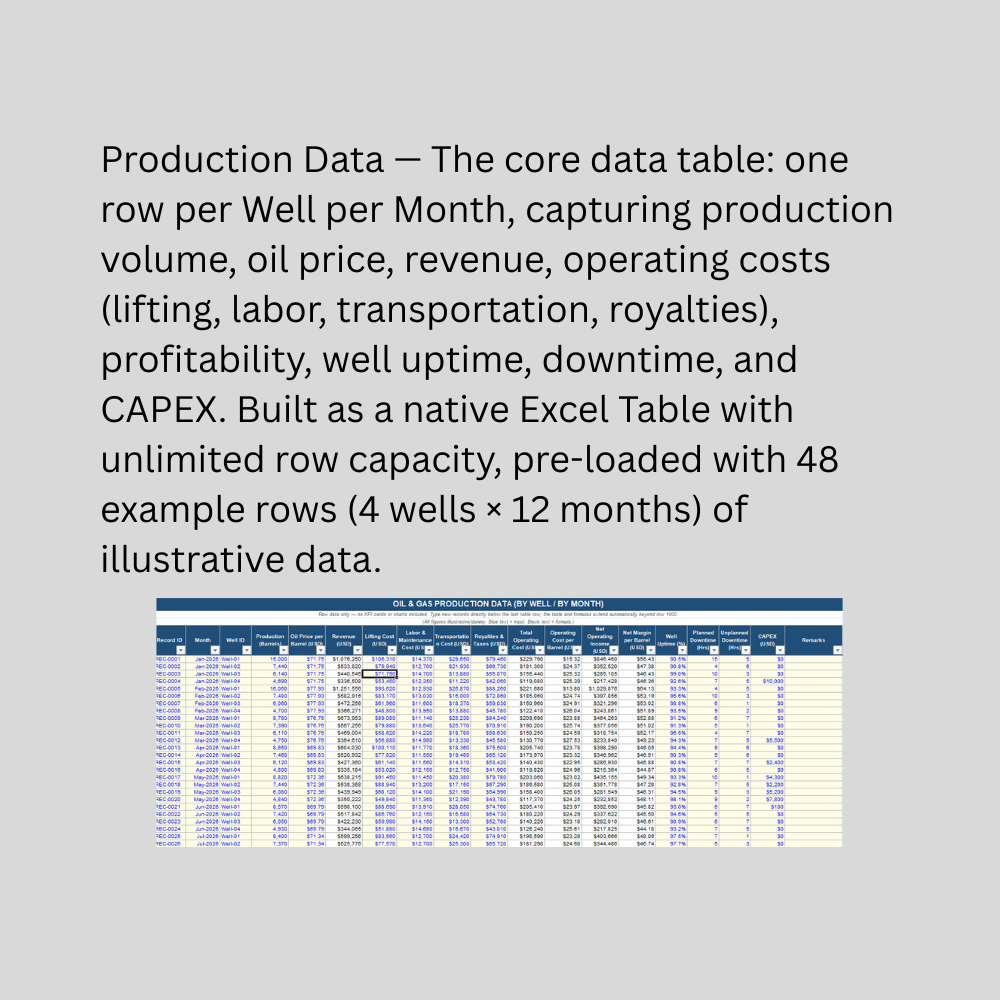
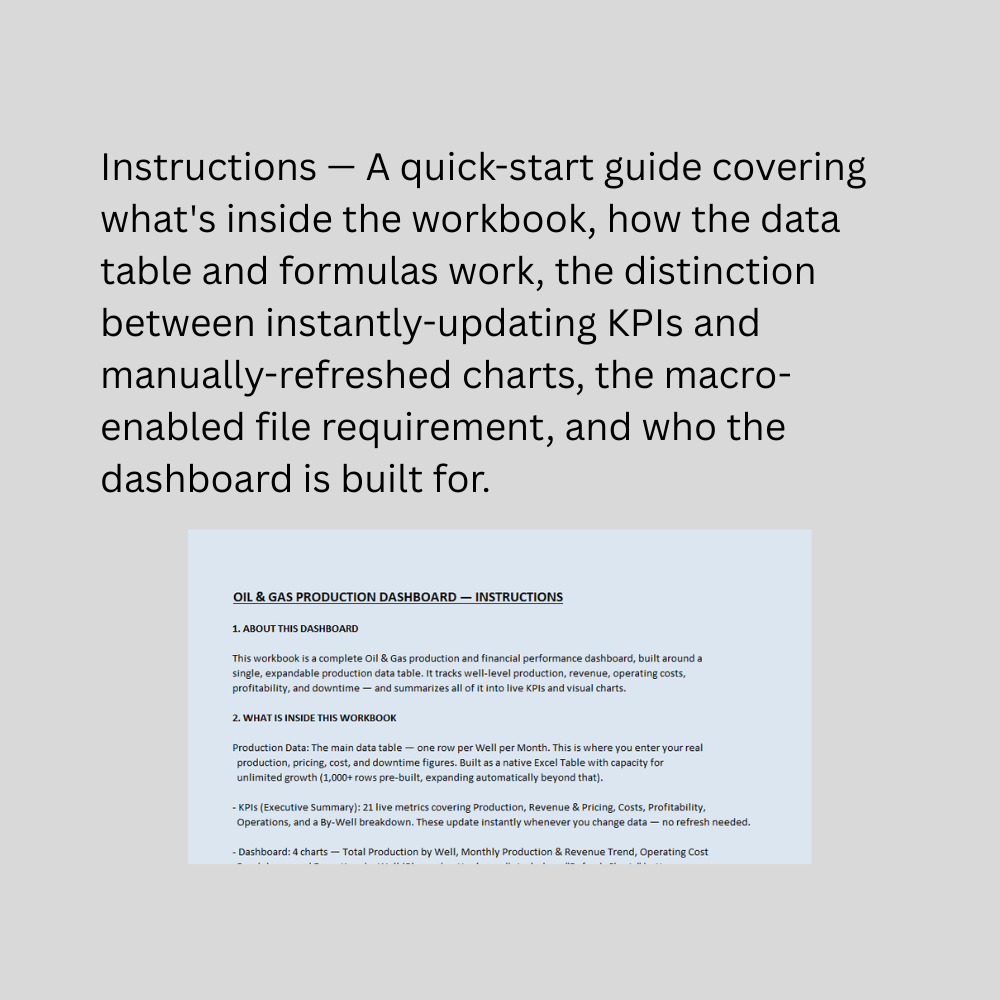
This Oil & Gas Production Dashboard is a complete Excel workbook built for production managers, operations analysts, and small-to-mid-sized operators who need a centralized, visual view of well performance without investing in dedicated production management software. At its core is a single, expandable production data table — one row per well per month — capturing everything from production volume and oil pricing to operating costs, profitability, uptime, and downtime.
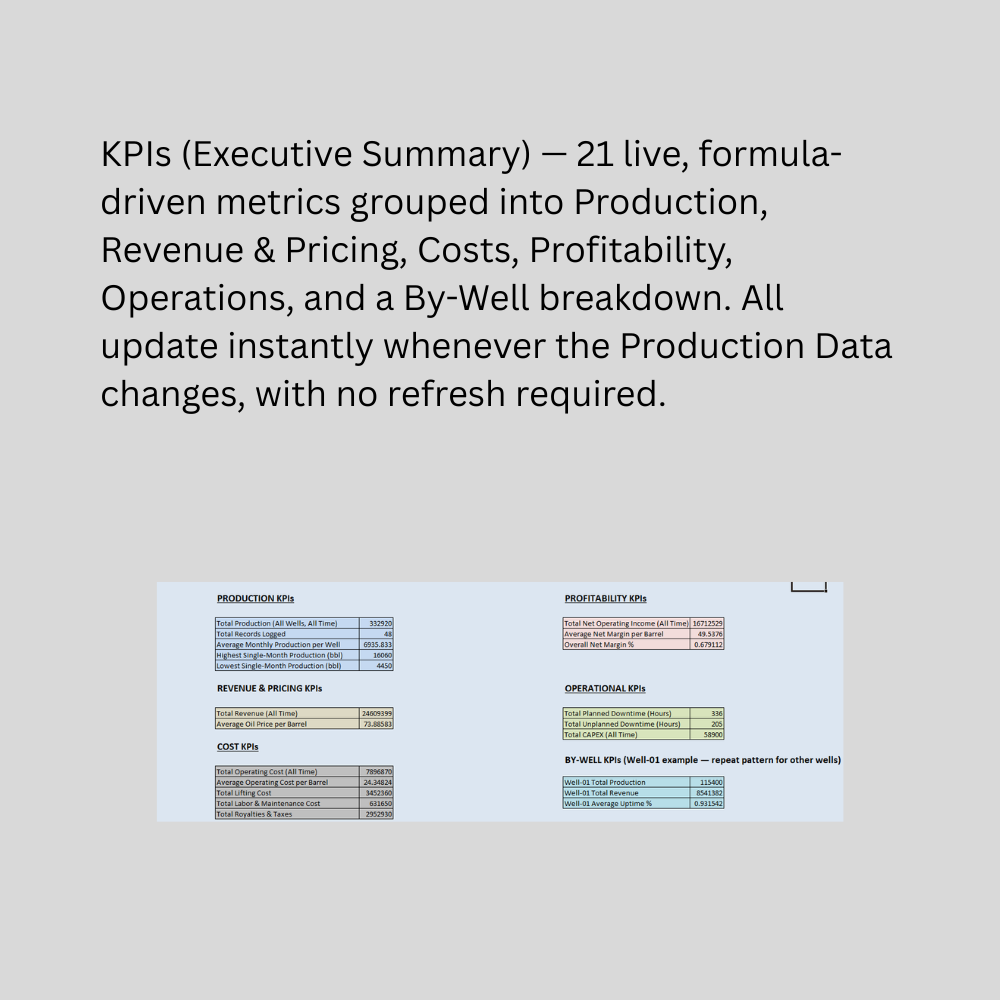
Rather than a fixed monthly grid, the data table is built as a native Excel Table, meaning it grows without limit: add new months, new wells, or additional years simply by typing into the row below the last one, with formulas and dropdown validation extending automatically. On top of this foundation sit two distinct layers. The KPIs (Executive Summary) sheet presents 21 metrics — total and by-well production, revenue, average oil price, total and per-barrel operating costs, net operating income, net margin per barrel, well uptime, downtime hours, and CAPEX — all built on SUMIFS/AVERAGEIFS formulas that reference the table directly, so every KPI updates instantly the moment new data is entered, with zero manual steps.

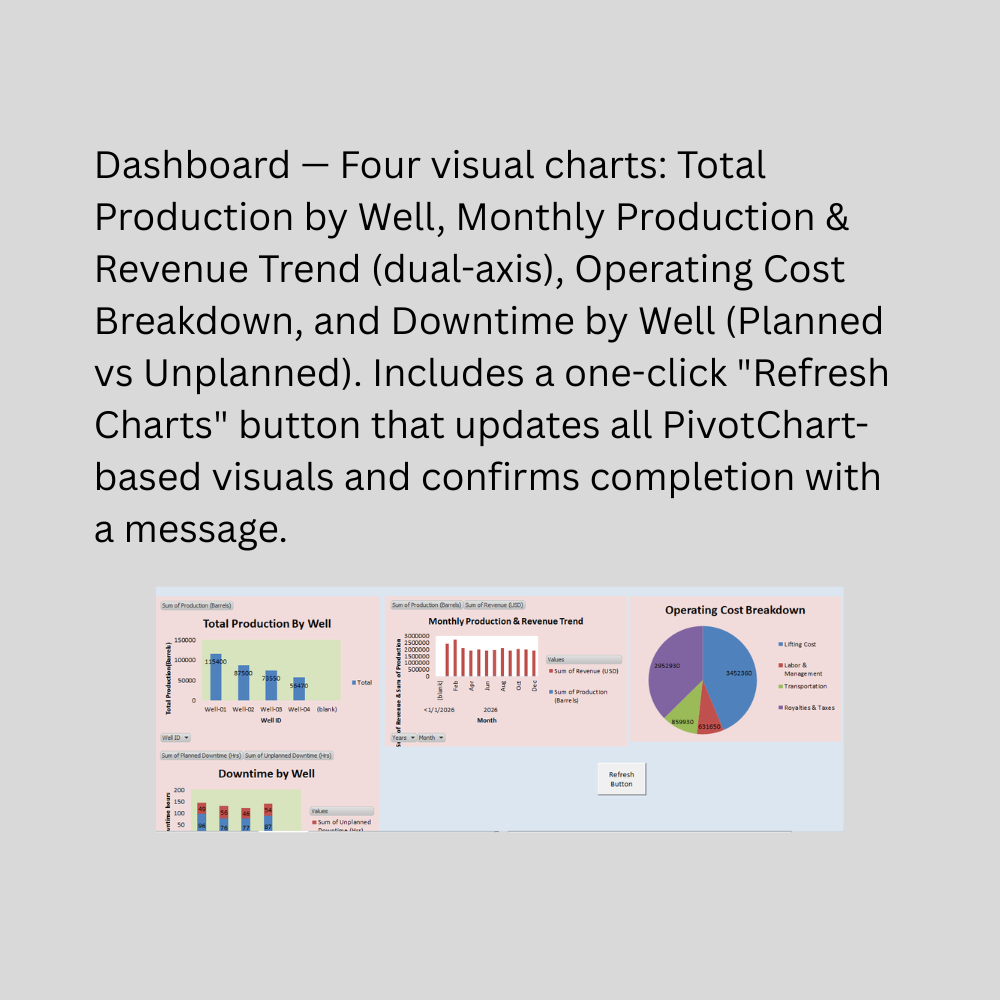
The Dashboard sheet adds four PivotTable-driven charts: Total Production by Well, a dual-axis Monthly Production & Revenue Trend, an Operating Cost Breakdown by category, and a Downtime by Well comparison. Because PivotCharts require a refresh to reflect new data, a one-click "Refresh Charts" button (built with a simple macro) updates all four at once and confirms completion with an on-screen message — giving you the analytical flexibility of PivotCharts without the risk of forgetting to refresh. The workbook is macro-enabled (.xlsm) to support this button, with a security prompt on first open being normal and expected.

This Best Practice includes
1 excel dashboard file (xlmx), instruction set

Acquire business license for $25.00

Add to cart

Add to bookmarks

Discuss

Further information

Provide a centralized, unlimited-growth data table for well-level production, revenue, and cost tracking
Deliver instant, formula-driven KPIs covering production, profitability, and operations with no manual recalculation
Visualize performance through PivotChart-based comparisons by well, by month, and by cost category
Enable one-click refresh of all charts, avoiding the risk of buyers viewing stale data
Help operators identify underperforming wells, rising costs, and downtime patterns quickly
Support monthly or periodic operational reviews without dedicated production software

Small to mid-sized oil & gas operators tracking multiple wells' production and financial performance
Production managers and operations analysts needing a fast, visual performance overview
Businesses wanting a lightweight, offline alternative to enterprise production management systems
Users comfortable with Excel PivotTables/PivotCharts and enabling macros (.xlsm files)
Monthly-level reporting and analysis (rather than real-time/daily SCADA-level monitoring)
Operations with a standard well-based production and cost structure

Real-time production monitoring or SCADA/telemetry integration
Reservoir engineering, decline curve analysis, or well economics modeling beyond basic revenue/cost tracking
Multi-currency or multi-country consolidated reporting across international operations
Businesses unable or unwilling to enable macros, since the Refresh Charts button requires this
Complex royalty, joint-venture, or working-interest allocation structures (this template assumes a simplified, single-operator cost/revenue structure)
Situations requiring certified reserves reporting, regulatory compliance documentation, or professional engineering/financial review — this is an operational visibility tool, not a substitute for specialized software or professional advice


0.0 / 5 (0 votes)

please wait...