




Dental Practice 5-Year Financial Model Excel | Patient Capacity, Cash Flow, Break-Even, Scenarios & Investor Deck

5-year dental practice financial model with patient capacity, three statements, break-even, scenarios, funding analysis, investor deck and PDF guide.

Description

๐Ÿฆท DENTAL PRACTICE 5-YEAR FINANCIAL MODEL & BUSINESS FORECAST


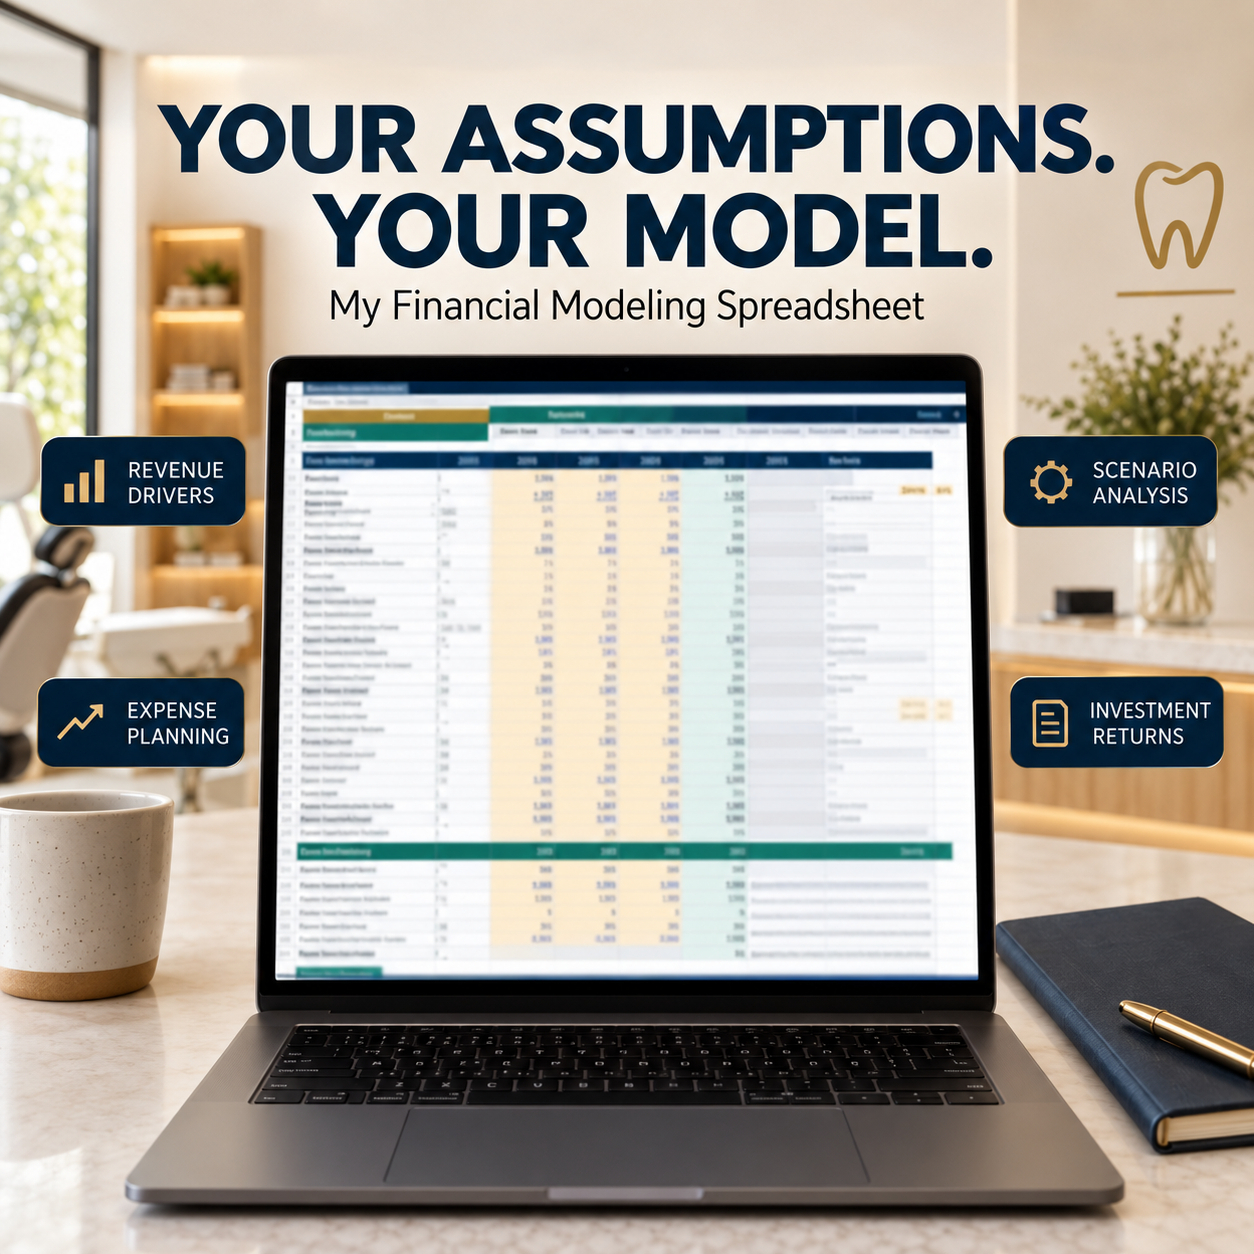
Plan patient growth, treatment capacity, revenue, staffing, clinical costs, operating expenses, capital investment, financing, liquidity, and profitability with an integrated financial model designed for existing and planned dental practices.

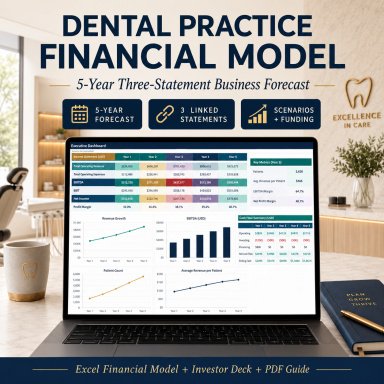
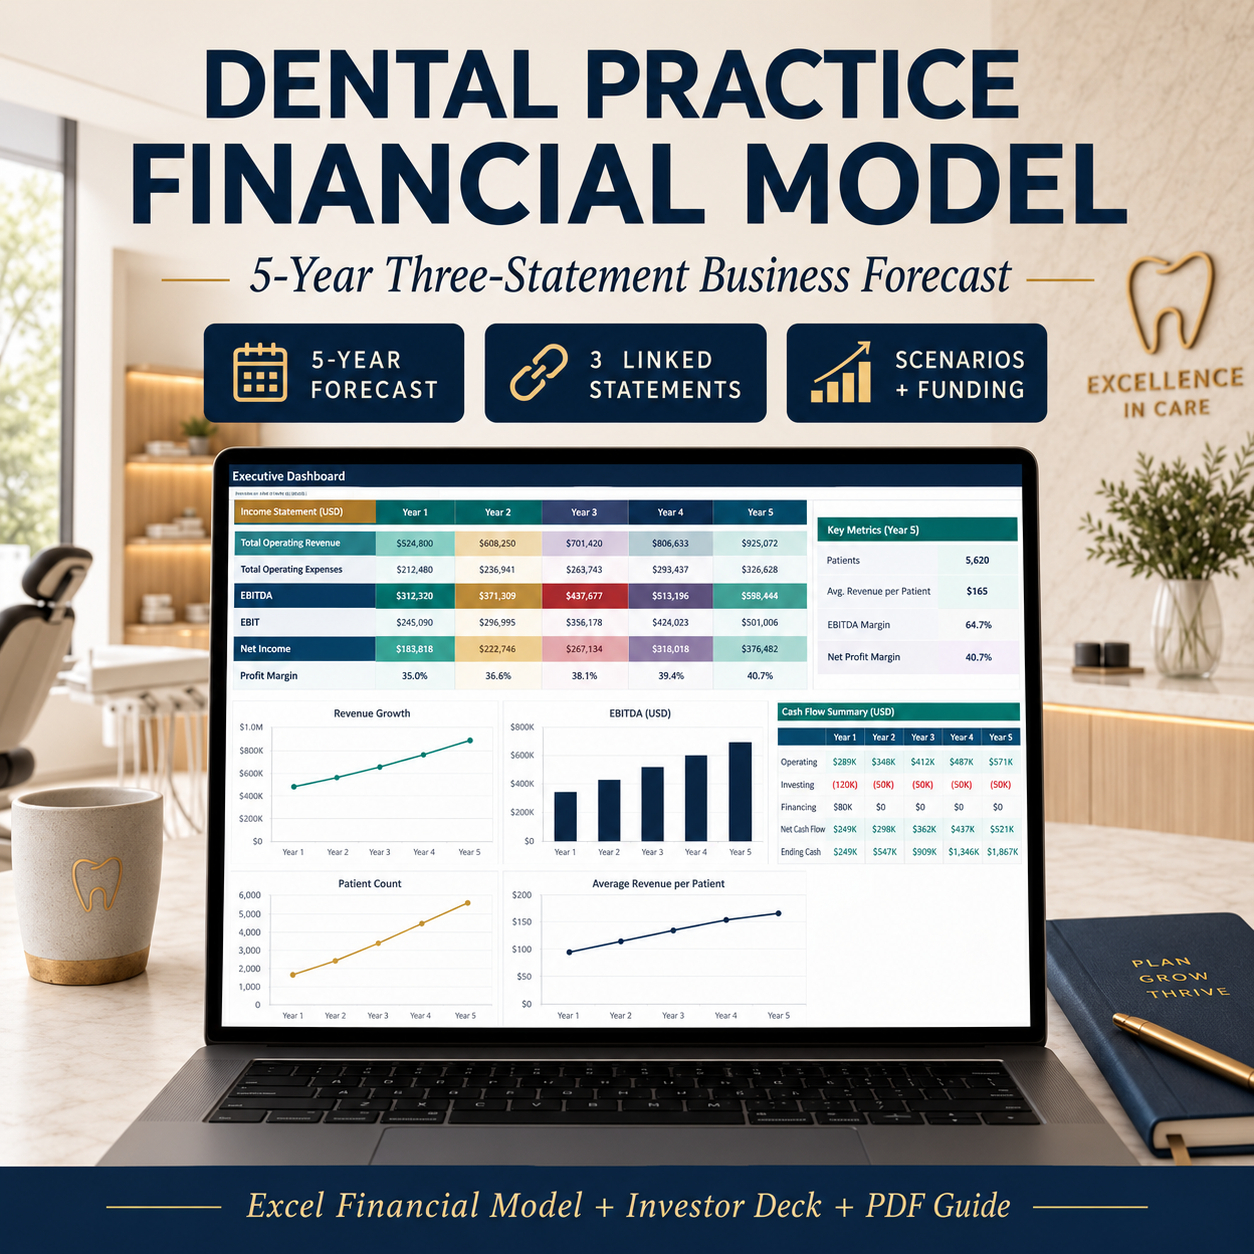
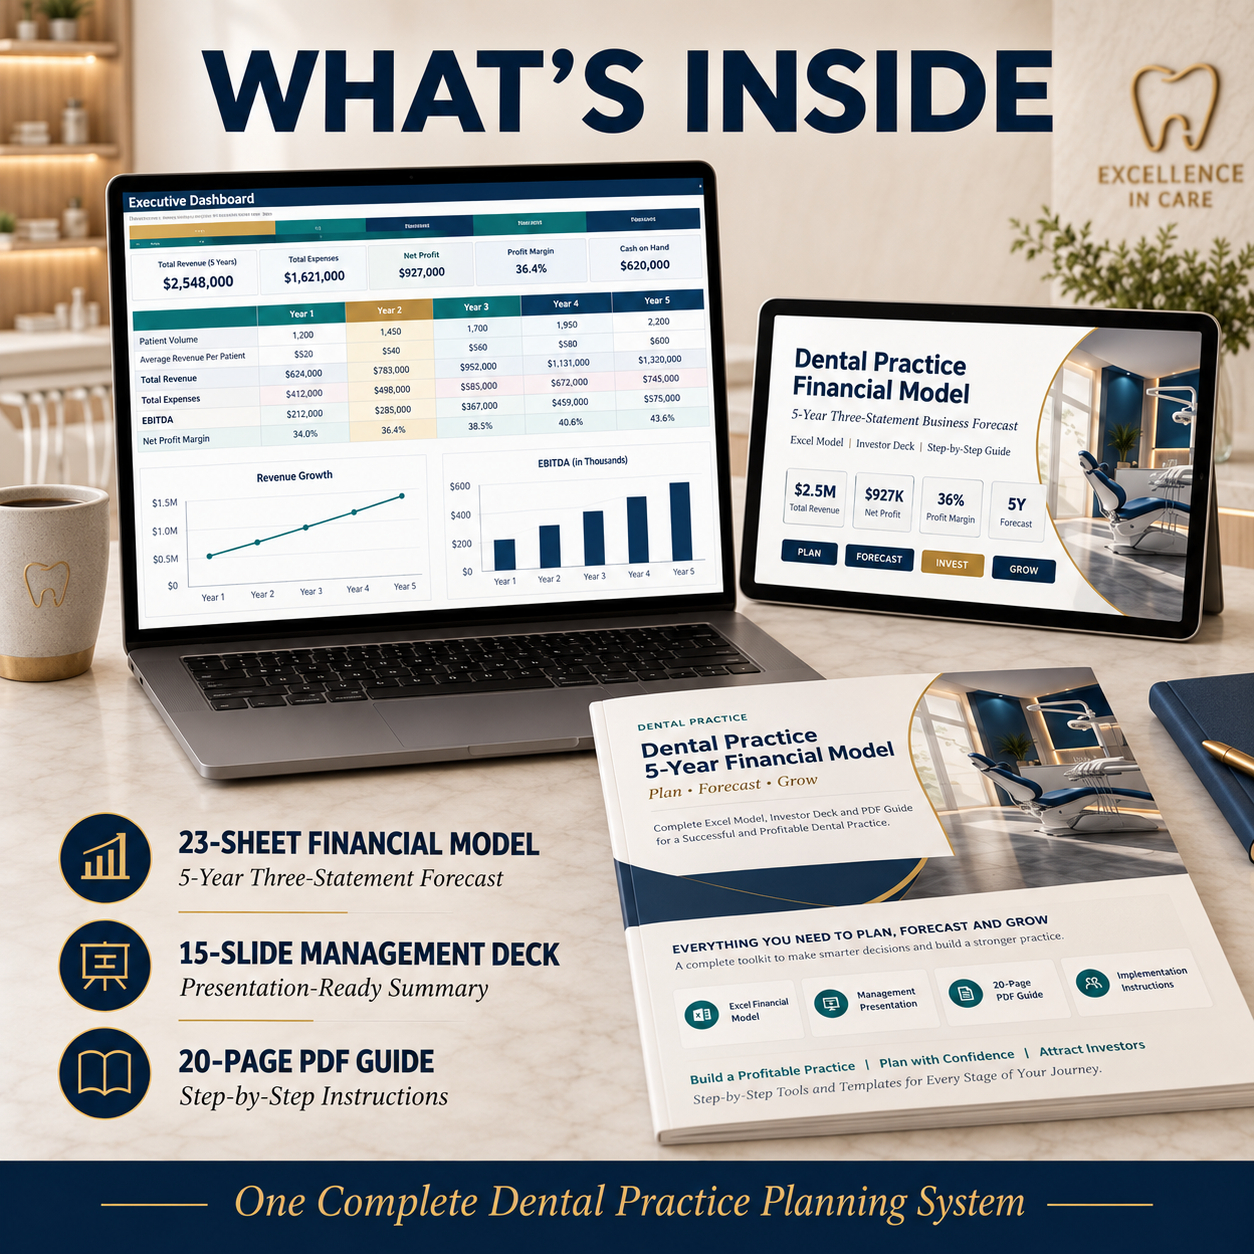
This professional package combines a 23-worksheet Excel Financial Model, a 15-slide Investor / Management PowerPoint Deck, and a detailed 20-page How-to-Use PDF Guide.


The model connects key dental-practice operating assumptions with a complete 2029โ€“2033 Three-Statement Forecast, helping practice owners, founders, consultants, finance professionals, and management teams translate patient activity, treatment volumes, provider capacity, staffing, costs, CapEx, debt, and financing into structured financial outputs.


๐Ÿ‘ฅ PATIENT & CAPACITY MODEL

The operating model connects:

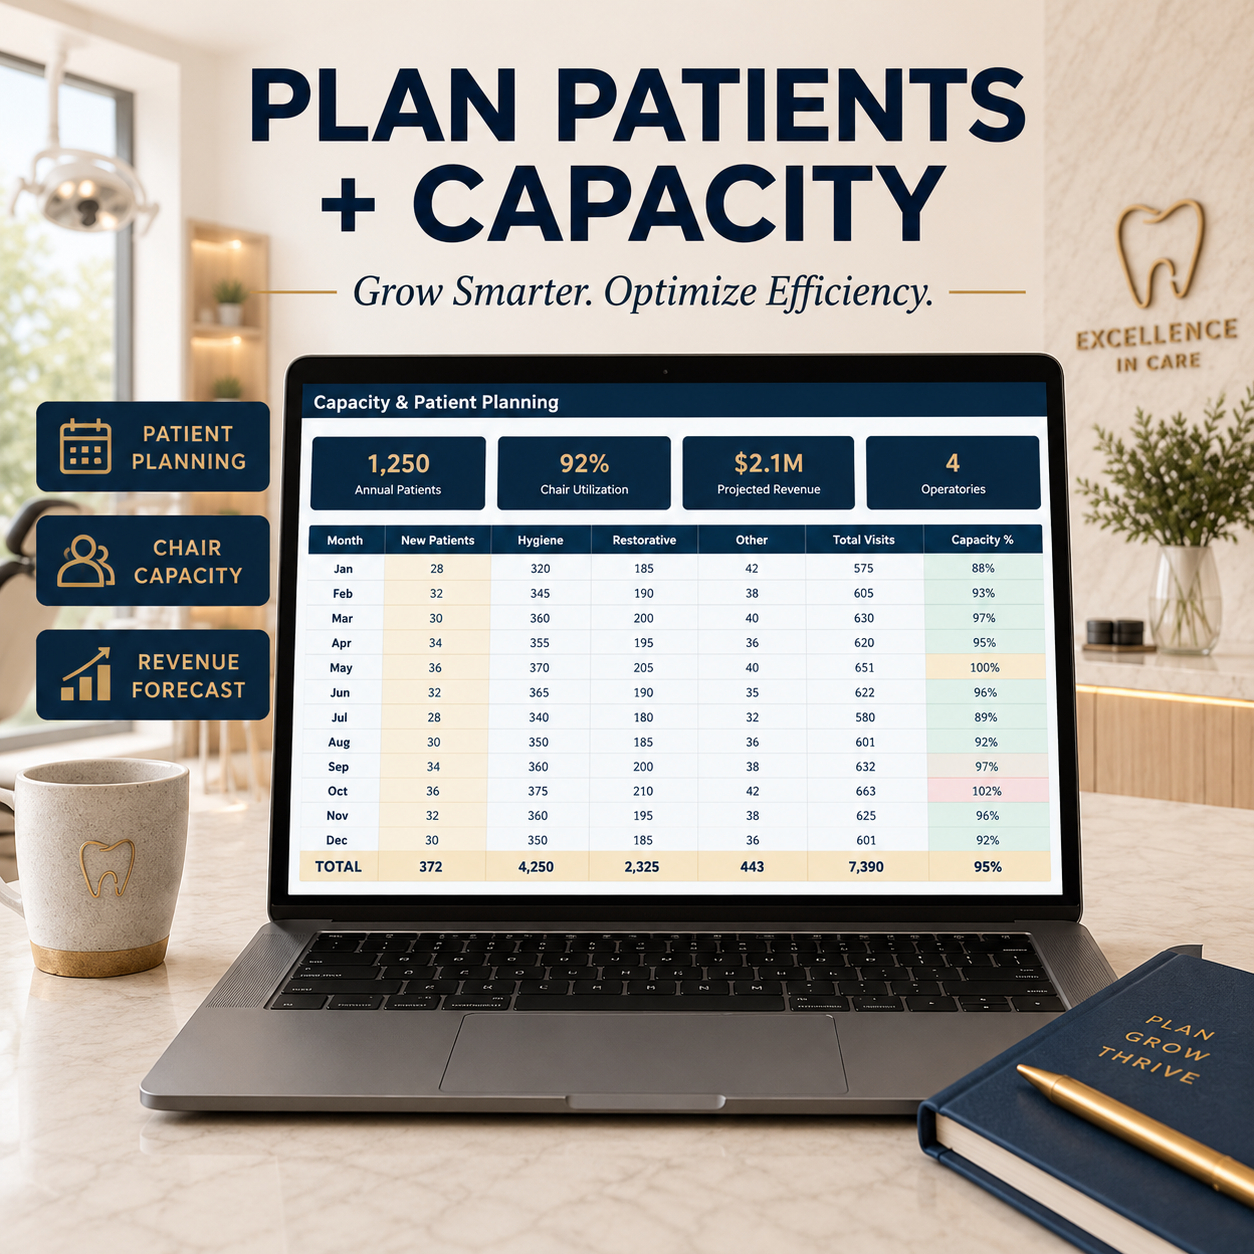
โœ… Starting Active Patients โœ… New Patients โœ… Returning / Retained Patients โœ… Ending Active Patients โœ… Average Active Patients โœ… Returning Patient Visits โœ… Appointment Capacity โœ… Available Capacity โœ… Visit Demand โœ… Final Visits / Procedures โœ… Capacity Utilization โœ… Appointments per Dentist FTE โœ… Appointments per Hygienist FTE


This allows patient demand and provider capacity to be reviewed together rather than as separate planning assumptions.


๐Ÿฆท TREATMENT REVENUE

Treatment categories are user-editable and support both capacity-linked and non-capacity-linked services.

The included illustrative categories cover:

โœ… New Patient Exams โœ… Hygiene / Preventive Visits โœ… Restorative Treatments โœ… Cosmetic Treatments โœ… Major Procedures โœ… Emergency Visits โœ… Other Dental Services โœ… Whitening / Aesthetic Add-Ons โœ… Implant Consultations โœ… Orthodontic Consultations โœ… Custom Categories


Users can adjust procedure volume, annual growth, average revenue, and revenue growth assumptions.


๐Ÿ’ต OTHER REVENUE

Additional non-treatment revenue can also be modeled separately, providing flexibility for practice-specific revenue streams without distorting the core treatment model.


๐Ÿ‘จโ€โš•๏ธ STAFFING & PAYROLL

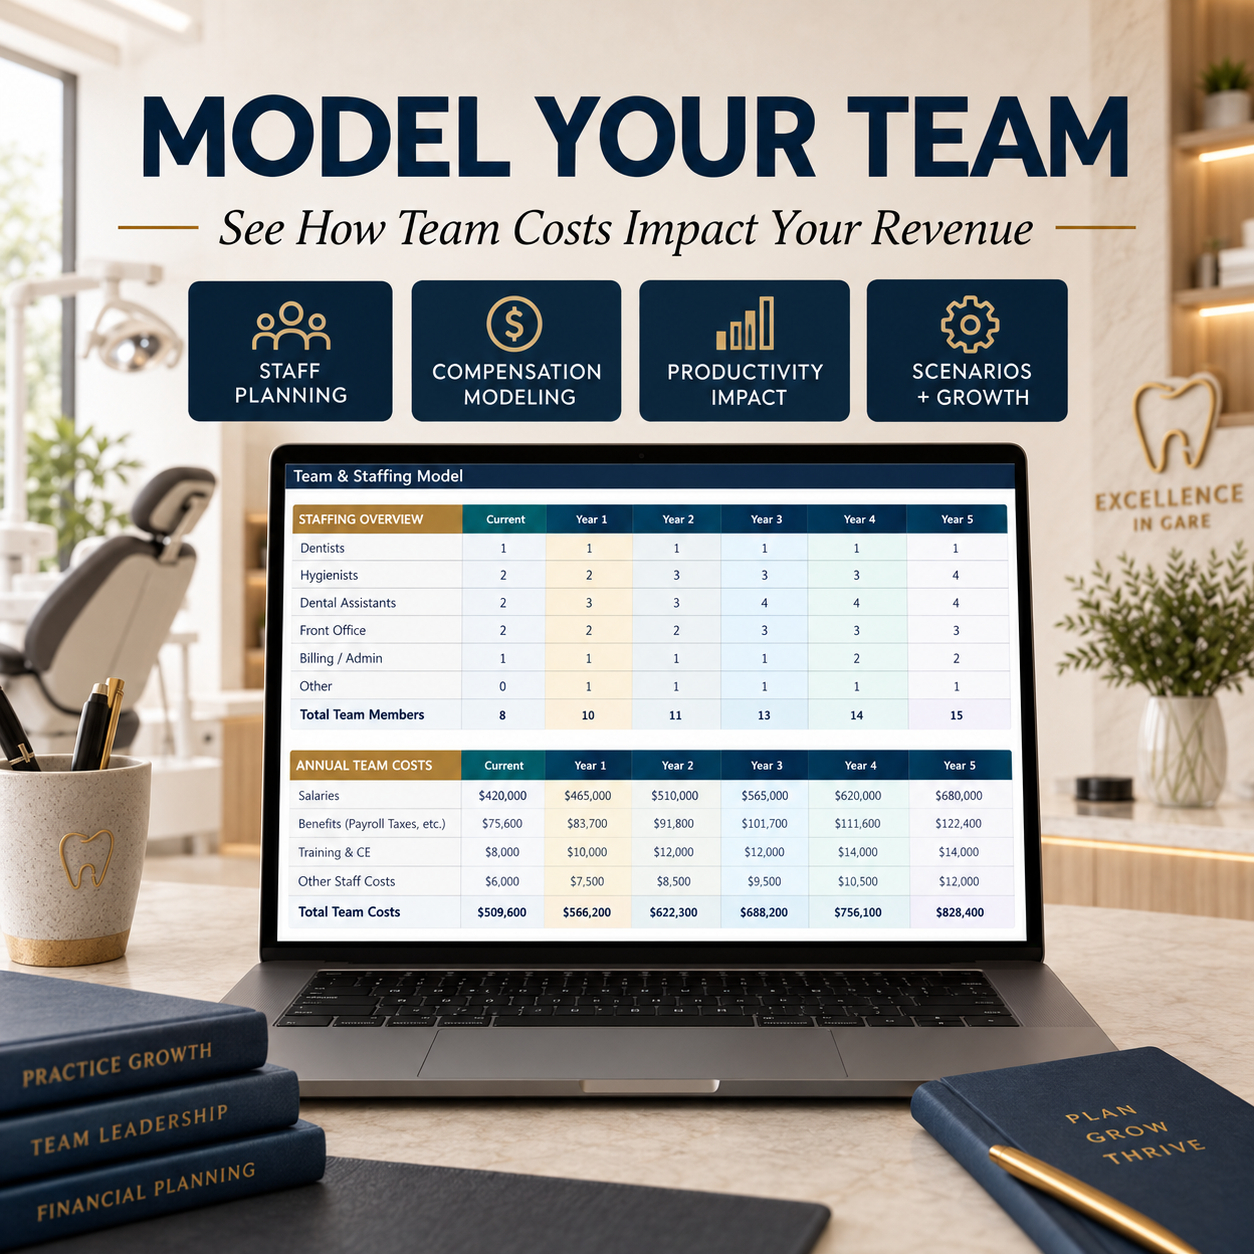
Plan practice staffing using role-specific assumptions covering headcount, compensation, wage growth, start timing, and salary or hourly cost structures.

This allows payroll requirements to develop alongside patient growth, treatment activity, and operating capacity.


๐Ÿงช CLINICAL SUPPLIES & COGS

Clinical costs can be modeled using different cost bases, including revenue percentages, per-visit assumptions, or fixed annual amounts.

This provides a transparent link between practice activity and variable clinical costs.


๐Ÿข OPERATING EXPENSES

Plan recurring practice expenses separately from clinical costs and payroll, allowing fixed and operating overhead to be evaluated transparently within the forecast.


๐Ÿช‘ CAPEX, DEPRECIATION & DEBT

The model includes dedicated schedules for:

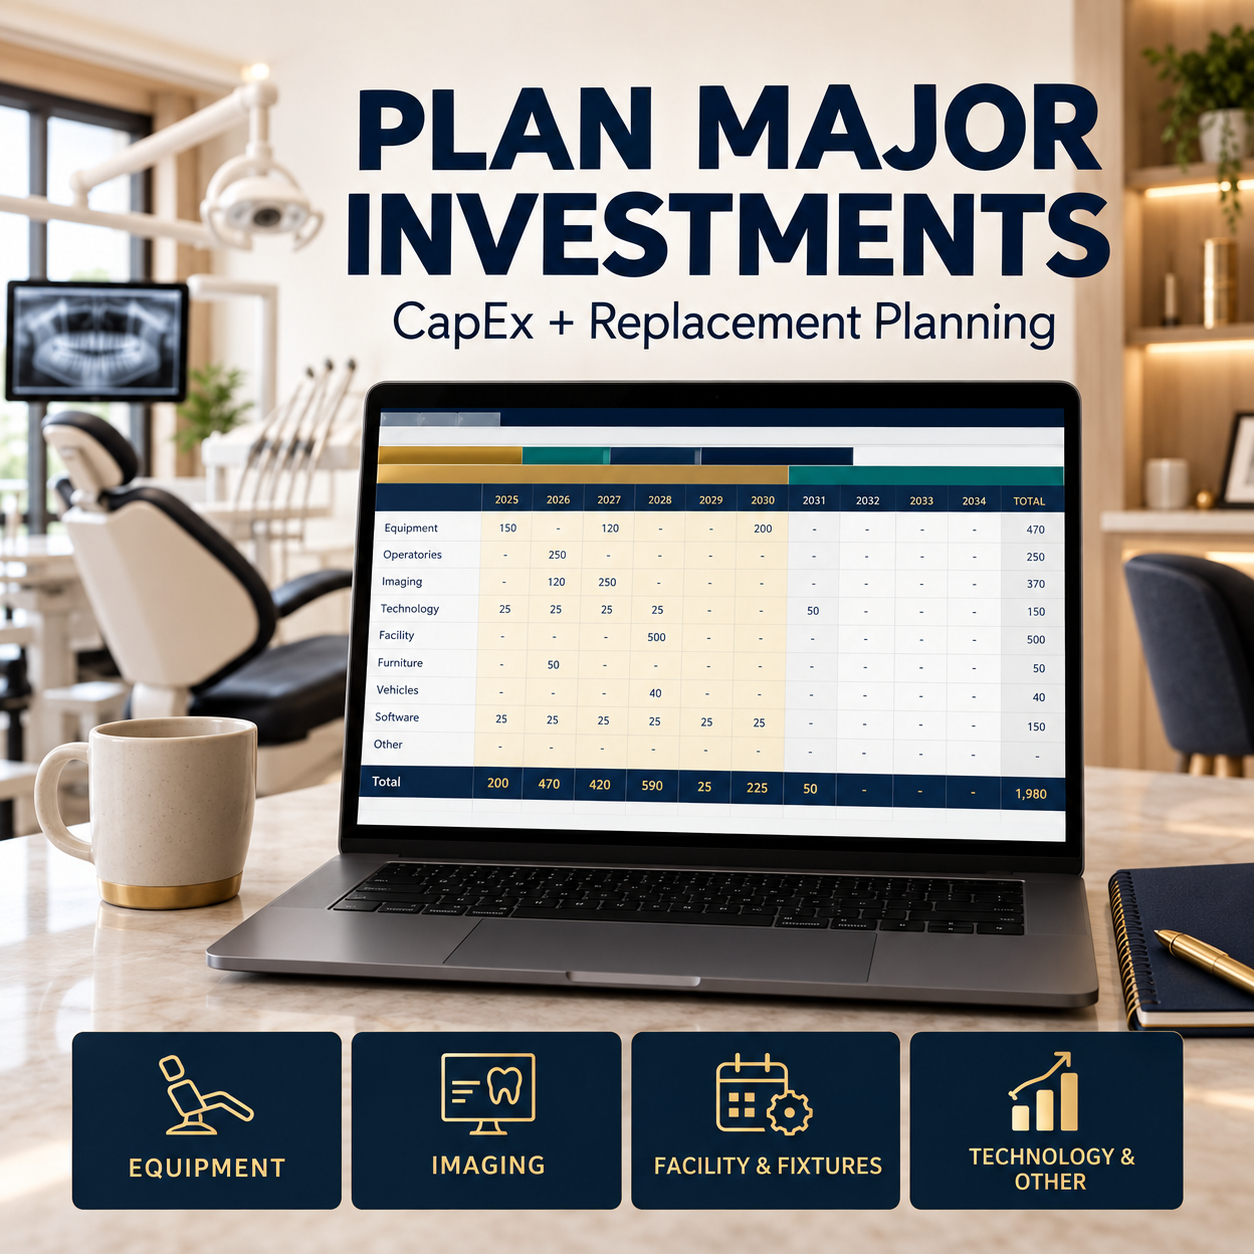
โœ… Capital Expenditure โœ… Equipment and Practice Investments โœ… Depreciation โœ… Opening Debt โœ… New Debt Draws โœ… Interest โœ… Principal Repayment โœ… Ending Debt


Capital investment and financing assumptions flow directly into the financial statements and cash forecast.


๐Ÿงพ FULL THREE-STATEMENT FINANCIAL MODEL

The workbook integrates:

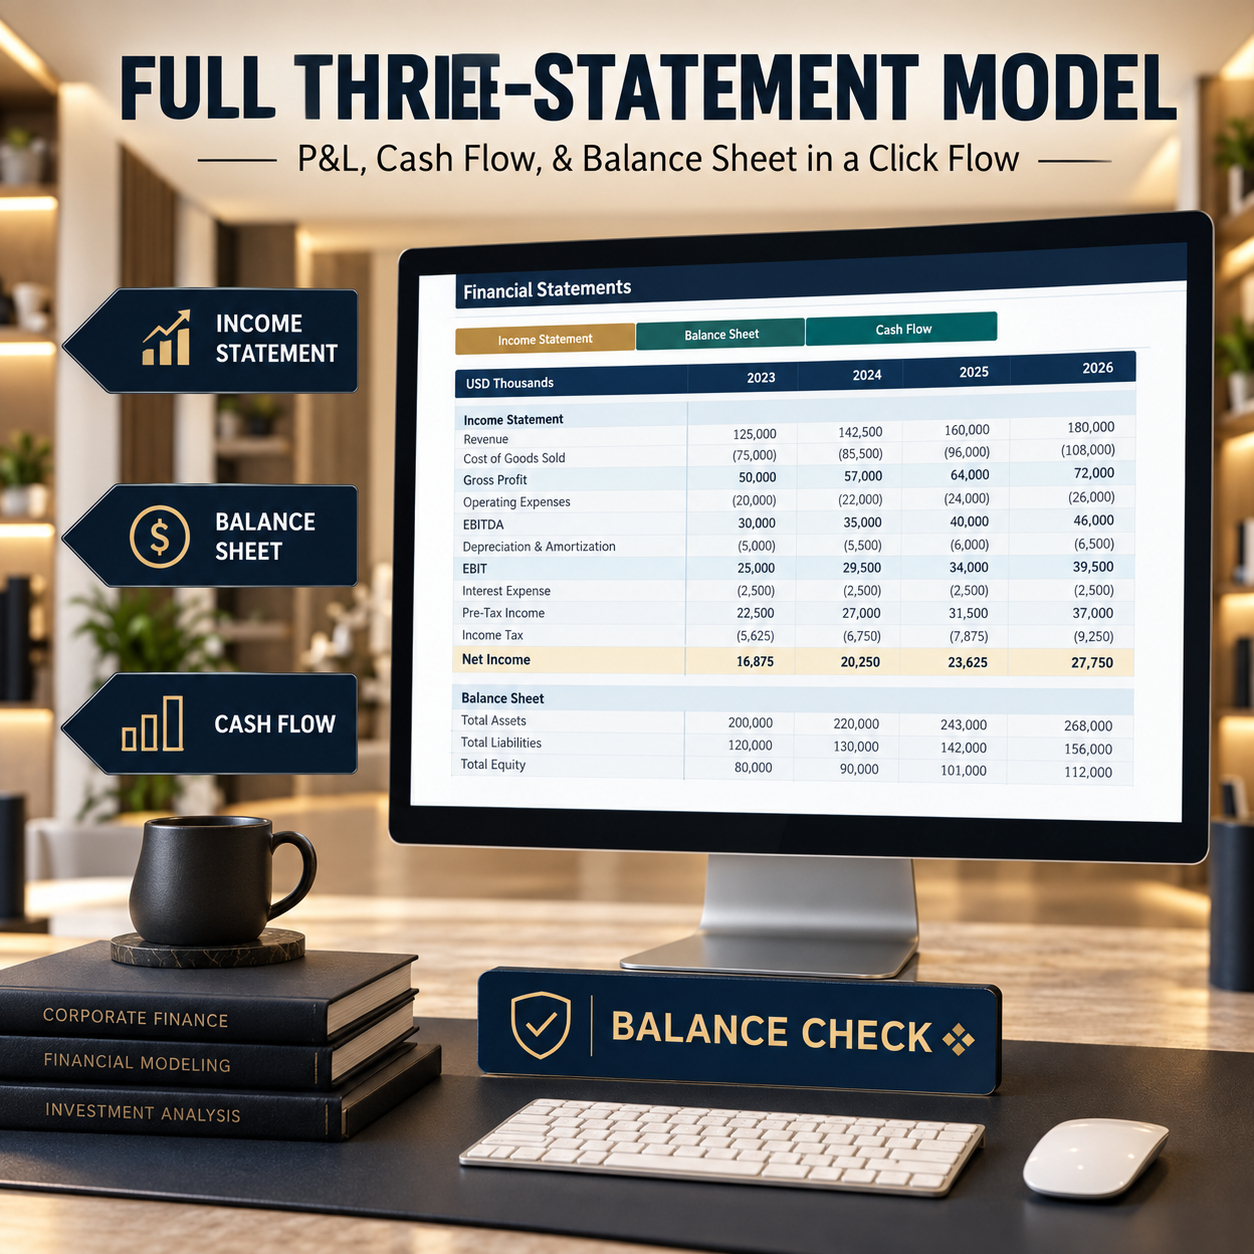
โœ… Income Statement โœ… Balance Sheet โœ… Cash Flow Statement


The model connects Revenue, Gross Profit, Payroll, EBITDA, Depreciation, Interest, Net Income, Accounts Receivable, Accounts Payable, Debt, CapEx, Cash, and Equity / Retained Earnings.

A visible Balance Check supports model QA and financial consistency.


๐Ÿ“… MONTHLY + FIVE-YEAR FORECAST

The system includes:

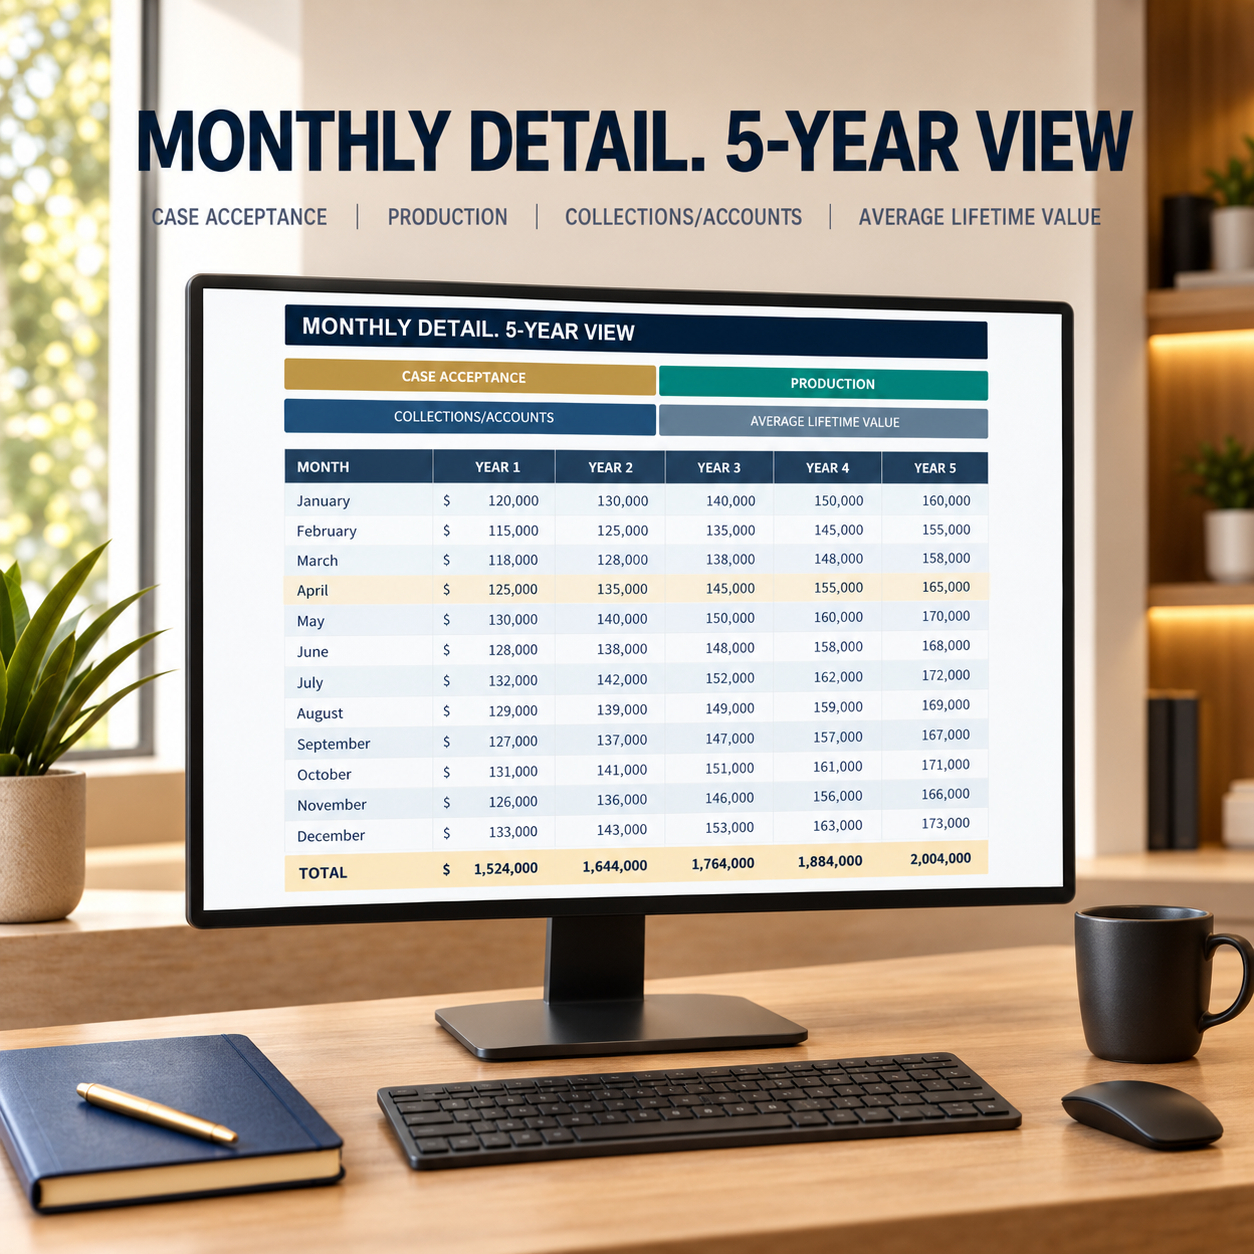
โœ… Monthly Forecast โ€” Year 1 โœ… Annual Forecast โ€” Years 1โ€“5 โœ… Illustrative forecast period 2029โ€“2033


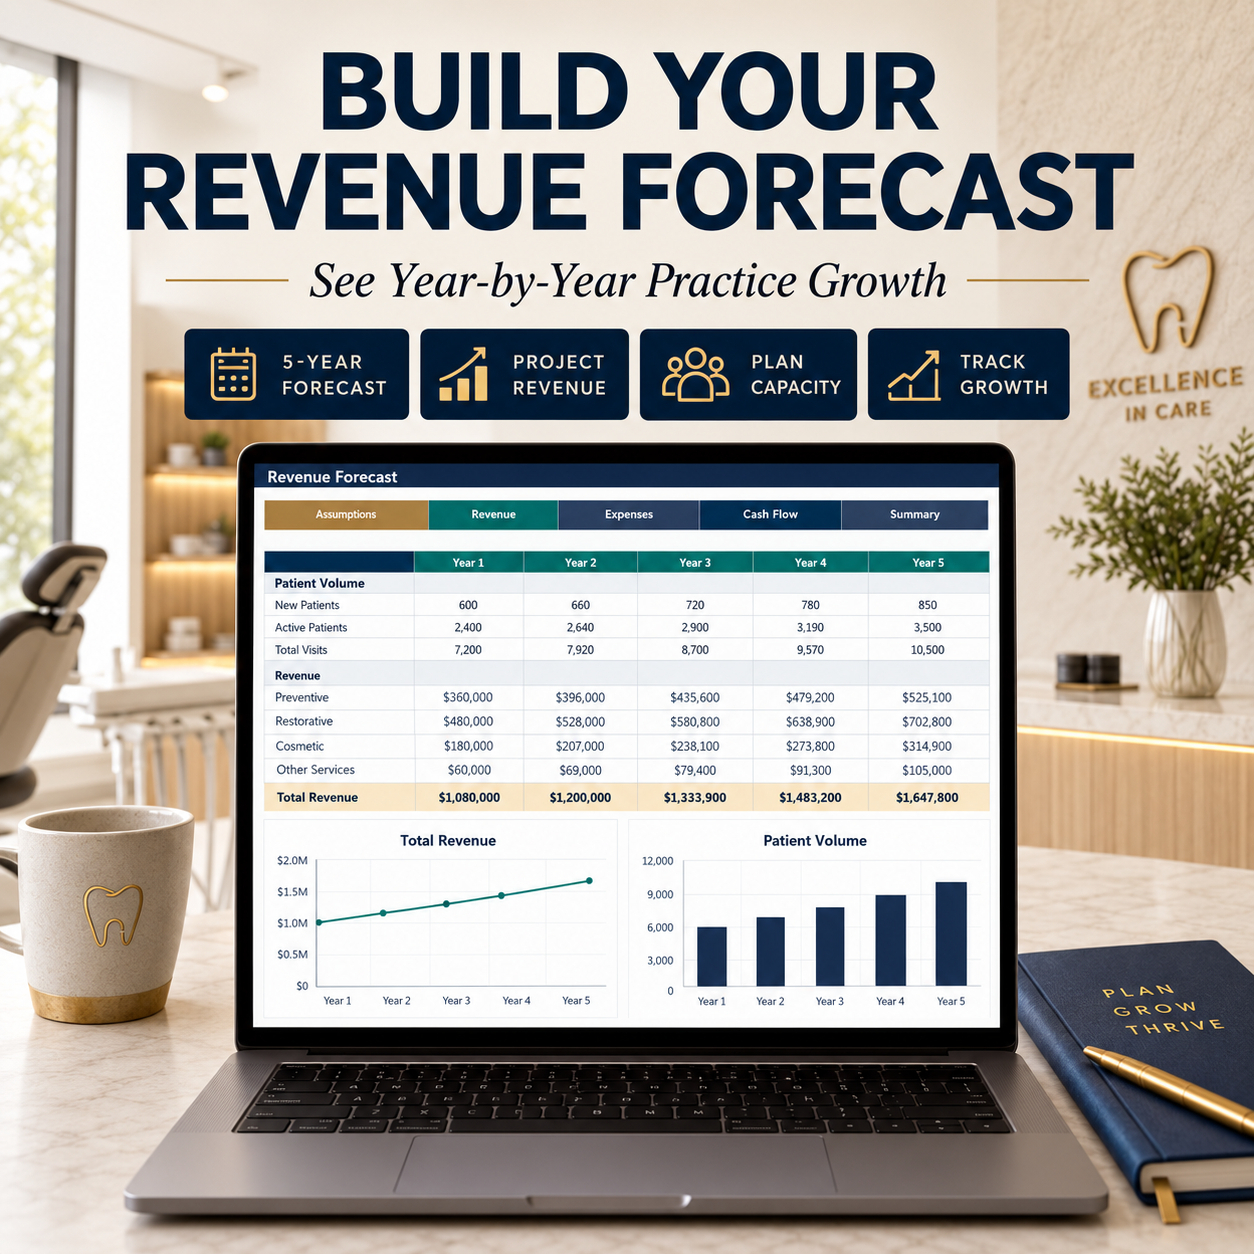
The annual forecast consolidates operating performance, profitability, cash development, patients, visits, and funding requirements across the full planning period.


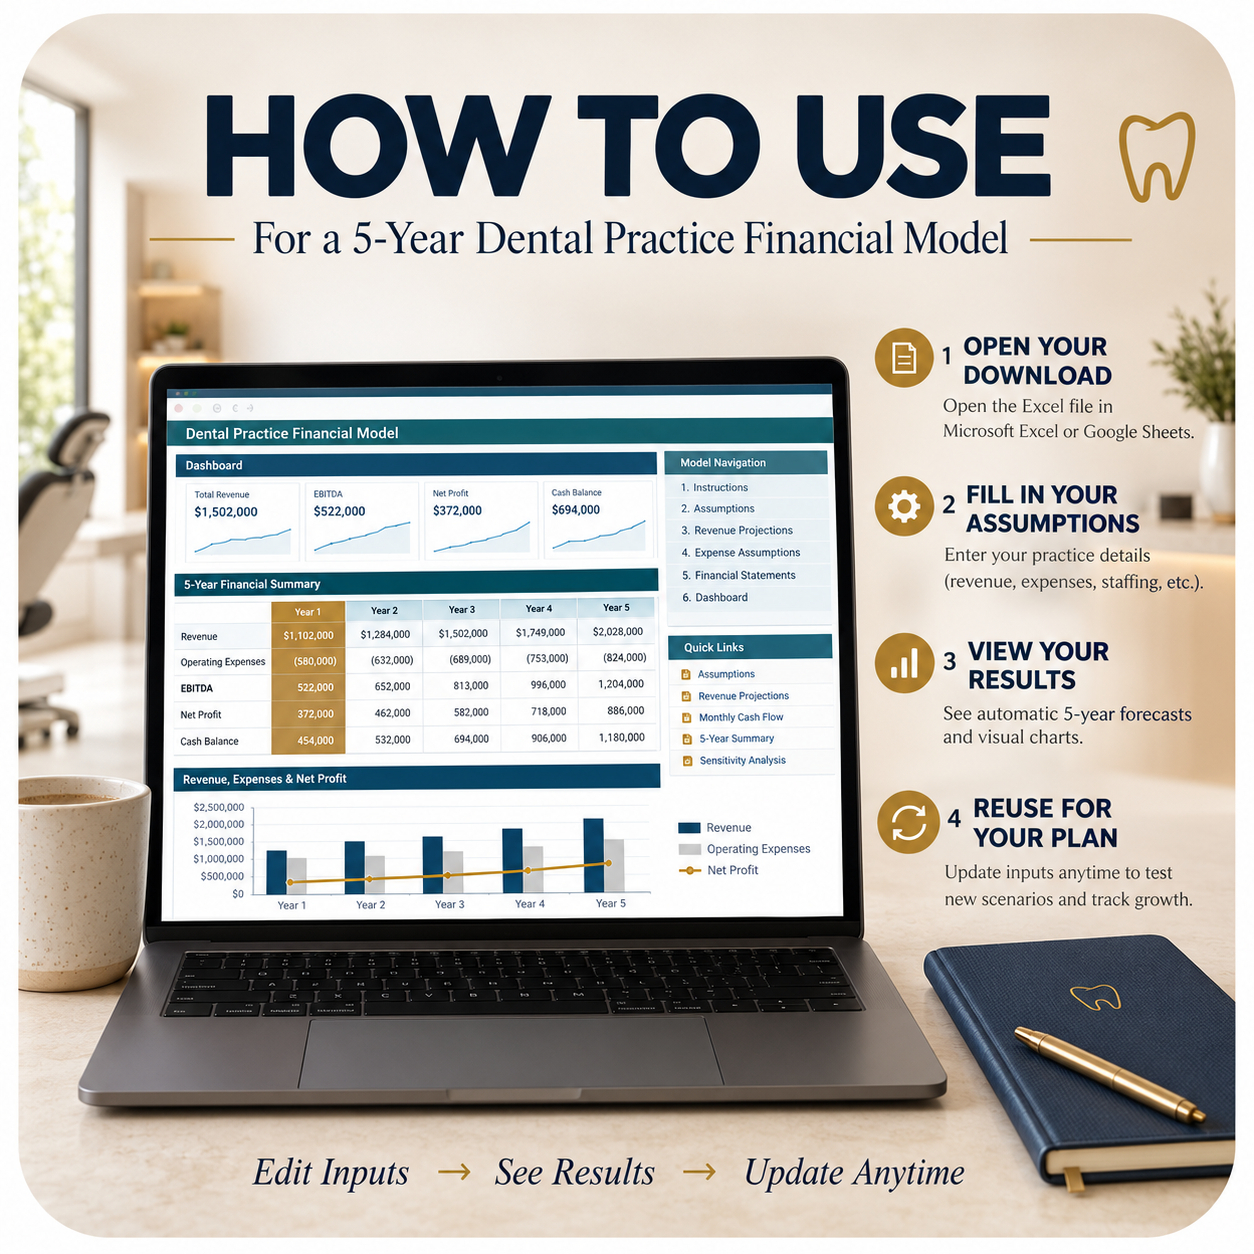
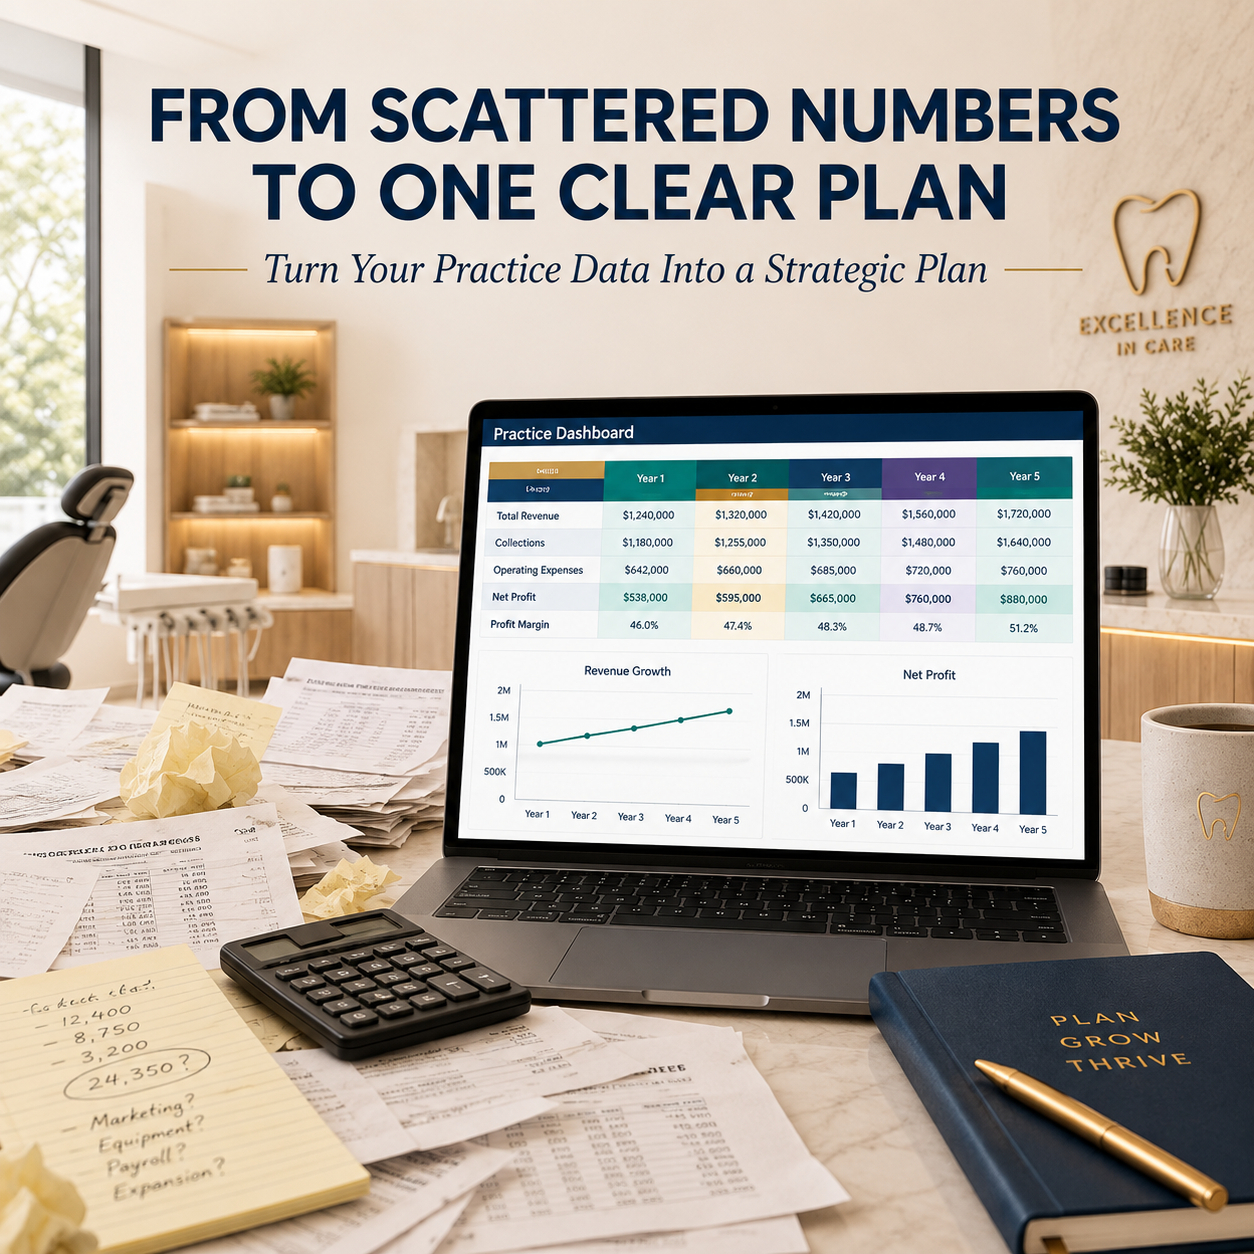
๐Ÿ“Š EXECUTIVE DASHBOARD & KPI ANALYSIS

The Executive Dashboard highlights key management indicators including:

๐Ÿ’ต Revenue ๐Ÿ“ˆ EBITDA ๐Ÿ“Š EBITDA Margin ๐Ÿ’ฐ Net Income ๐Ÿ’ง Ending Cash ๐Ÿ‘ฅ Active Patients ๐Ÿฆท Revenue per Patient ๐Ÿ“… Visits / Procedures ๐Ÿช‘ Capacity Utilization ๐Ÿ‘จโ€โš•๏ธ Payroll % of Revenue ๐Ÿงช Clinical Cost % ๐ŸŽฏ Break-Even Visits ๐Ÿฆ Funding Required

Four integrated charts visualize:

๐Ÿ“ˆ Revenue Growth ๐Ÿ’Ž EBITDA Development ๐Ÿ’ง Ending Cash ๐Ÿ‘ฅ Active Patient Growth


The dedicated KPI Analysis provides the same core financial and operational metrics across the full five-year forecast.


๐ŸŽฏ BREAK-EVEN ANALYSIS

Evaluate:

โœ… Total Revenue โœ… Variable Clinical Costs โœ… Contribution Margin โœ… Contribution Margin % โœ… Fixed Costs โœ… Monthly Break-Even Revenue โœ… Average Revenue per Visit โœ… Required Patient Visits โœ… Required Capacity Utilization โœ… Break-Even Visits per Month


This helps translate the cost structure into clear operating thresholds for the practice.


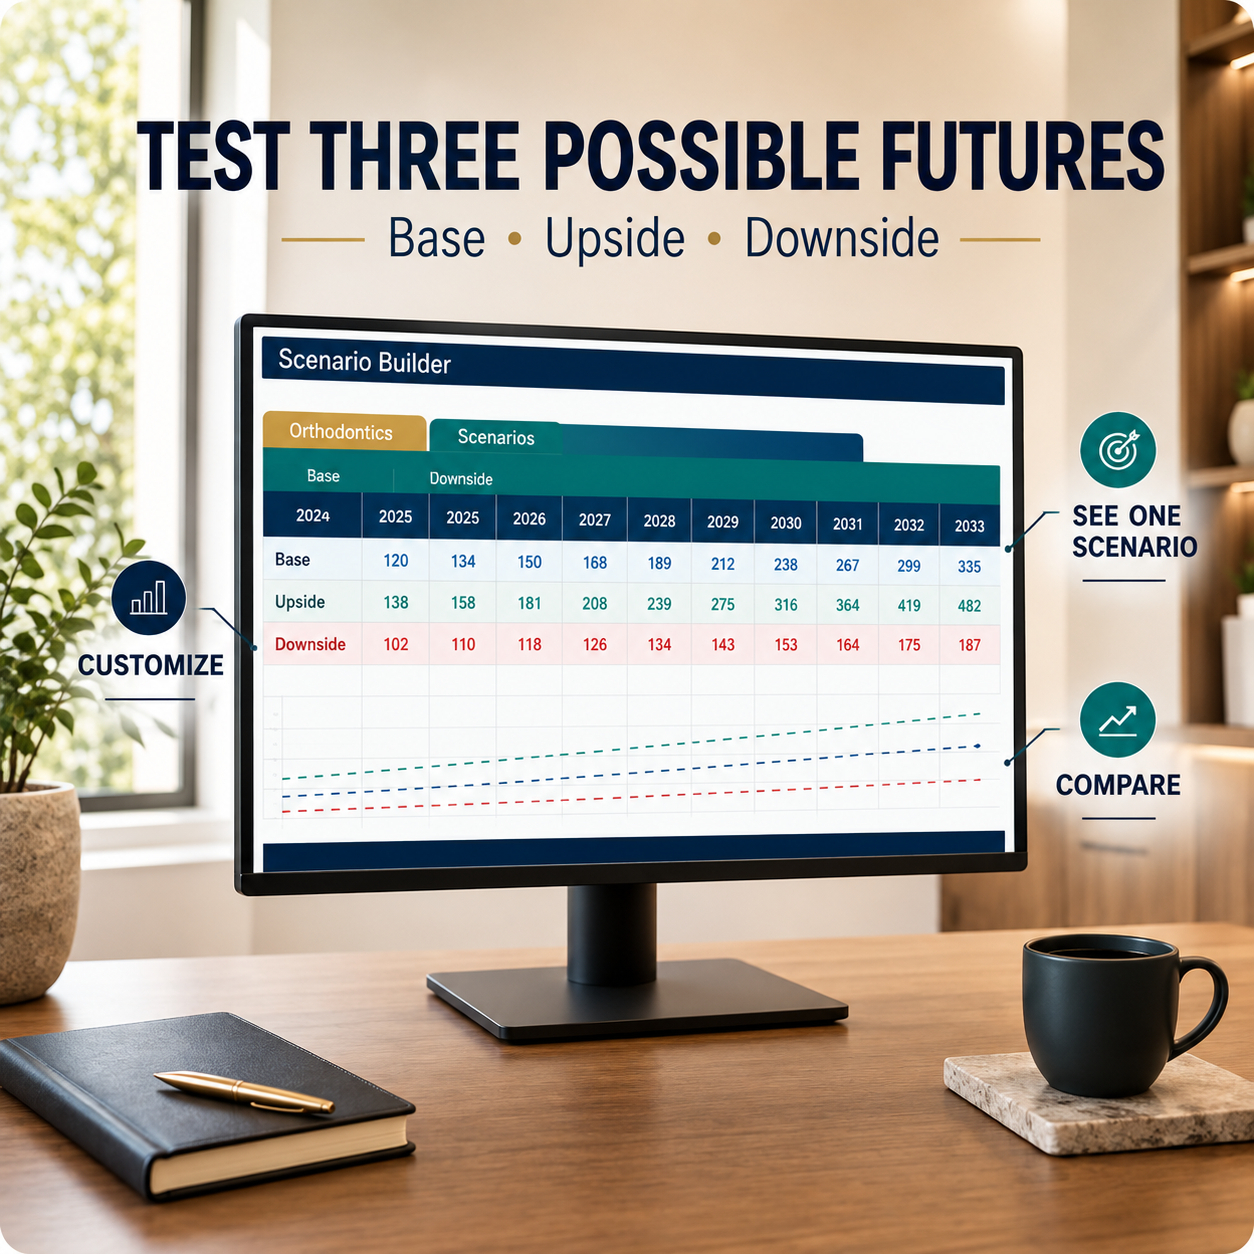
๐Ÿ”„ BASE โ€ข UPSIDE โ€ข DOWNSIDE SCENARIOS

Compare three transparent planning cases:

๐Ÿ”ต Base Case ๐ŸŸข Upside Case ๐ŸŸ  Downside Case

Scenario drivers include:

โœ… Patient Growth โœ… Average Revenue per Visit โœ… Capacity Utilization โœ… Payroll Growth โœ… Clinical Cost % โœ… OPEX Growth

The comparison shows indicative impacts on:

๐Ÿ“ˆ Year 5 Revenue ๐Ÿ’Ž Year 5 EBITDA ๐Ÿ’ต Year 5 Cash


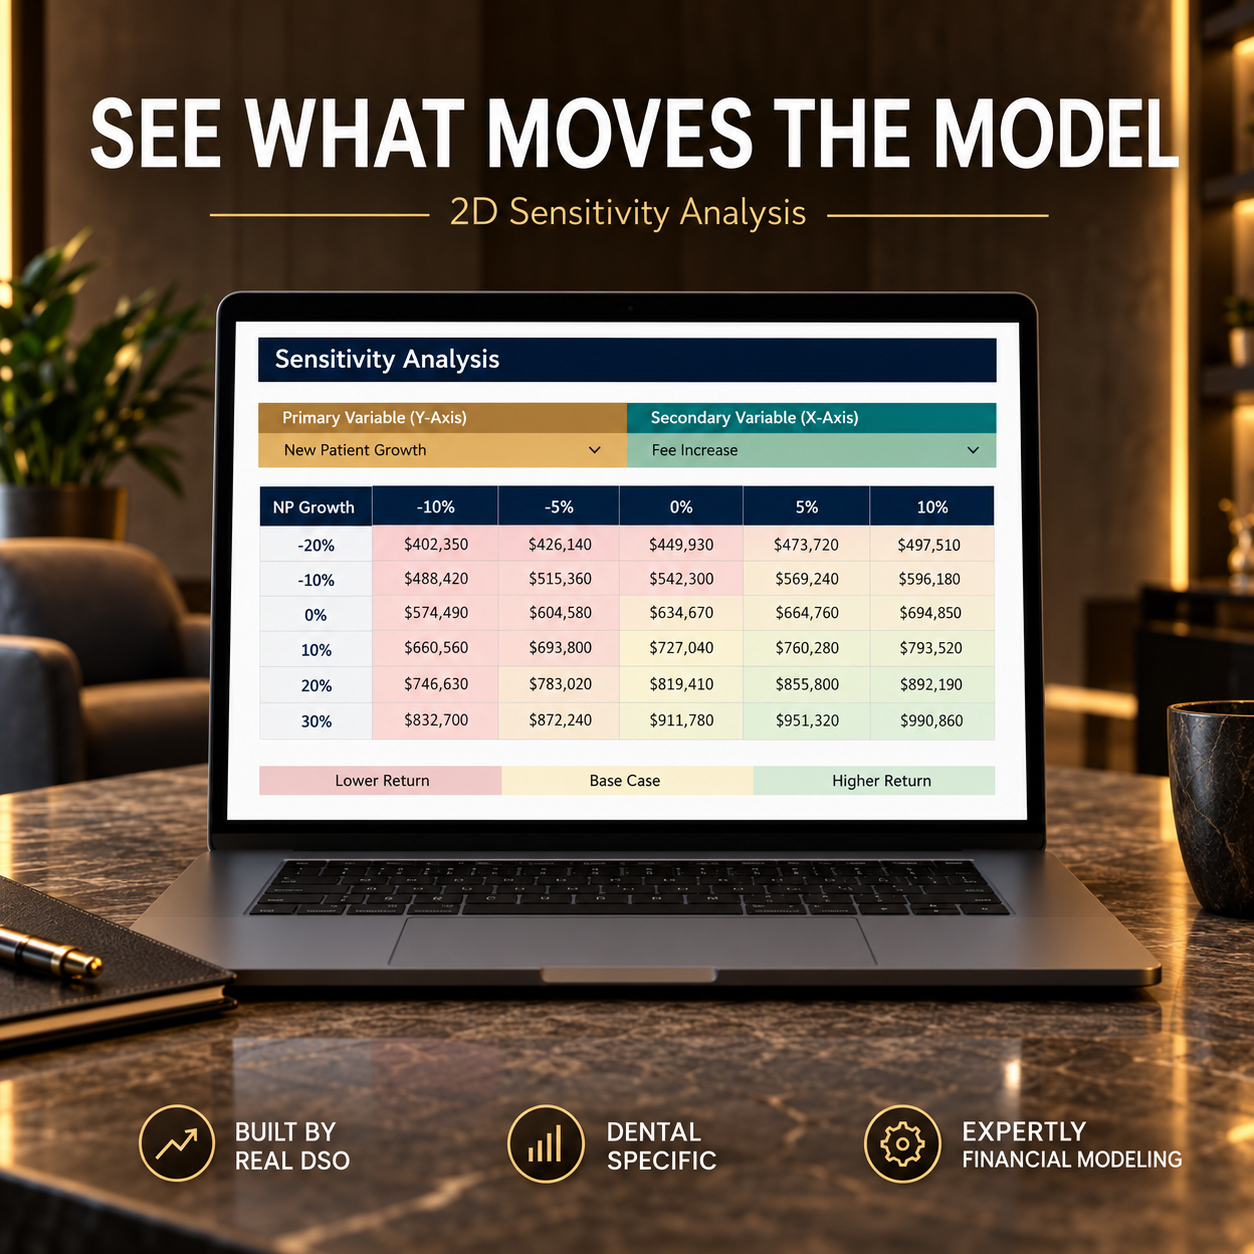
๐Ÿงฎ 2D SENSITIVITY ANALYSIS

The dedicated sensitivity matrix evaluates how combinations of:

Patient Volume ร— Average Revenue per Visit

may influence projected Year 5 EBITDA.

This provides a clear way to stress-test two important practice-performance drivers while keeping the broader selected-case model intact.


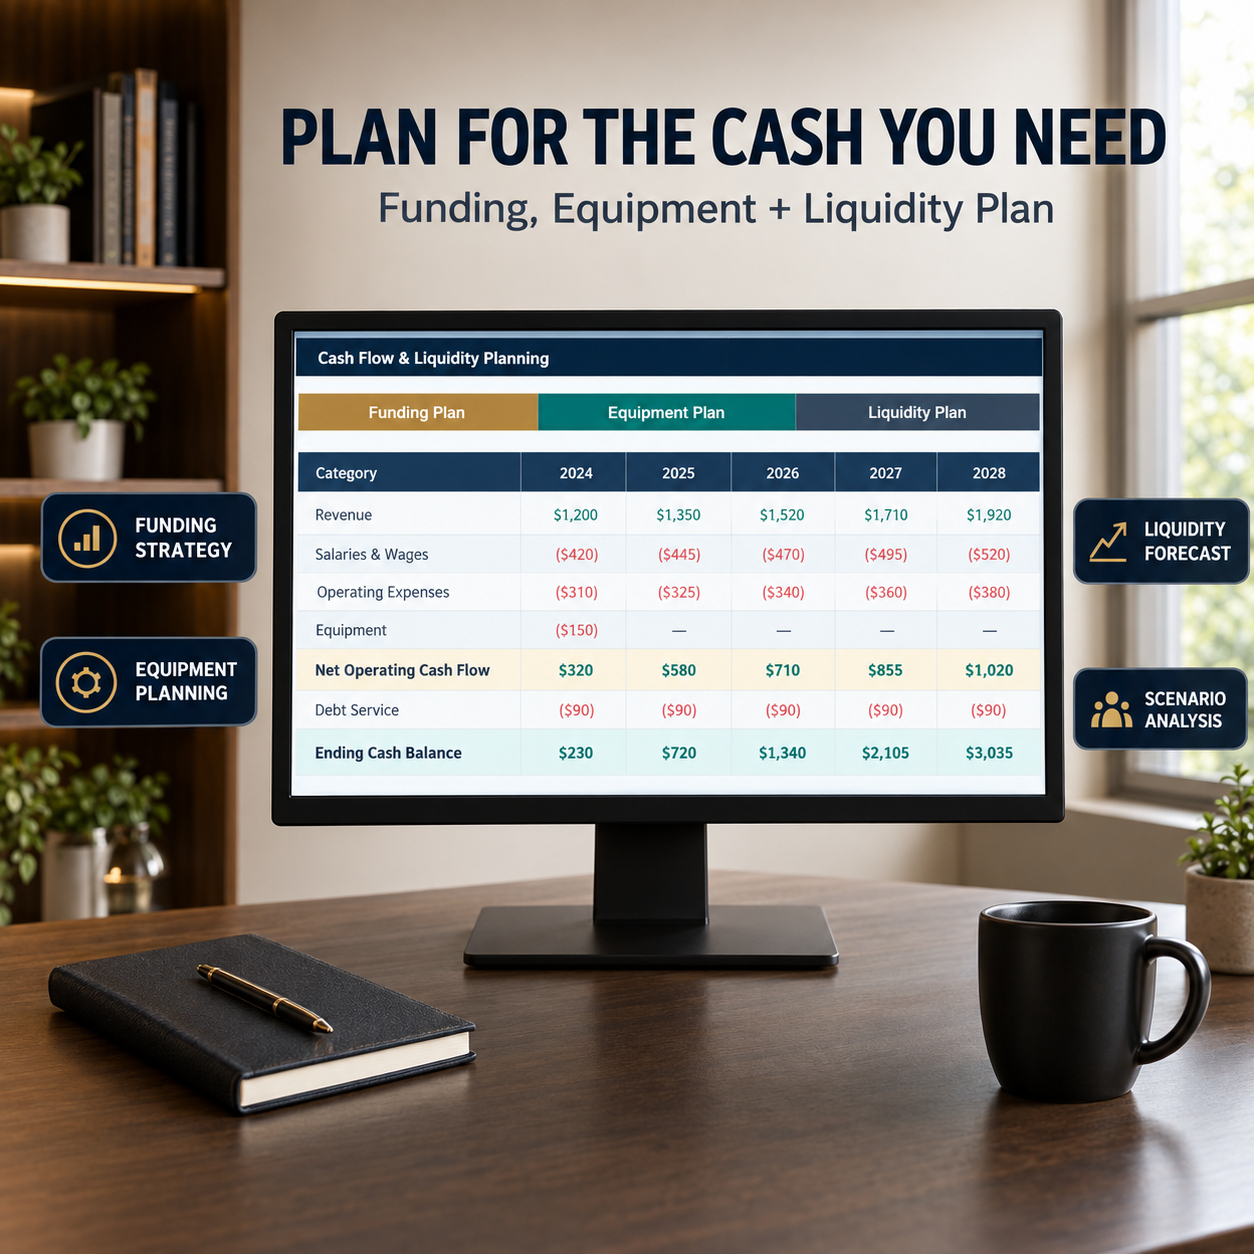
๐Ÿฆ FUNDING REQUIREMENT

The liquidity section calculates:

โœ… Opening Cash โœ… Cash Before Funding โœ… Minimum Cash Cushion โœ… Funding Required โœ… Funding Treatment โœ… Ending Cash After Funding โœ… Cumulative Funding Required


This helps users identify whether projected cash remains above their chosen minimum liquidity threshold.


๐ŸŽž๏ธ 15-SLIDE INVESTOR / MANAGEMENT POWERPOINT

The included presentation summarizes the model through:

๐Ÿฆท Practice Overview ๐Ÿ‘ฅ Patient Model ๐Ÿช‘ Capacity ๐Ÿ’ฐ Revenue Mix ๐Ÿ‘จโ€โš•๏ธ Staffing ๐Ÿงช Cost Structure ๐Ÿ“ˆ 5-Year Forecast ๐Ÿ’Ž Profitability ๐Ÿ’ง Cash Flow ๐ŸŽฏ Break-Even ๐Ÿช‘ CapEx ๐Ÿฆ Funding Requirement ๐Ÿ”„ Scenario Comparison โš ๏ธ Key Risks โญ Executive Summary


The deck is suitable for internal management reviews, planning discussions, consulting engagements, and preparation for financing or stakeholder discussions.


๐Ÿ“˜ 20-PAGE HOW-TO-USE GUIDE

The detailed PDF guide covers:

โœ… Quick Start โœ… Navigation & Safe Editing โœ… Assumptions & Scenarios โœ… Patient & Capacity Planning โœ… Treatment & Other Revenue โœ… Staffing โœ… Clinical Costs & OPEX โœ… CapEx & Depreciation โœ… Debt & Funding โœ… Three-Statement Logic โœ… Income Statement & Balance Sheet โœ… Cash Flow & Forecasts โœ… Break-Even & KPI Analysis โœ… Scenario & Sensitivity Analysis โœ… Executive Dashboard & PowerPoint โœ… Google Sheets & Troubleshooting โœ… Final QA Checklist โœ… Limitations & Disclaimer


๐Ÿ’ป TECHNICAL COMPATIBILITY

โœ… Microsoft Excel (.xlsx) โœ… Microsoft PowerPoint (.pptx) โœ… PDF Guide โœ… Google Sheets import supported โœ… No macros โœ… No APIs โœ… No live market data โœ… No automatic dental benchmarks โœ… No current treatment-price feeds โœ… No external Excel data connections


๐Ÿ“Œ Microsoft Excel remains the reference environment. The workbook can be imported into Google Sheets, although formatting, charts, or certain visual elements may vary.


โš–๏ธ IMPORTANT DISCLAIMER

This product is an editable financial planning and business-modeling template intended for informational, organizational, and decision-support purposes only.


It does not constitute financial, investment, valuation, accounting, tax, legal, regulatory, medical, dental, clinical, financing, or other professional advice.


All sample prices, patient counts, salaries, costs, CapEx values, debt terms, and other assumptions are illustrative placeholders. They are not current dental benchmarks, treatment-price recommendations, salary benchmarks, or forecasts.

Users remain responsible for replacing sample data with practice-specific information, reviewing all assumptions and outputs, and consulting qualified professional advisers where appropriate.


๐Ÿ“Š This complete planning system brings patient growth, treatment capacity, practice economics, financial forecasting, break-even analysis, liquidity, and funding requirements into one connected framework. It is designed to help practice owners, founders, consultants, and finance professionals evaluate assumptions more clearly, identify potential operational or financial pressure points, and prepare more structured management and financing discussions.

This Best Practice includes
1 Dental Practice Financial Model (.xlsx), 1 Investor / Management Summary Deck (.pptx), 1 How-to-Use Guide (.pdf)

Acquire business license for $79.90

Add to cart

Add to bookmarks

Discuss

Further information

The objective of this model is to provide dental practice owners, founders, finance professionals, consultants, and management teams with a structured framework for connecting patient activity and practice capacity with financial performance, profitability, liquidity, and funding requirements.

Users can model patient growth, retention, visits, treatment volumes, revenue per procedure, provider capacity, staffing, payroll, clinical costs, operating expenses, CapEx, debt, working capital, and financing assumptions within one integrated planning system.

The model is designed to help users assess whether projected patient demand is compatible with operational capacity, understand the financial implications of pricing and treatment-volume assumptions, calculate break-even requirements, compare alternative scenarios, and identify potential cash or funding needs.

The integrated financial statements, KPI Analysis, Executive Dashboard, scenario tools, sensitivity matrix, and PowerPoint Deck also provide a consistent framework for recurring management reviews and structured financing or stakeholder discussions.

This model is particularly suitable for:

Existing dental practices
New dental practice concepts
Dental practice founders
Practice owners
Dental business managers
CFOs and finance managers
Business planners
Management consultants
Dental practice consultants
Fractional CFOs
Entrepreneurs
Management teams

It is especially useful when preparing a five-year business plan, reviewing patient and treatment capacity, planning staffing and payroll, testing pricing and patient-growth assumptions, evaluating clinical and operating costs, planning equipment investment, estimating break-even requirements, comparing scenarios, or assessing future liquidity and funding needs.

This model does not replace accounting software, dental practice-management systems, clinical software, ERP platforms, specialist FP&A systems, professional valuations, lender underwriting, or professional healthcare consulting.

It does not provide treatment recommendations, clinical guidance, patient advice, automatic dental pricing, salary benchmarks, industry benchmarks, reimbursement rates, insurance data, live market feeds, or regulatory guidance.

It does not include APIs, live accounting feeds, bank connections, or external data integrations.

The template does not constitute financial, investment, valuation, accounting, tax, legal, regulatory, dental, medical, clinical, financing, or professional business advice.


0.0 / 5 (0 votes)

please wait...