Originally published: 18/04/2018 11:50
Publication number: ELQ-79722-1
View all versions & Certificate
Publication number: ELQ-79722-1
View all versions & Certificate

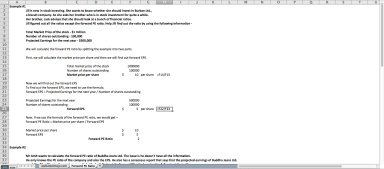
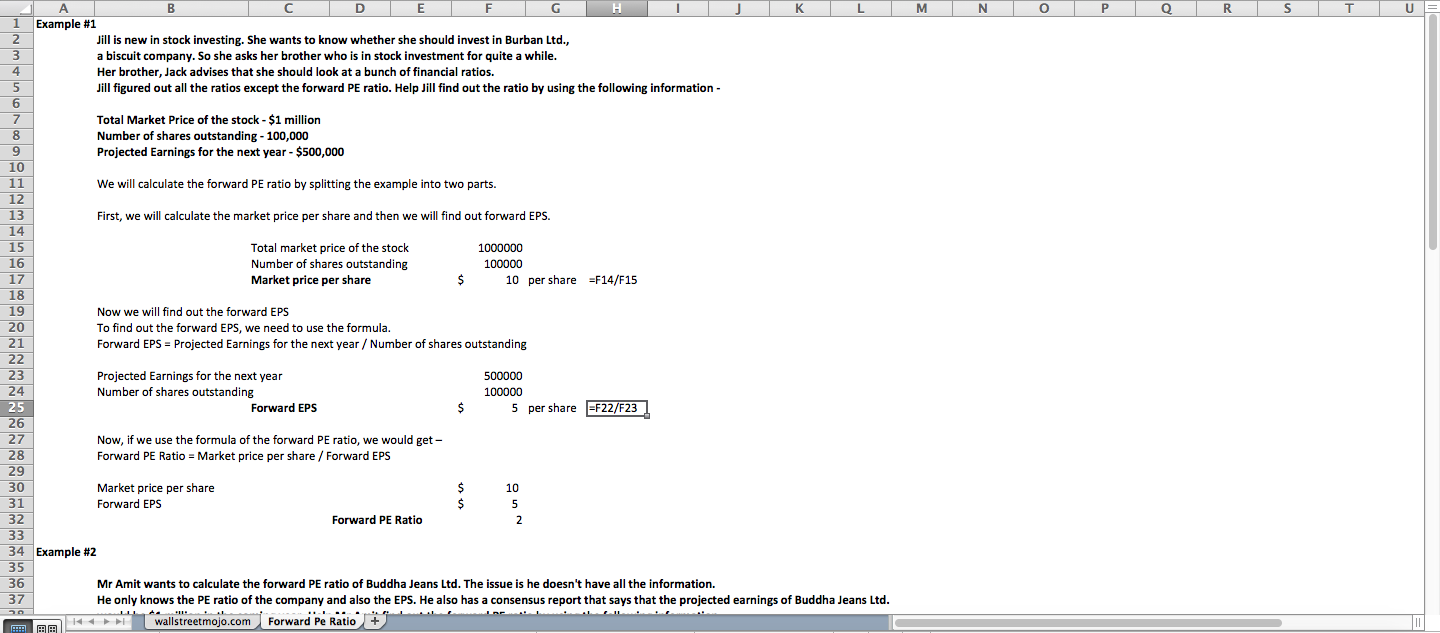
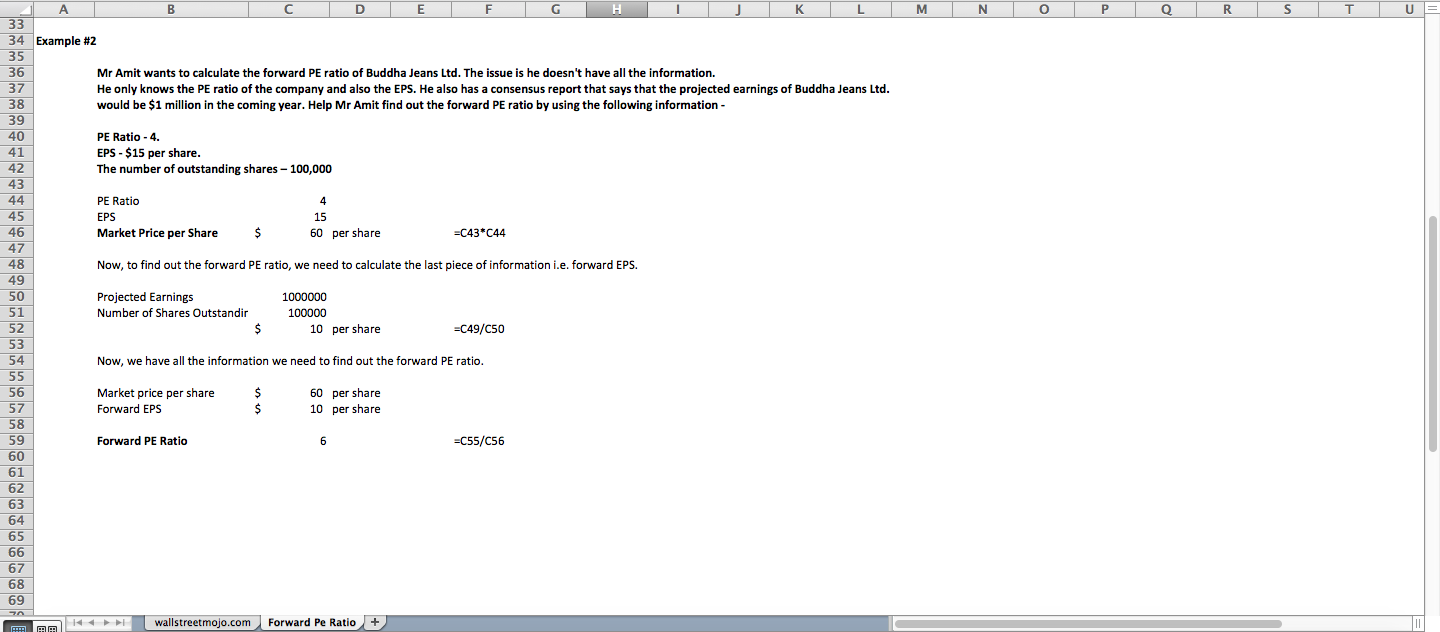
Forward PE (Price/Earnings) Ratio Excel Template
A template to help investors calculate forward PE ratio in Excel.
Dheeraj Vaidya CFA FRM offers you this Best Practice for free!
download for free
Add to bookmarks
