

Originally published: 06/02/2025 07:56
Publication number: ELQ-53686-1
View all versions & Certificate
Publication number: ELQ-53686-1
View all versions & Certificate

Peer to Peer (P2P) Lending Platform Finance Model 20 Years 3 Statement
A comprehensive editable, MS Excel spreadsheet for tracking P2P Lending Platform finances. Income Statements, Balance Sheets, & Cash Flow Statements.
 by AllFinancialModels
AllFinancialModels offer a curated selection of high-quality yet financial model templates designed to support a wide range of business needs.Follow
Description
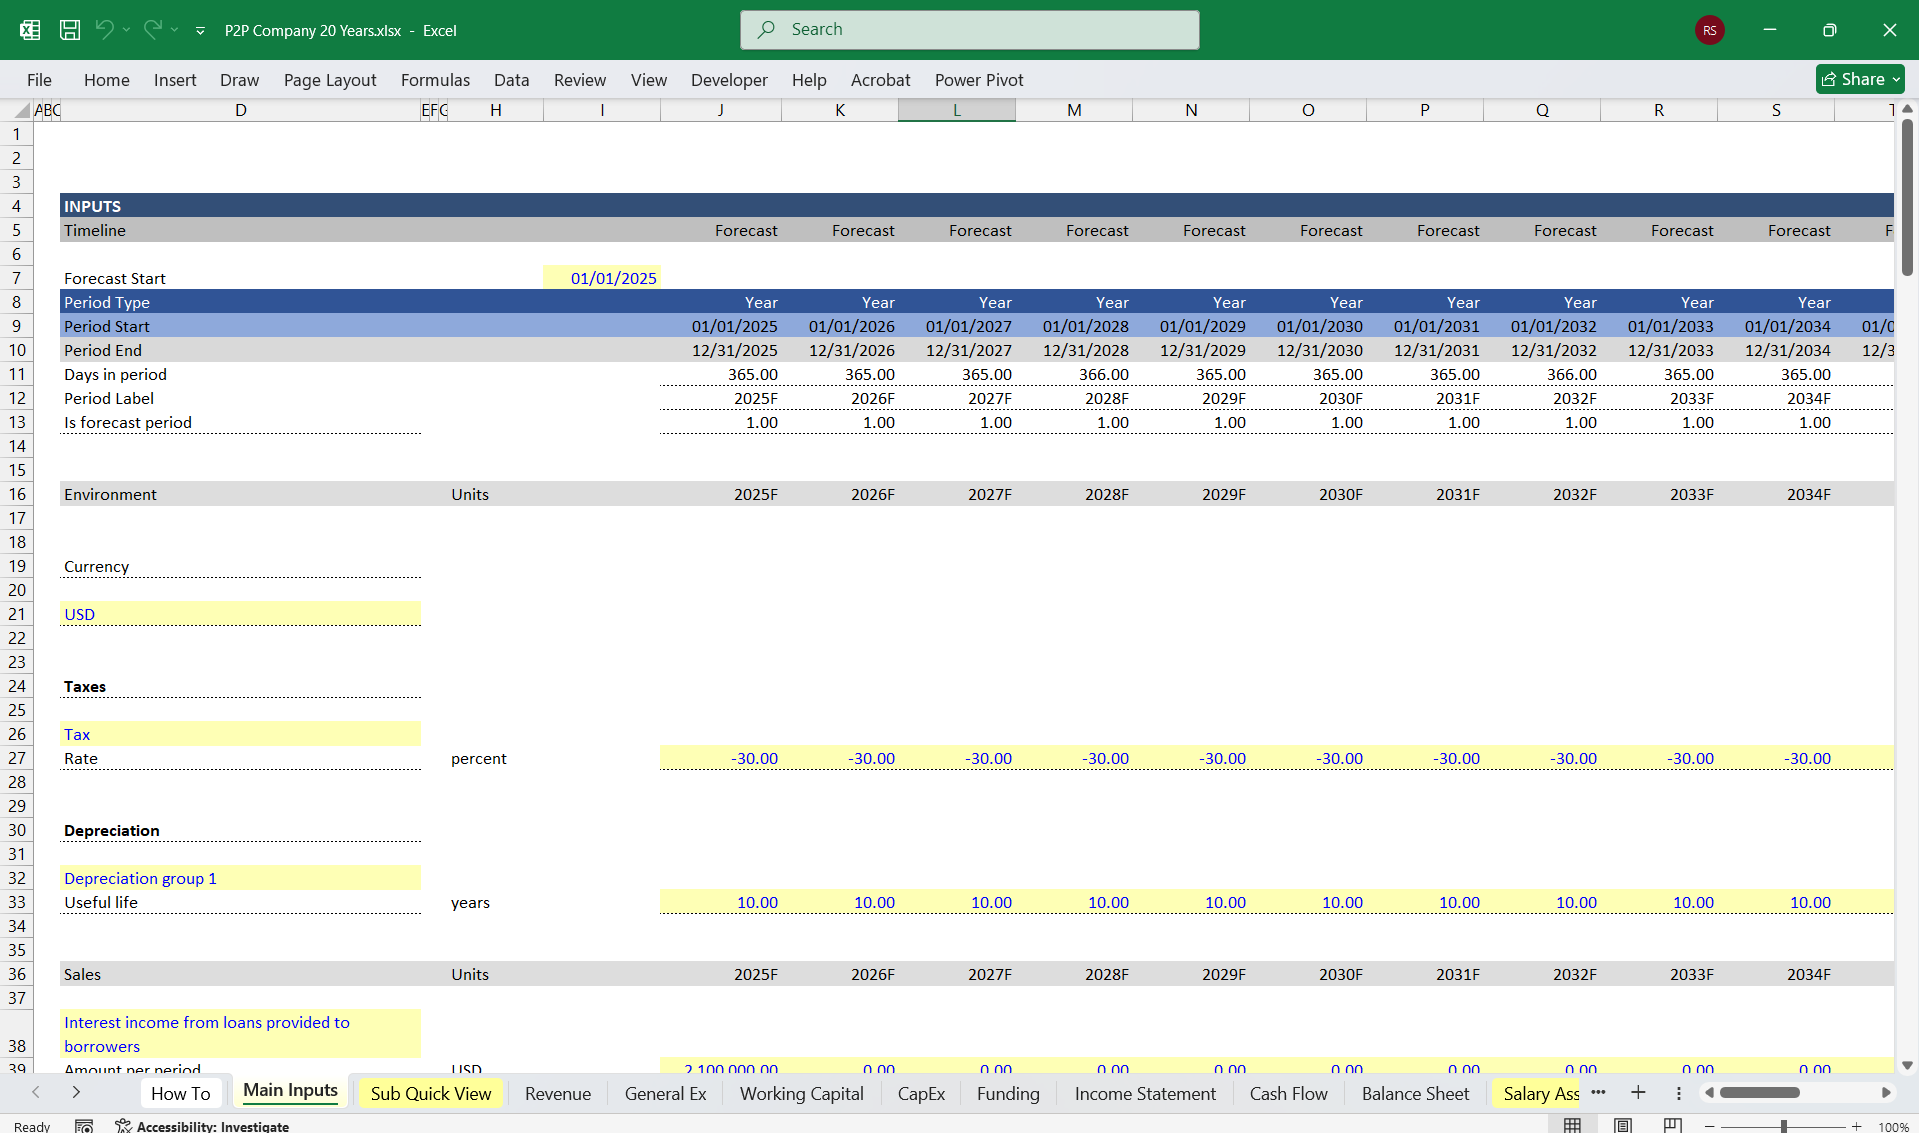
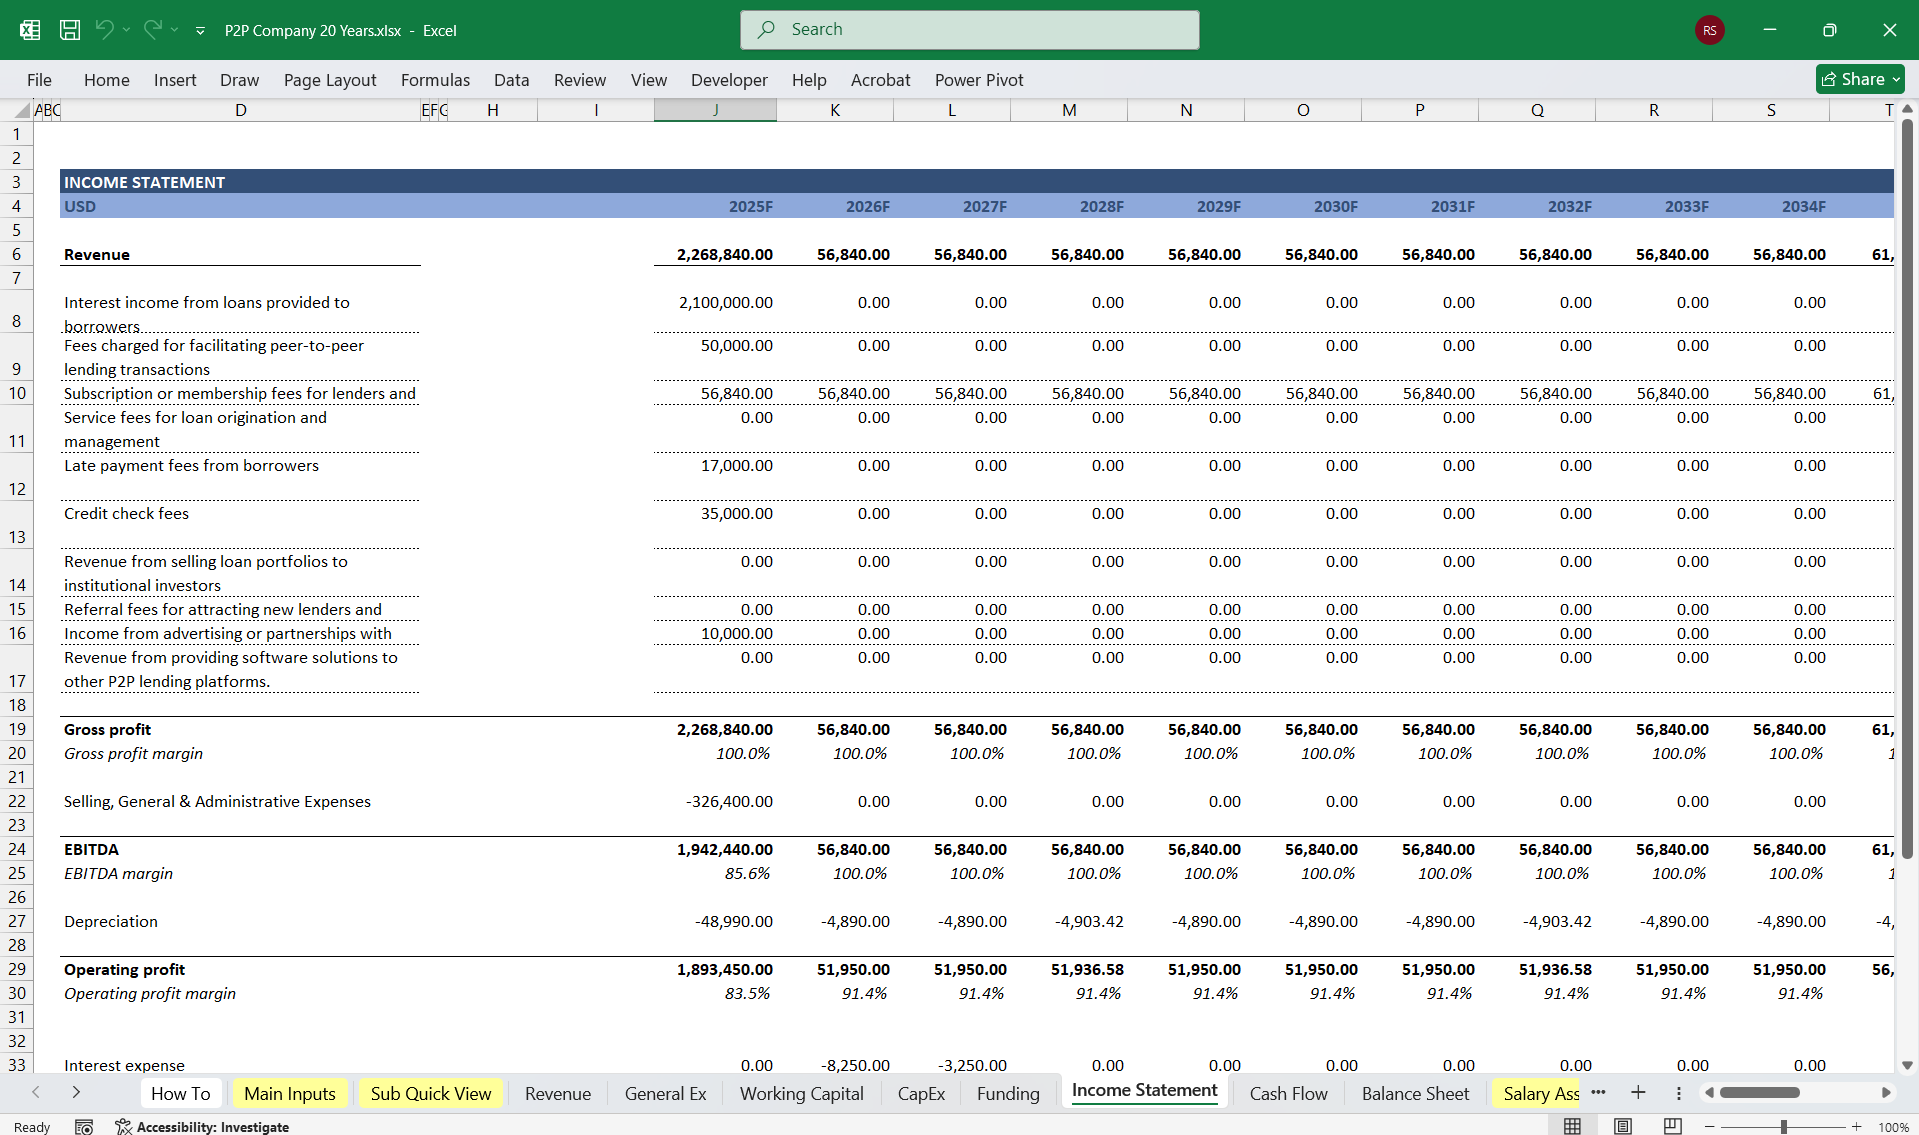
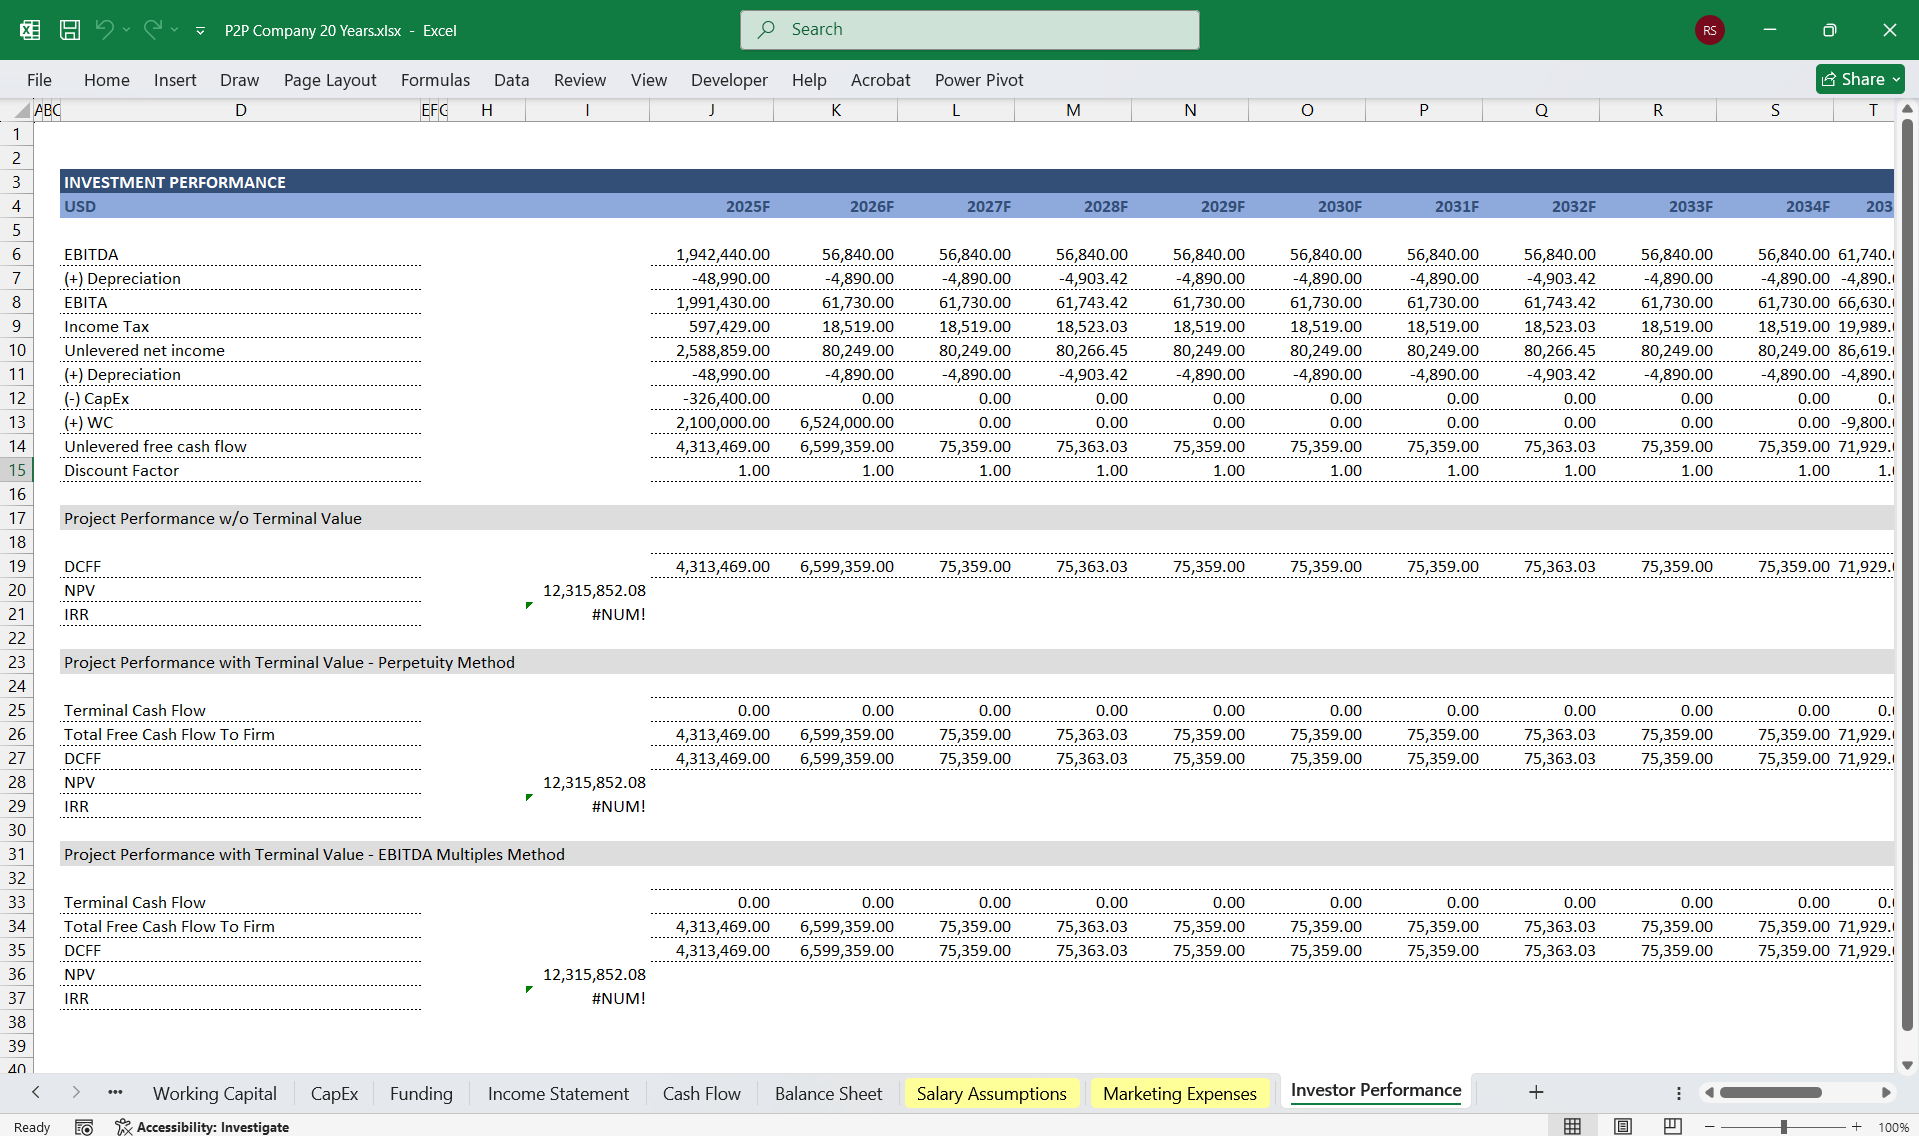
This 3-Statement Financial Model for a Peer-to-Peer (P2P) Lending Platform includes an Income Statement, Cash Flow Statement, and Balance Sheet, interconnected to provide a comprehensive financial outlook. Below is a detailed breakdown of each section:
1. Income Statement (Profit & Loss Statement)The income statement reflects the platform’s profitability over a period, capturing revenues, expenses, and net income.
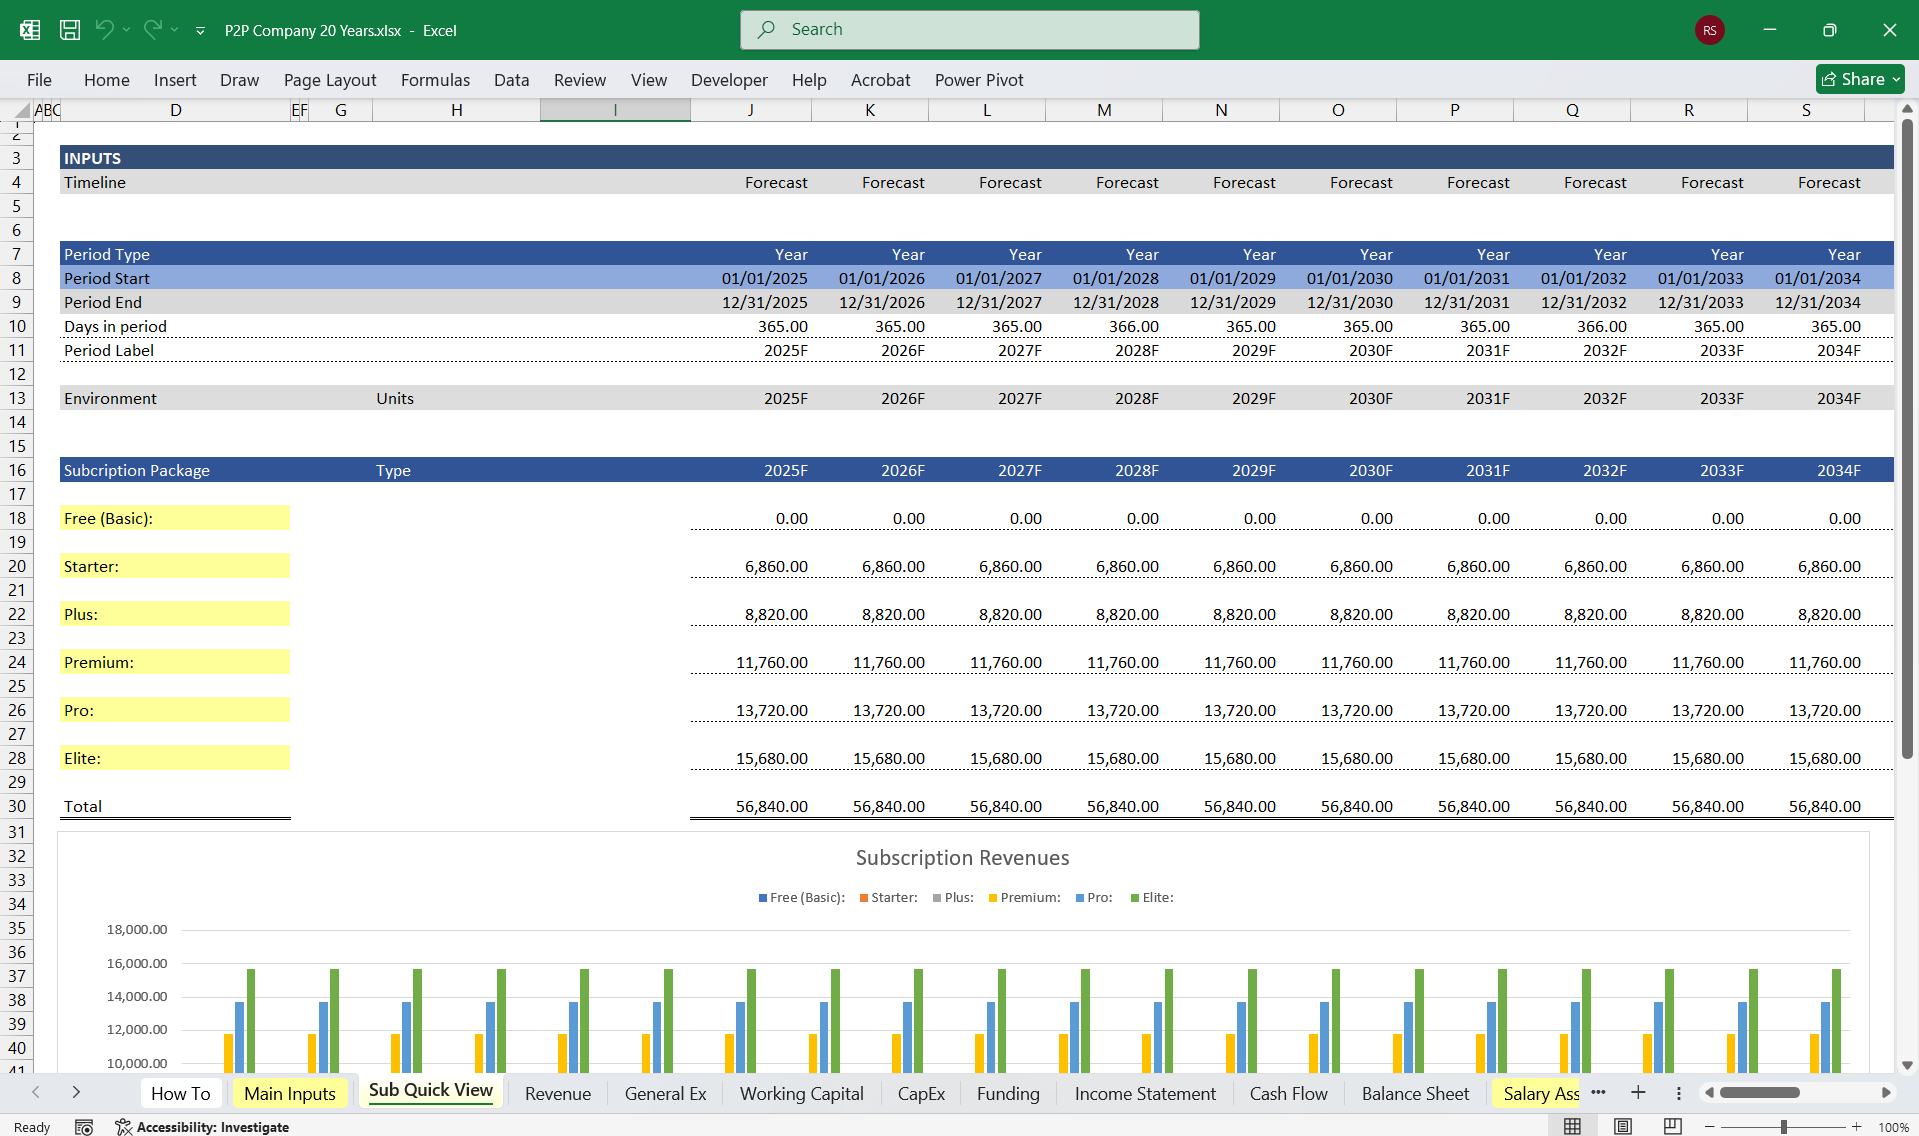
This 6-tier subscription model for a Peer-to-Peer (P2P) Lending Platform allows flexibility for different user segments, from casual investors to high-net-worth individuals and institutional lenders. Below is a structured tier system with features, pricing, and value propositions:
1. Free Tier (Basic) – "Free"Target: New users, small lenders, and casual investors
Features:
Features:
Features:
Features:
Features:
Features:
💡 One-Time Loan Analysis Reports – Detailed insights on borrower risk.
💡 Premium Customer Support Package – Instant support for lower tiers.
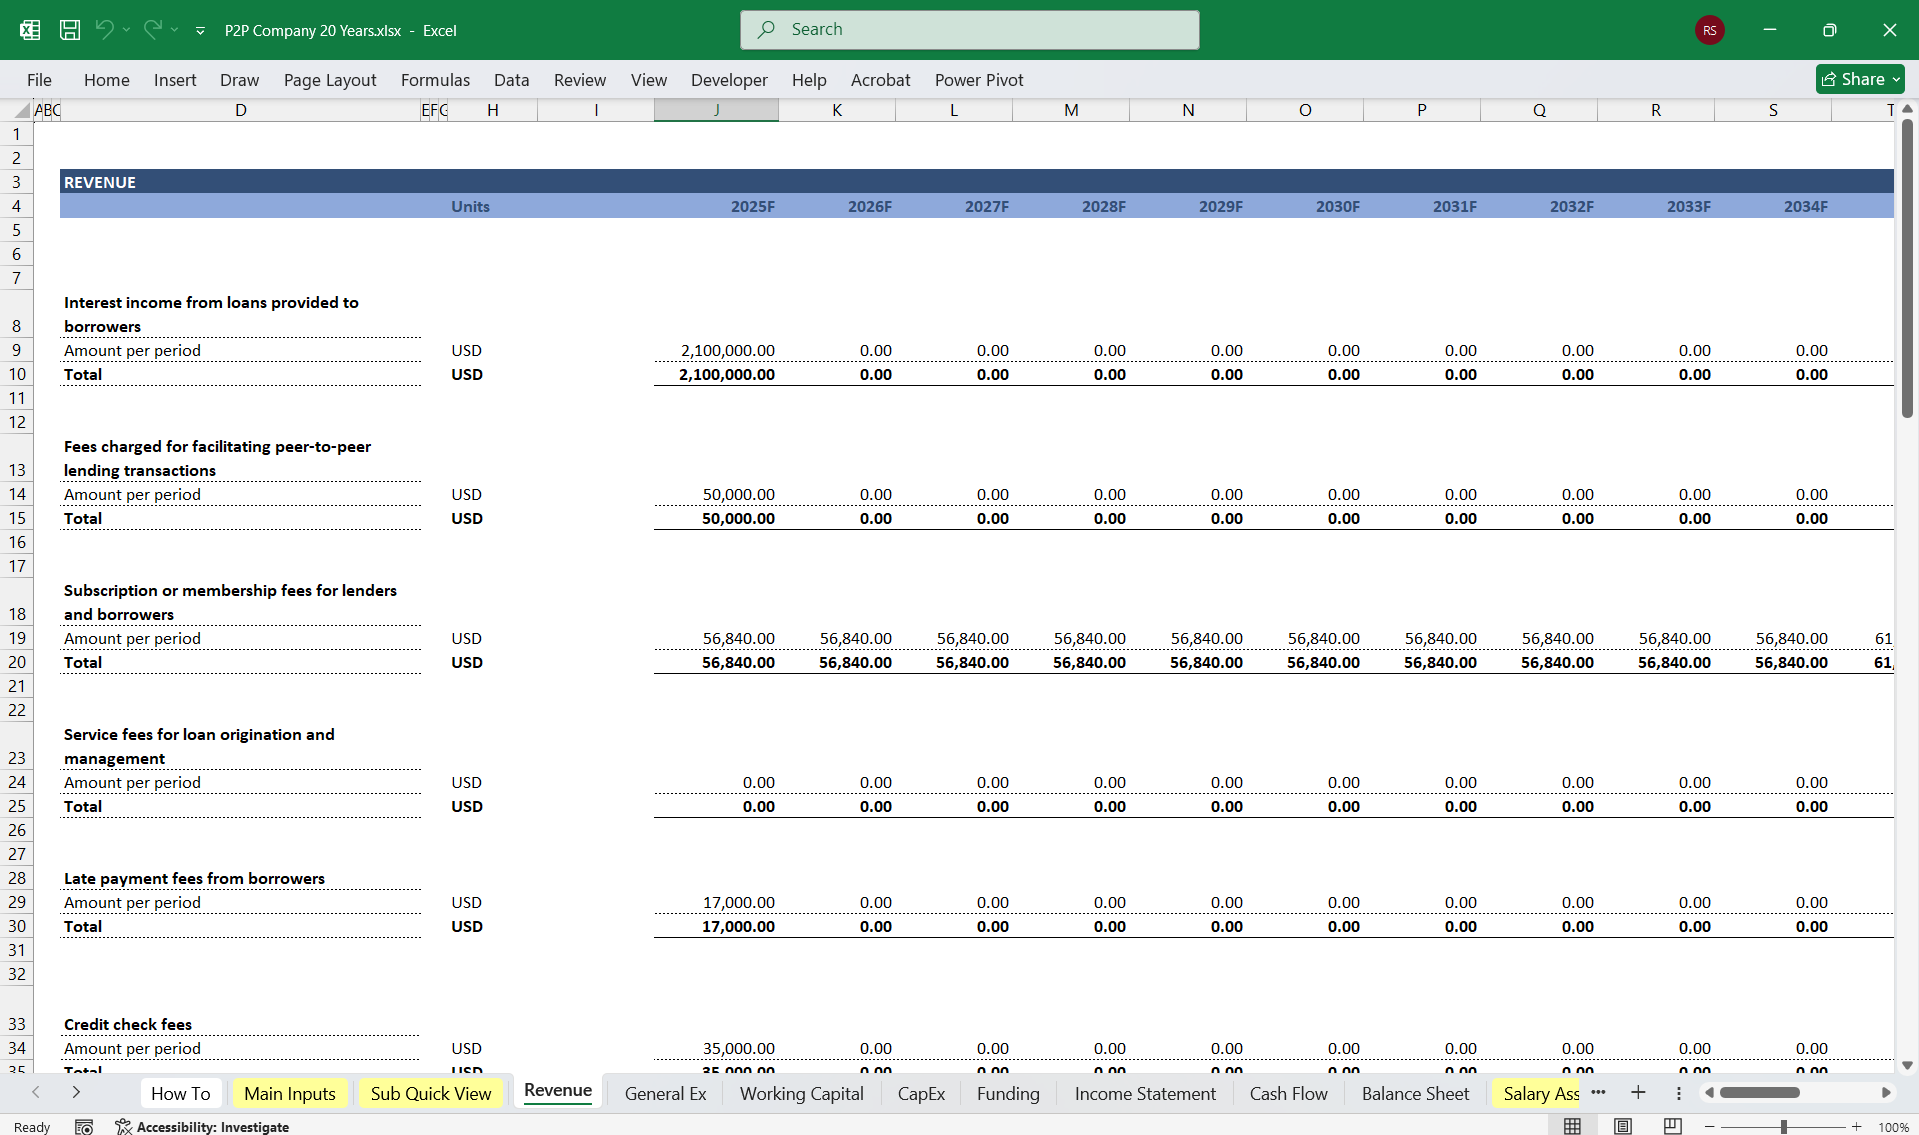
Revenue Streams
2. Cash Flow StatementTracks cash movements to assess liquidity and operational efficiency.
Operating Cash Flow
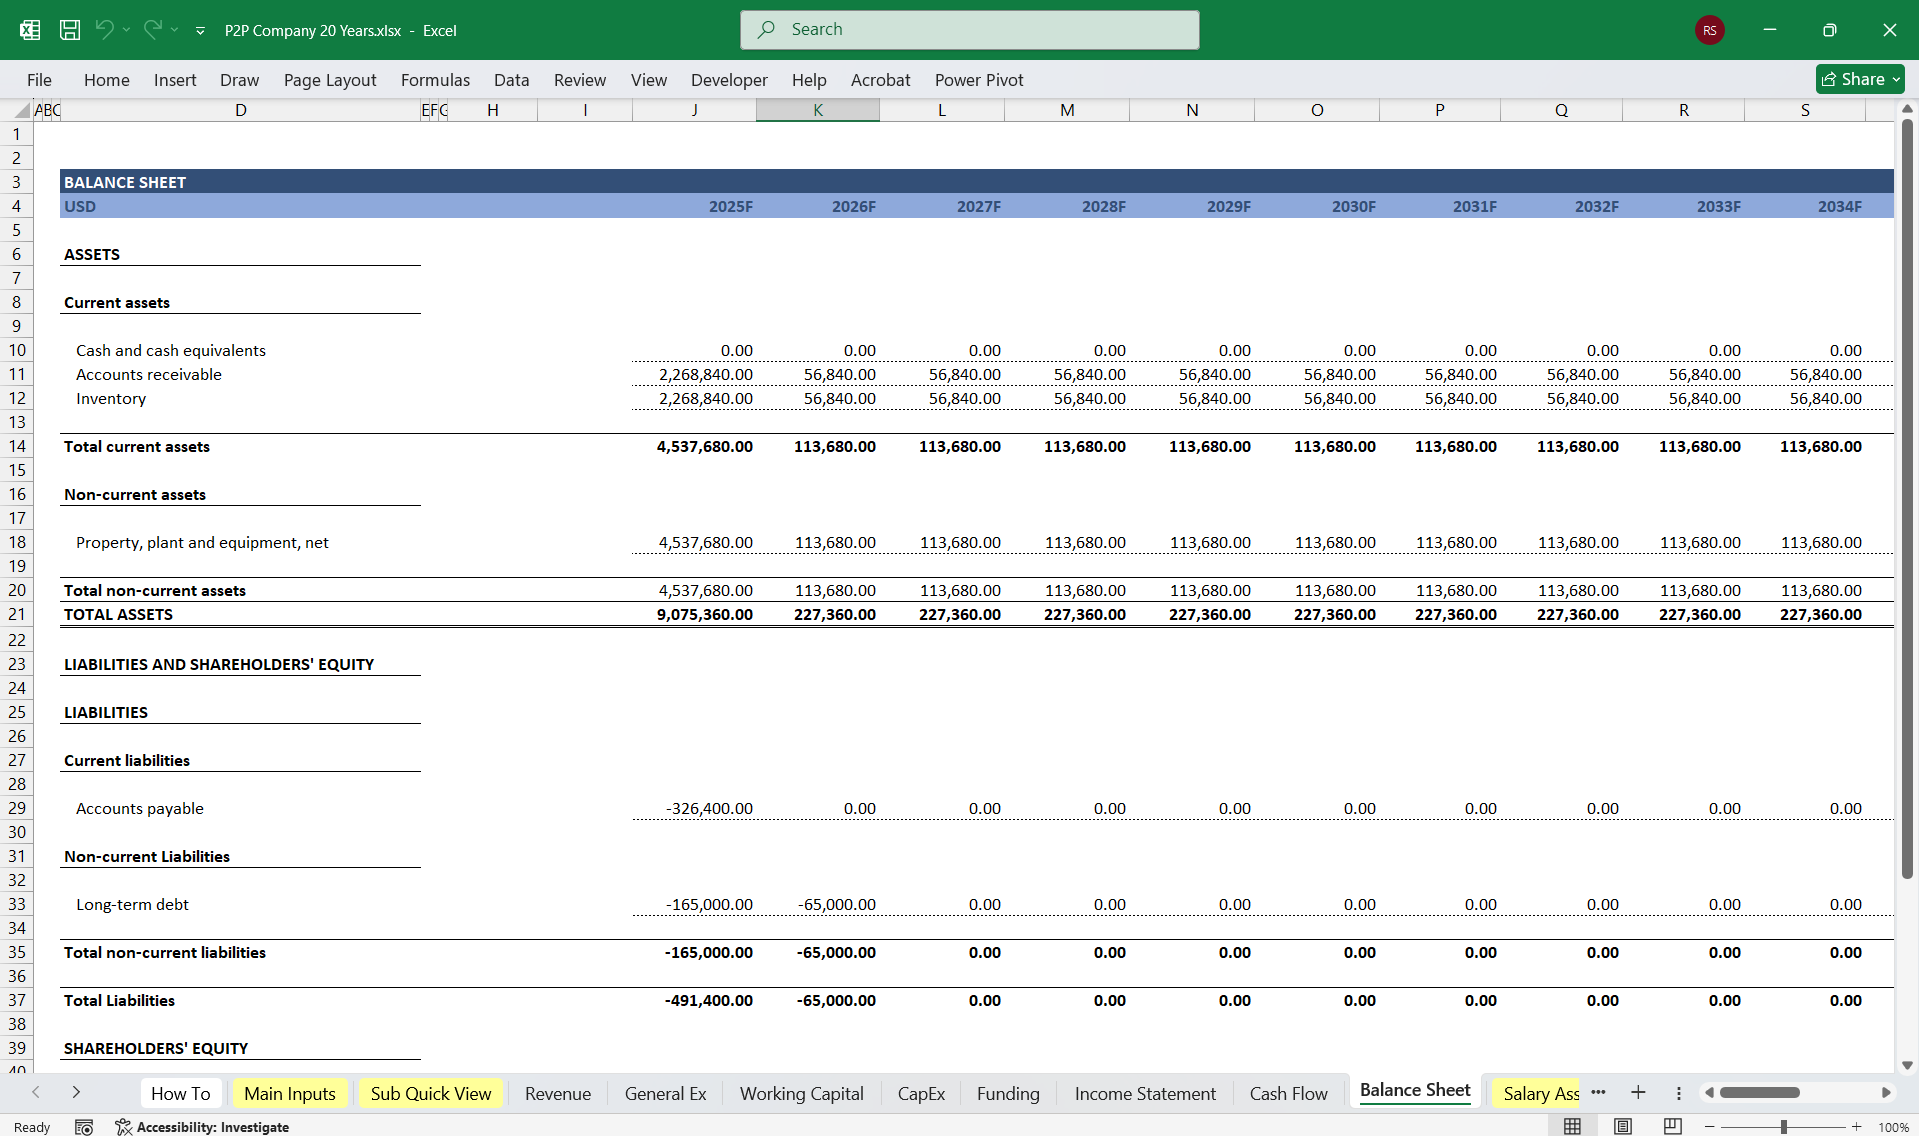
3. Balance SheetReflects the company’s financial position at a point in time.
AssetsCurrent Assets
ConclusionThis 3-statement financial model for a P2P lending platform provides insights into revenue generation, cost management, cash flows, and financial health. Key considerations include:
This 3-Statement Financial Model for a Peer-to-Peer (P2P) Lending Platform includes an Income Statement, Cash Flow Statement, and Balance Sheet, interconnected to provide a comprehensive financial outlook. Below is a detailed breakdown of each section:
1. Income Statement (Profit & Loss Statement)The income statement reflects the platform’s profitability over a period, capturing revenues, expenses, and net income.
This 6-tier subscription model for a Peer-to-Peer (P2P) Lending Platform allows flexibility for different user segments, from casual investors to high-net-worth individuals and institutional lenders. Below is a structured tier system with features, pricing, and value propositions:
1. Free Tier (Basic) – "Free"Target: New users, small lenders, and casual investors
Features:
- Access to basic marketplace listings
Loan browsing & investing up to a capped amount (e.g., $1,000)
Standard credit scoring data
Basic reporting & portfolio tracking
Standard customer support
No auto-investing or secondary market access
Limited transaction history
Features:
- Everything in Free Tier +
Increased investment cap (e.g., $10,000)
Early access to new loan listings
Basic auto-investing tools
Advanced credit scoring metrics
Community forum access
Limited access to premium loan categories
Features:
- Everything in Bronze Tier +
Unlimited investing (no cap)
Full auto-investing customization
Access to secondary market trading - Portfolio risk analysis & projections
Priority customer support
No API access or custom risk scoring models
Features:
- Everything in Silver Tier +
VIP loan listings with exclusive deals
Customized credit risk scoring tools
Tax optimization & advanced reporting
Early access to platform innovations
Dedicated account manager - Limited institutional investment tools
Features:
- Everything in Gold Tier +
API access for automated investing
Bulk loan purchasing options
Real-time data feeds & analytics dashboards
Direct integration with external financial tools
Customizable risk assessment models
No private lending pools or white-label solutions
Features:
- Everything in Platinum Tier +
White-label solutions for branded lending platforms
Private loan pools & syndicate investing
Full regulatory compliance support
Custom AI-driven credit scoring solutions
Dedicated data science & engineering support
24/7 dedicated account & risk management team
💡 One-Time Loan Analysis Reports – Detailed insights on borrower risk.
💡 Premium Customer Support Package – Instant support for lower tiers.
Revenue Streams
- Loan Origination Fees – Fees charged to borrowers upon successful loan issuance (e.g., 1%-5% of loan amount).
- Servicing Fees – Ongoing fees charged to investors/lenders for managing loans (e.g., 0.5%-2% of outstanding loan balance).
- Late Payment Fees – Penalties imposed on borrowers for overdue payments.
- Interest Spread – If the platform funds loans itself, it earns an interest spread between borrower rates and lender returns.
- Secondary Market Fees – If the platform allows loan resale, it earns transaction fees.
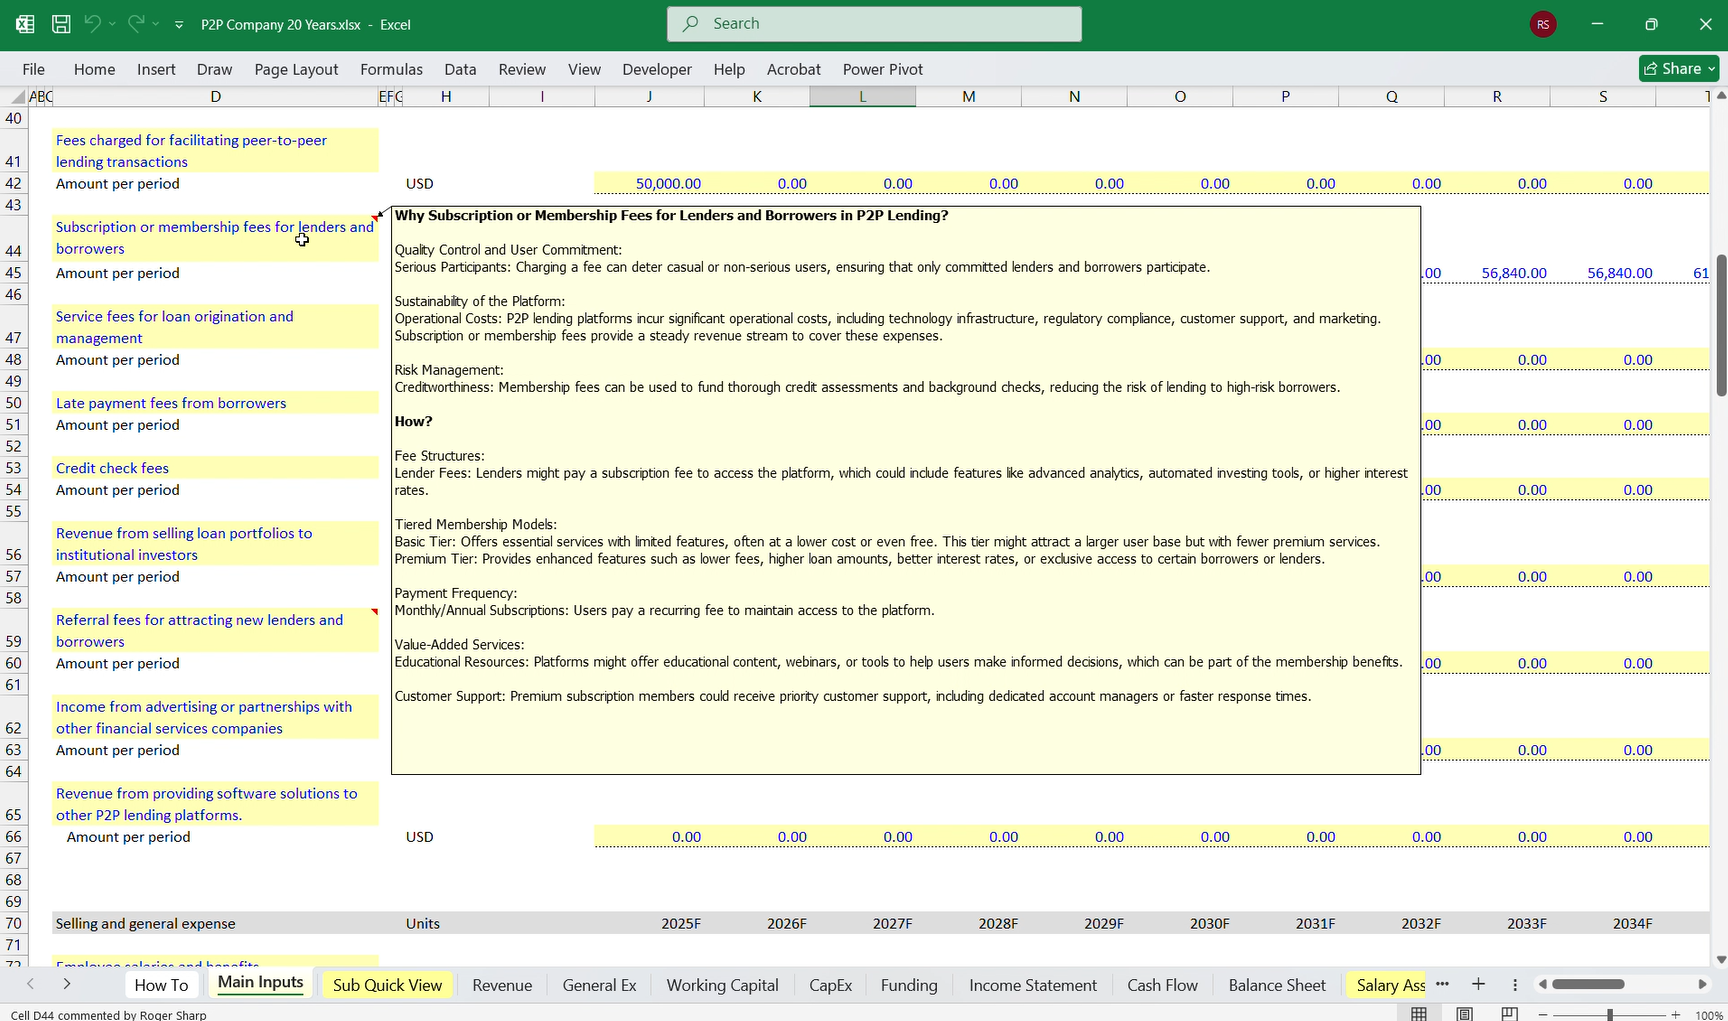
- Subscription Fees – Fees for premium services or enhanced investor tools.
- Advertising Revenue – Income from third-party ads if applicable.
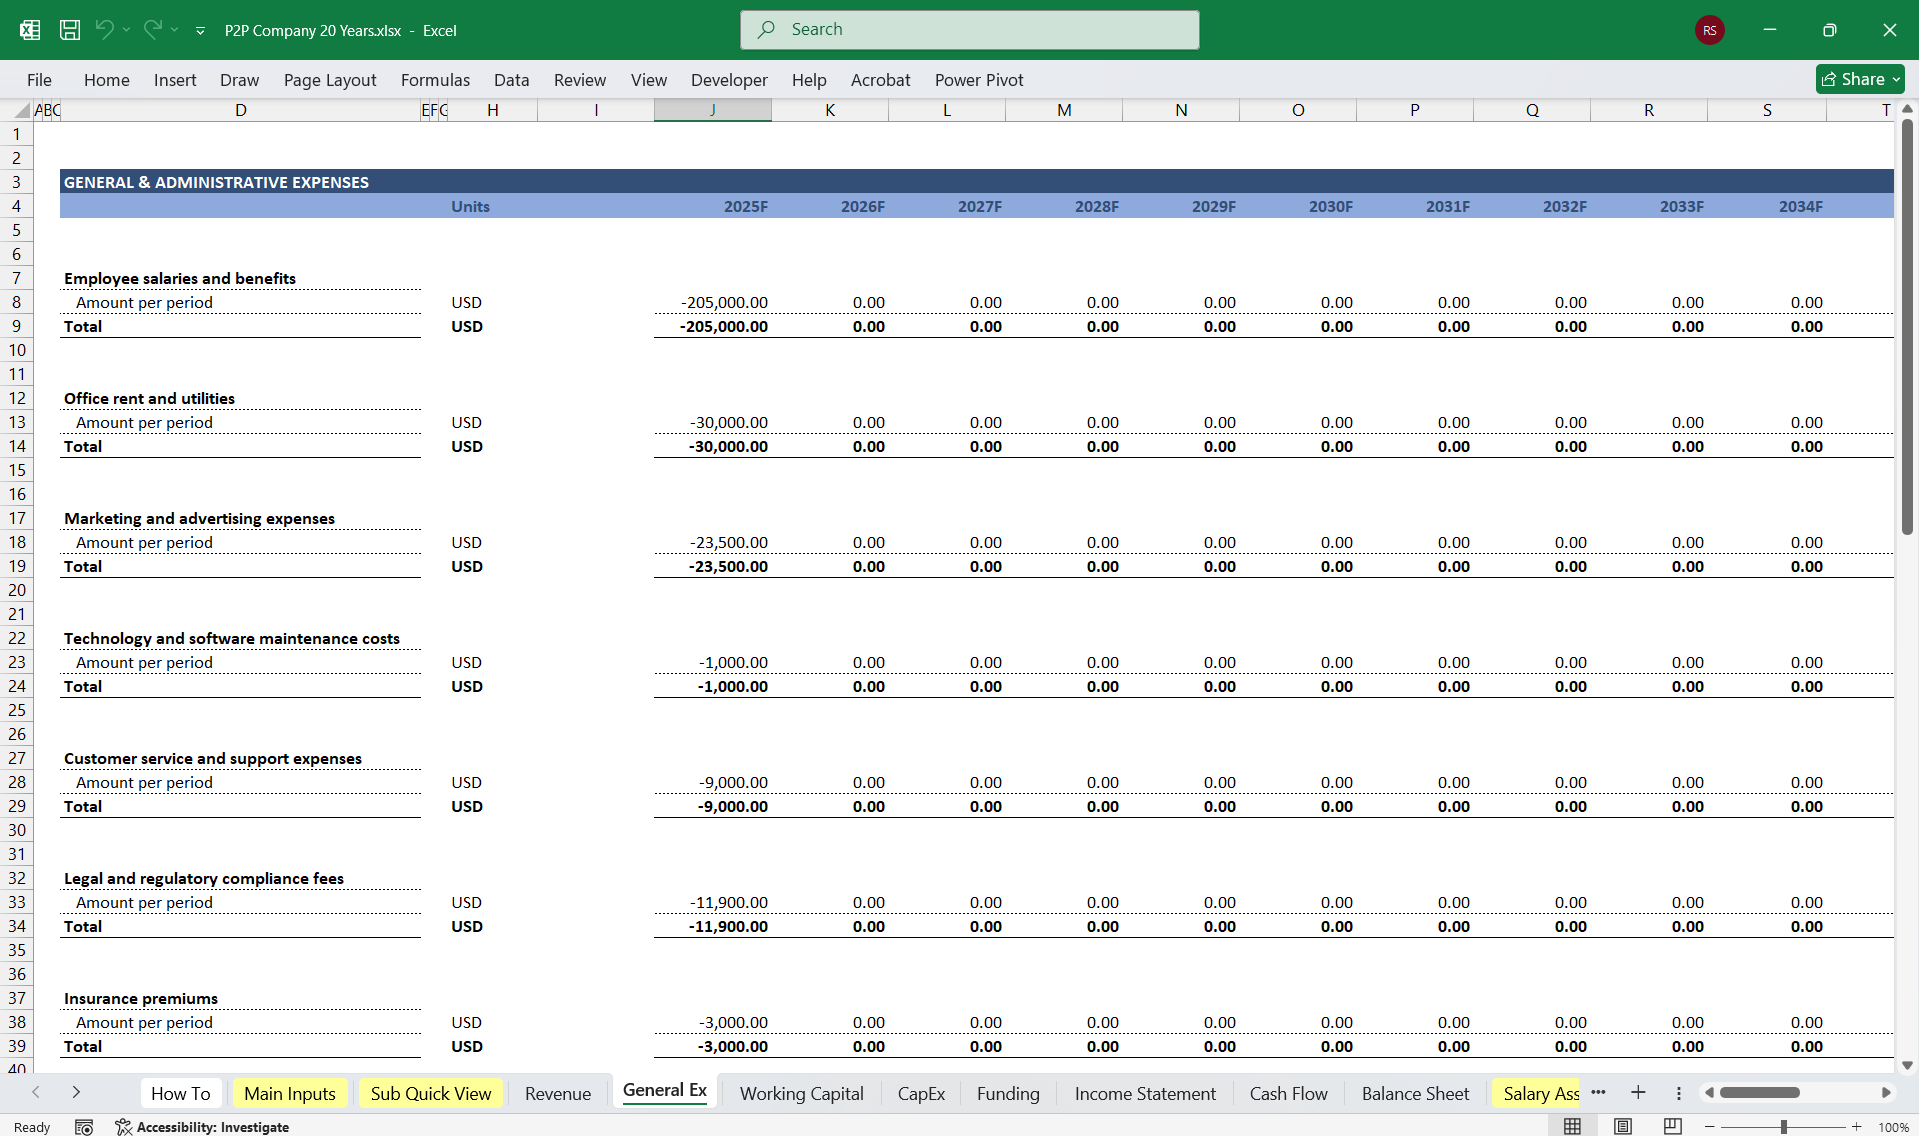
- Loan Processing Costs – Credit checks, KYC (Know Your Customer), and fraud detection.
- Transaction Costs – Payment gateway charges for fund transfers.
- Customer Support Costs – Support staff and dispute resolution.
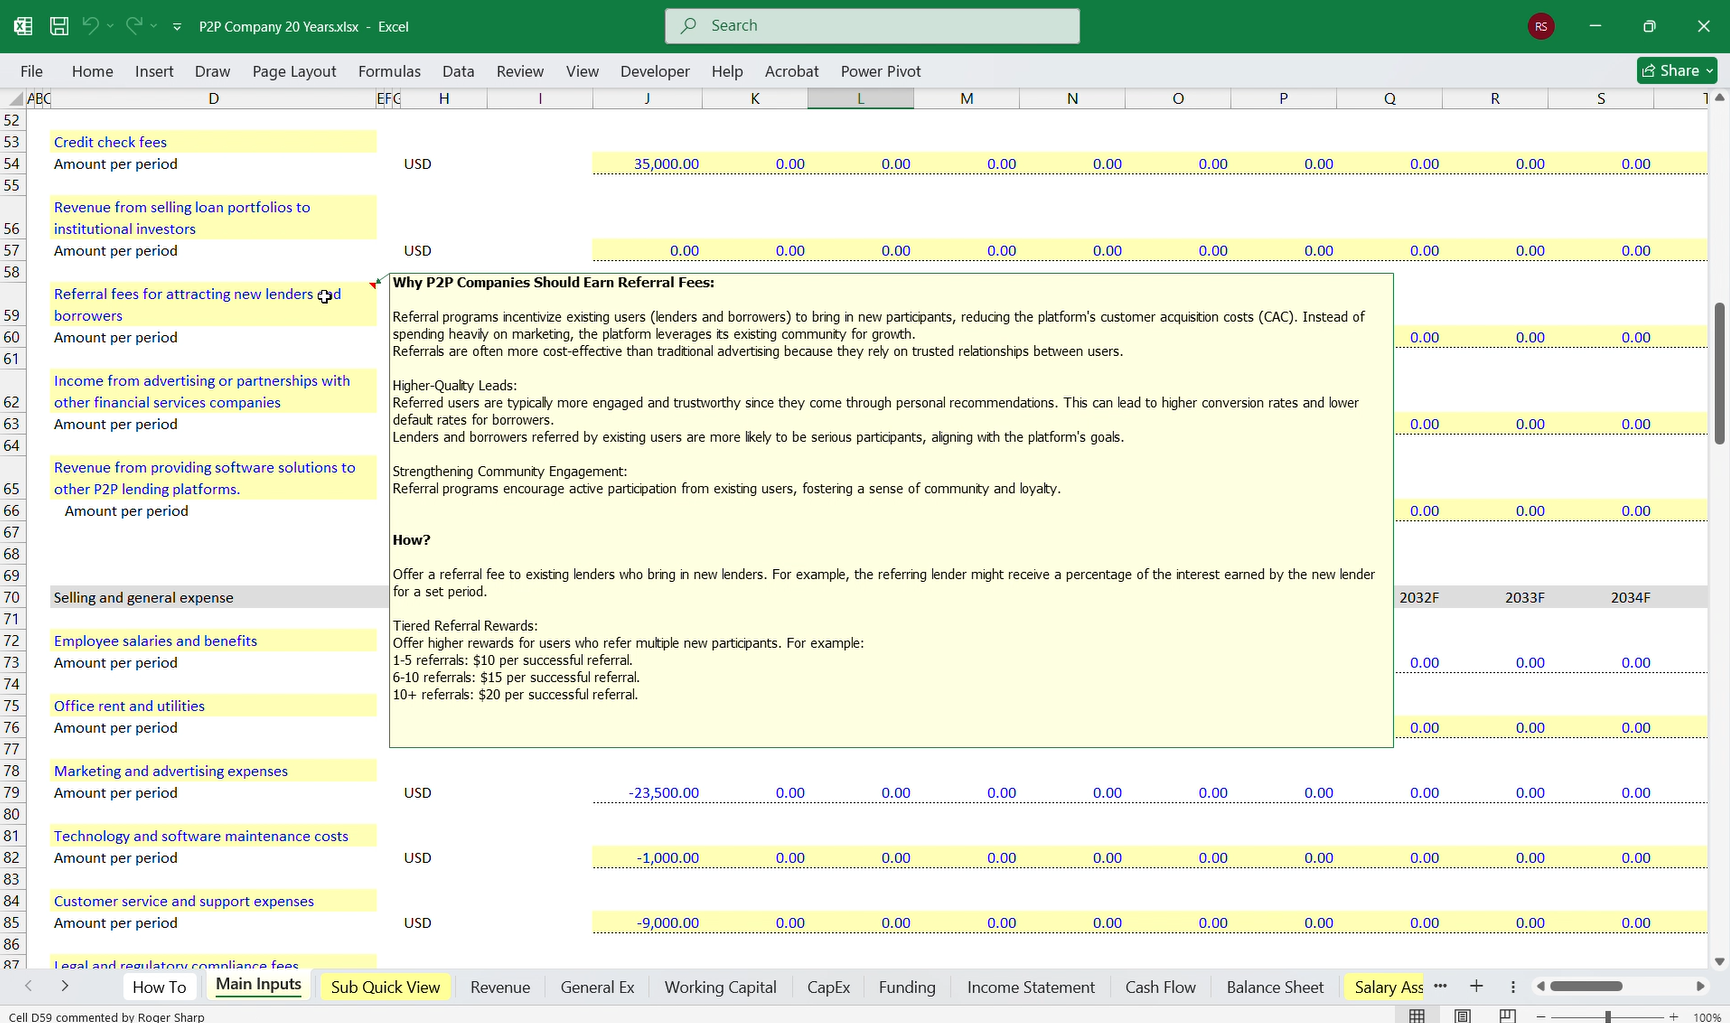
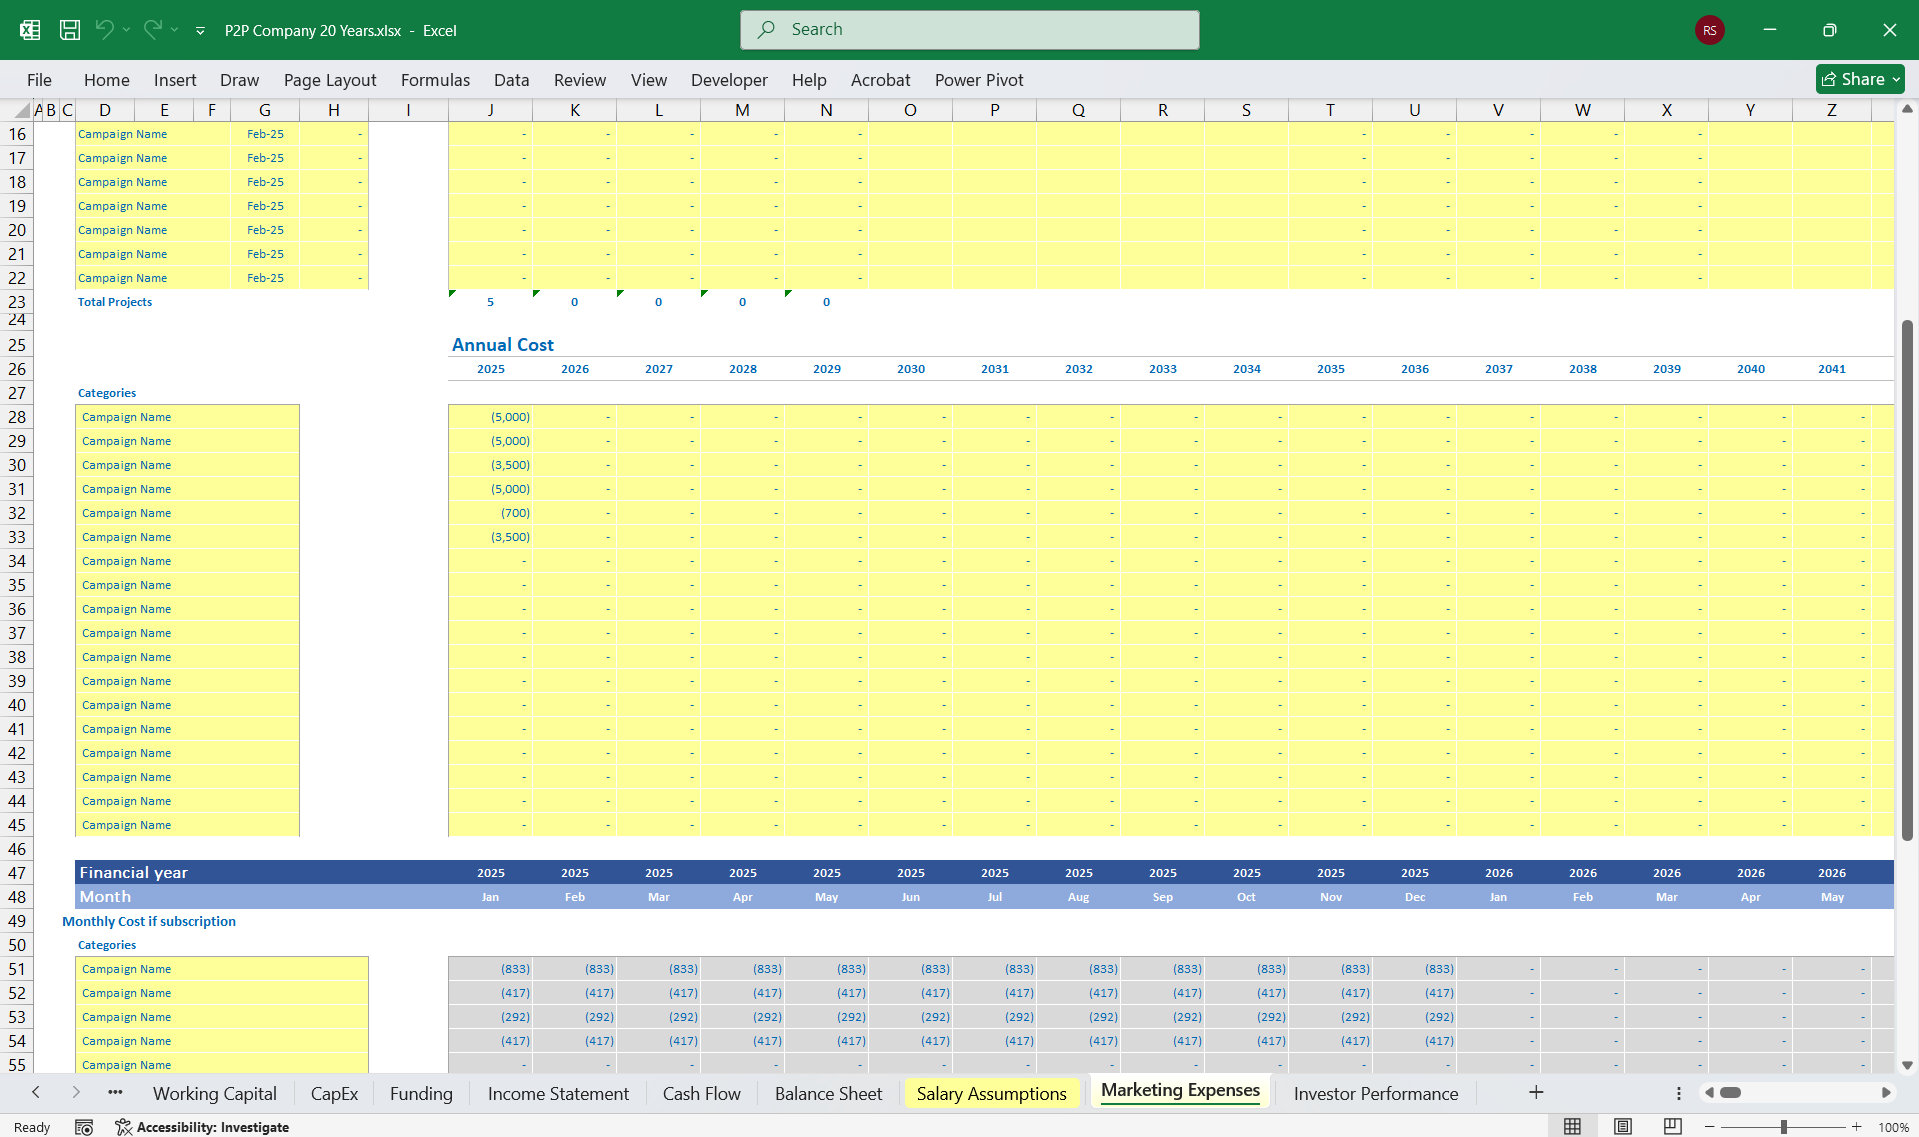
- Marketing & Customer Acquisition – Digital marketing, referral programs, and affiliate partnerships.
- Technology & Platform Development – IT infrastructure, app maintenance, and cybersecurity.
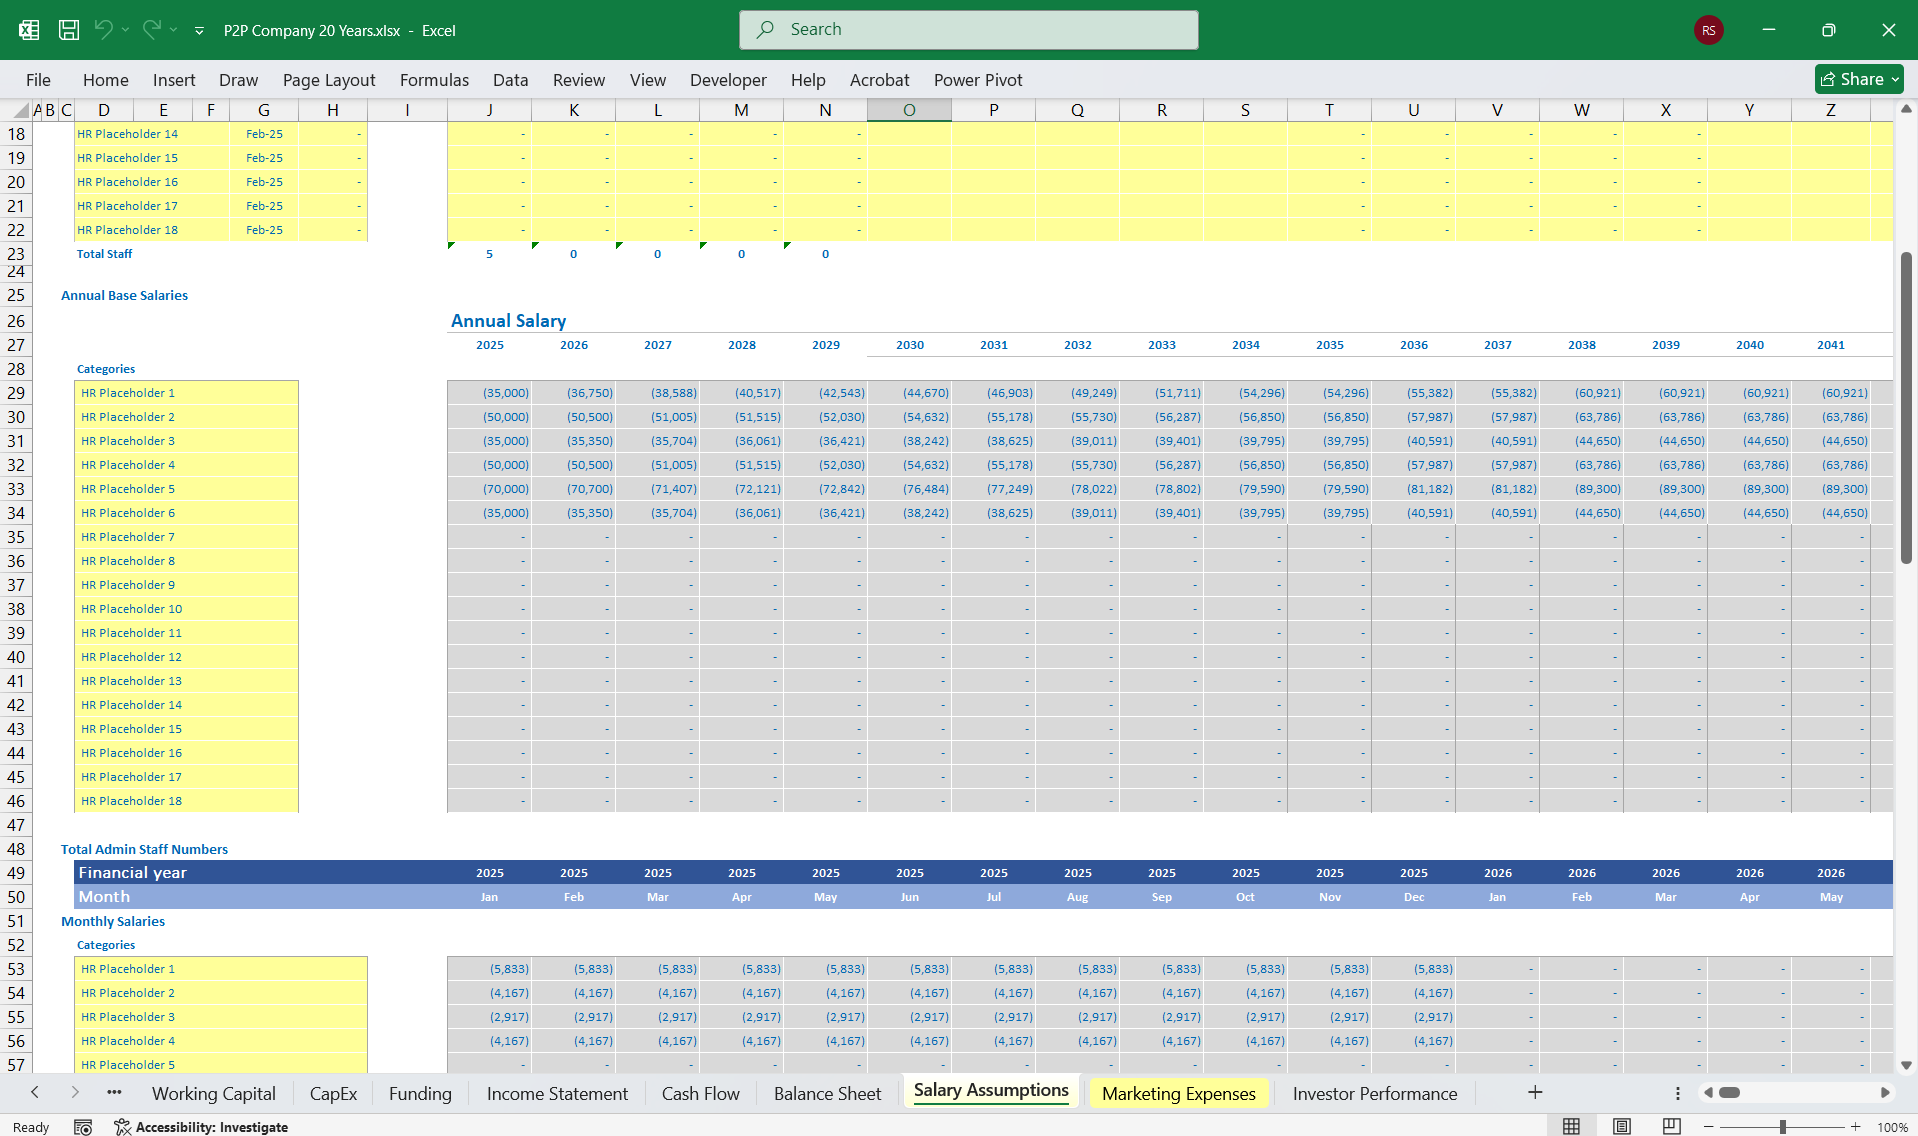
- Employee Salaries & Benefits – Operations, compliance, engineering, and finance teams.
- Regulatory & Compliance Costs – Legal fees, licenses, and audits.
- Office & Administrative Costs – Rent, utilities, and general admin expenses.
- EBITDA = Revenue – (COGS + Operating Expenses)
- Includes amortization of software development costs and depreciation of office assets.
- EBIT = EBITDA – Depreciation & Amortization
- If the platform has borrowed funds or earns interest, it reflects here.
- Taxes depend on jurisdiction and applicable tax rates.
- Net Income = EBIT – Interest – Taxes
- Represents overall profitability for the period.
2. Cash Flow StatementTracks cash movements to assess liquidity and operational efficiency.
Operating Cash Flow
- Net Income Adjustments – Adding back non-cash expenses like depreciation and amortization.
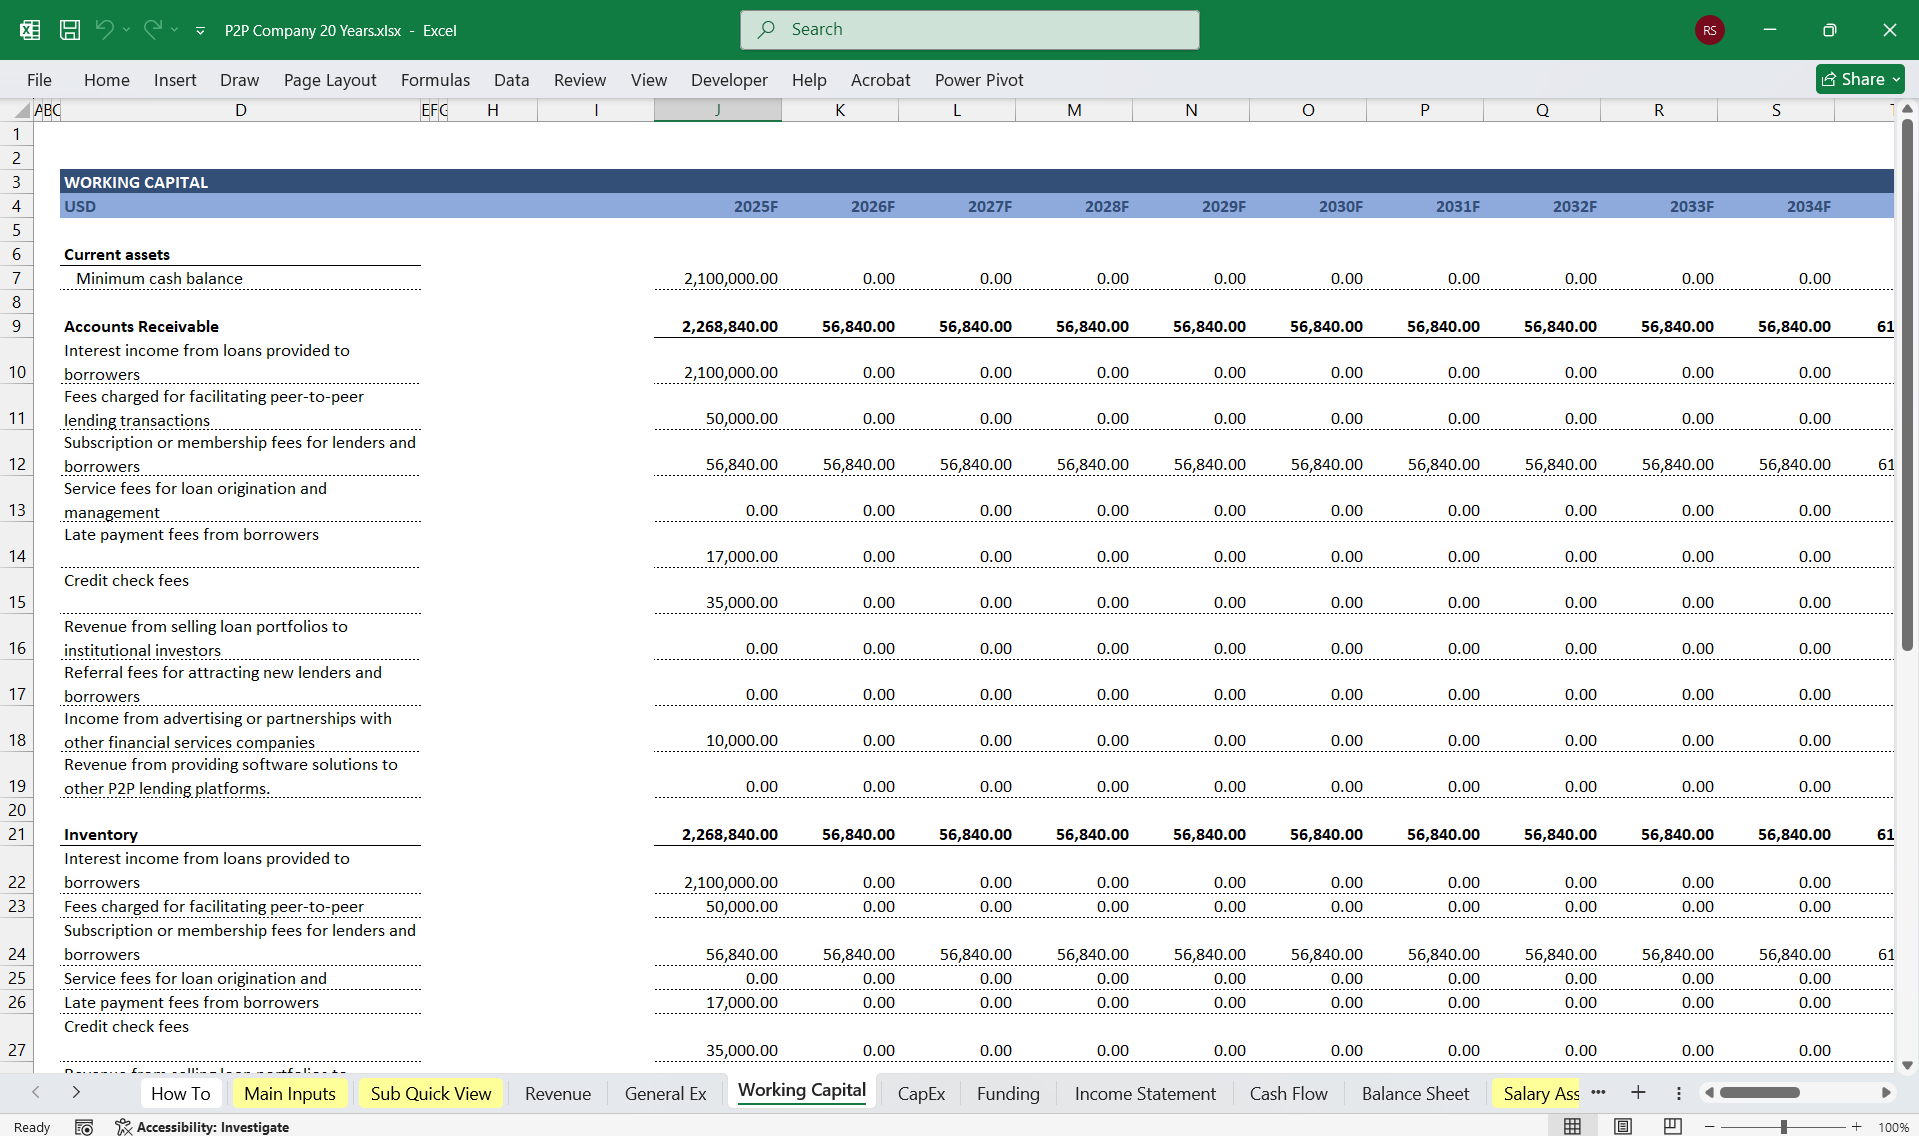
- Changes in Working Capital – Adjustments in receivables, payables, and accrued expenses.
- Loan Disbursements & Repayments – If the platform engages in direct lending, these appear here.
- Fees & Revenue Collections – Cash received from borrowers and lenders for platform services.
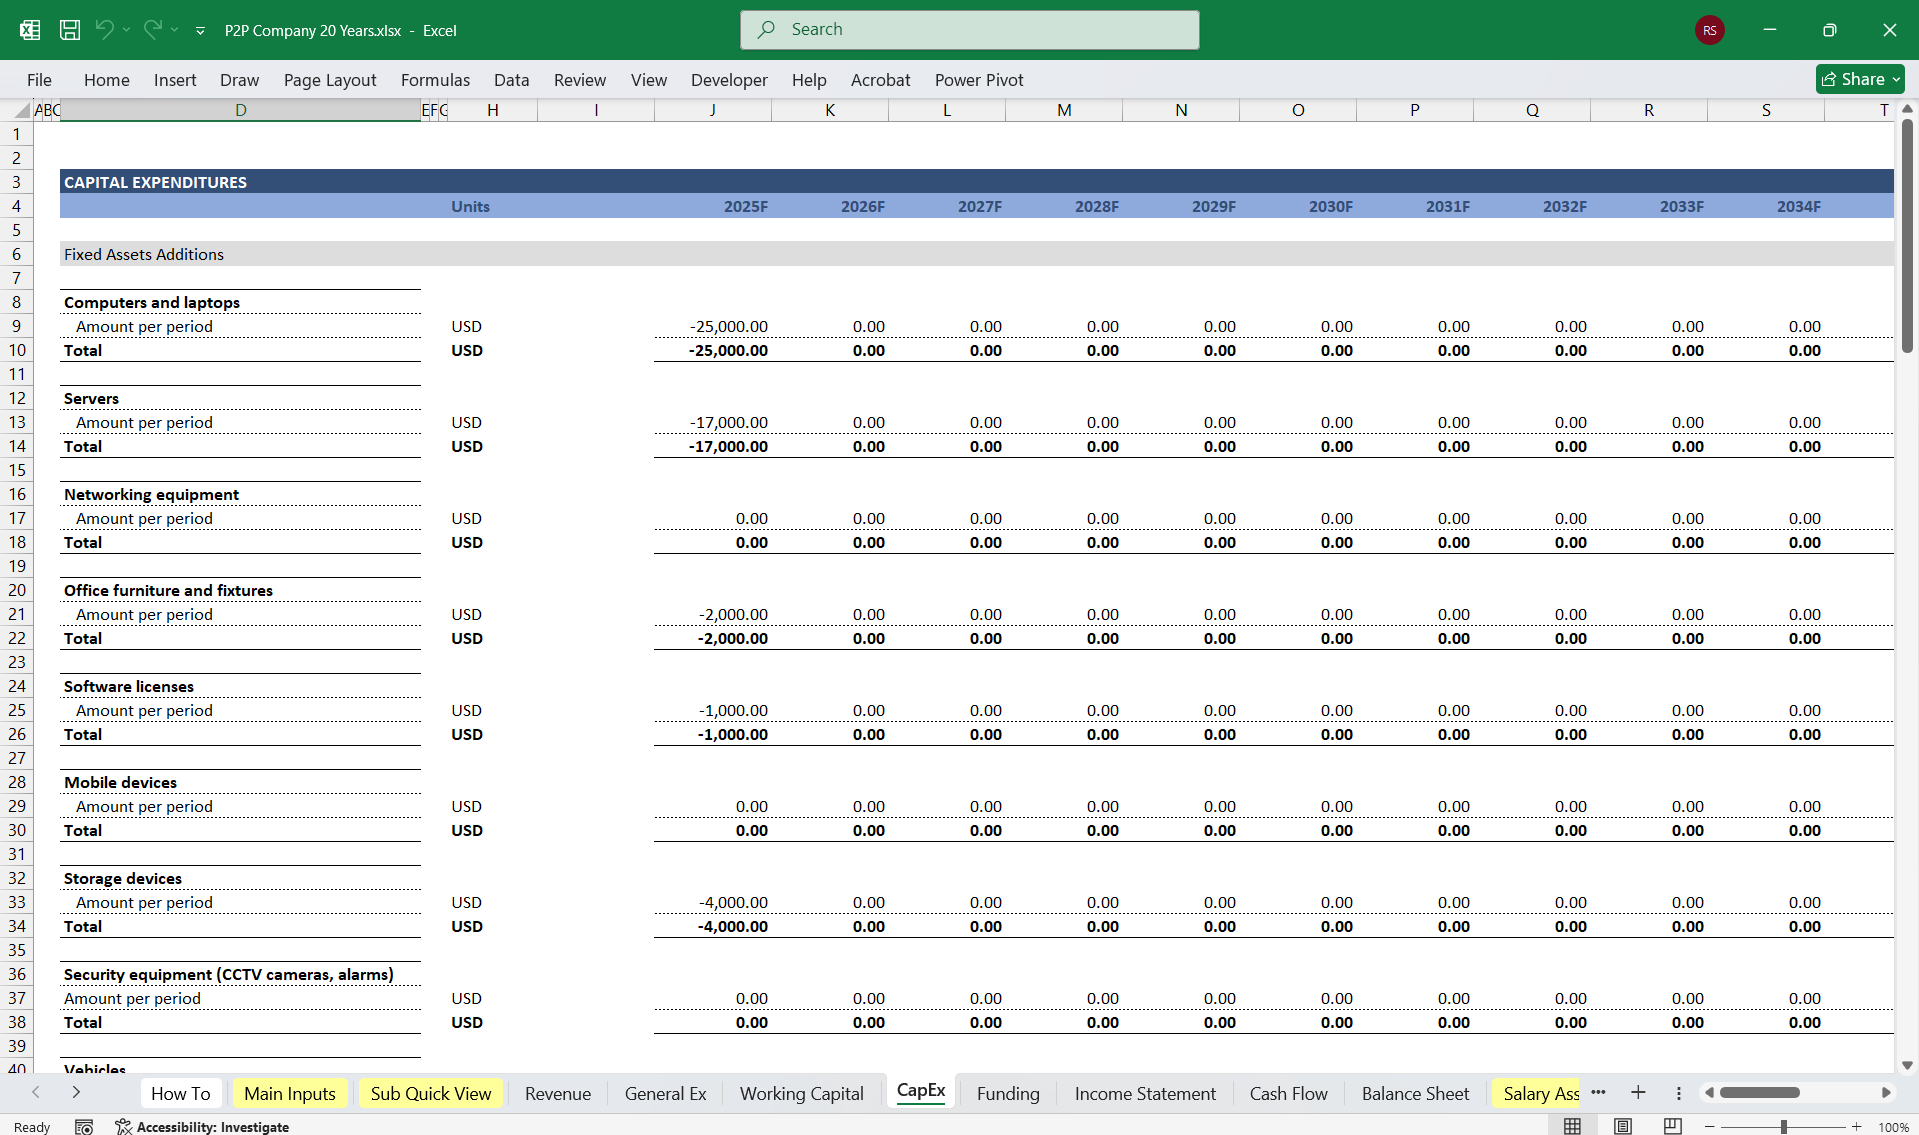
- Capital Expenditures (CapEx) – Spending on technology, office equipment, and software.
- Acquisitions & Investments – If the company invests in partnerships, R&D, or acquisitions.
- Equity Funding – Cash inflow from venture capital, private equity, or IPO.
- Debt Financing – Loans raised by the platform.
- Dividends & Buybacks – If the company distributes earnings to shareholders.
- Summarizes total cash inflows and outflows.
3. Balance SheetReflects the company’s financial position at a point in time.
AssetsCurrent Assets
- Cash & Equivalents – Cash reserves from operations and funding.
- Accounts Receivable – Outstanding fees due from lenders or borrowers.
- Loan Receivables – If the platform lends directly, outstanding loan balances.
- Technology & Software – Capitalized development costs.
- Office & Equipment – Hardware, office space, and infrastructure.
- Investments – Strategic investments in other companies or projects.
- Accounts Payable – Unpaid expenses and vendor obligations.
- Deferred Revenue – Fees collected for services not yet delivered.
- Borrowings (Short-Term) – Any short-term debt obligations.
- Long-Term Debt – Any loans or financing raised by the company.
- Investor Liabilities – If managing funds on behalf of lenders, recorded as liabilities.
- Common Stock & Retained Earnings – Represents ownership capital and cumulative profits.
- Additional Paid-in Capital – Funds raised above the par value of issued stock.
- Net Income from the Income Statement flows into Operating Cash Flow (Cash Flow Statement) and Retained Earnings (Balance Sheet).
- Depreciation & Amortization from the Income Statement is added back in the Cash Flow Statement but reduces the Asset Value (Balance Sheet) over time.
- Loan Disbursements & Repayments affect Cash Flow and are reflected as Loan Receivables or Liabilities in the Balance Sheet.
- Equity & Debt Financing in the Cash Flow Statement affects the Liabilities & Equity sections of the Balance Sheet.
ConclusionThis 3-statement financial model for a P2P lending platform provides insights into revenue generation, cost management, cash flows, and financial health. Key considerations include:
- Scalability of fee-based revenue models
- Credit risk exposure if lending directly
- Regulatory compliance costs
- Customer acquisition efficiency (CAC vs. LTV)
This Best Practice includes
1 Excel Financial Model
Further information
This financial model is adaptable, and its metrics should align with the strategic goals of your P2P Lending Platform, whether focused on scaling the user base, maximizing profitability, or securing investment.
