HSE Dashboard
Originally published: 14/12/2020 22:06
Publication number: ELQ-32859-1
View all versions & Certificate
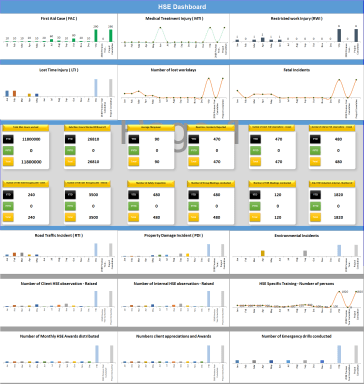
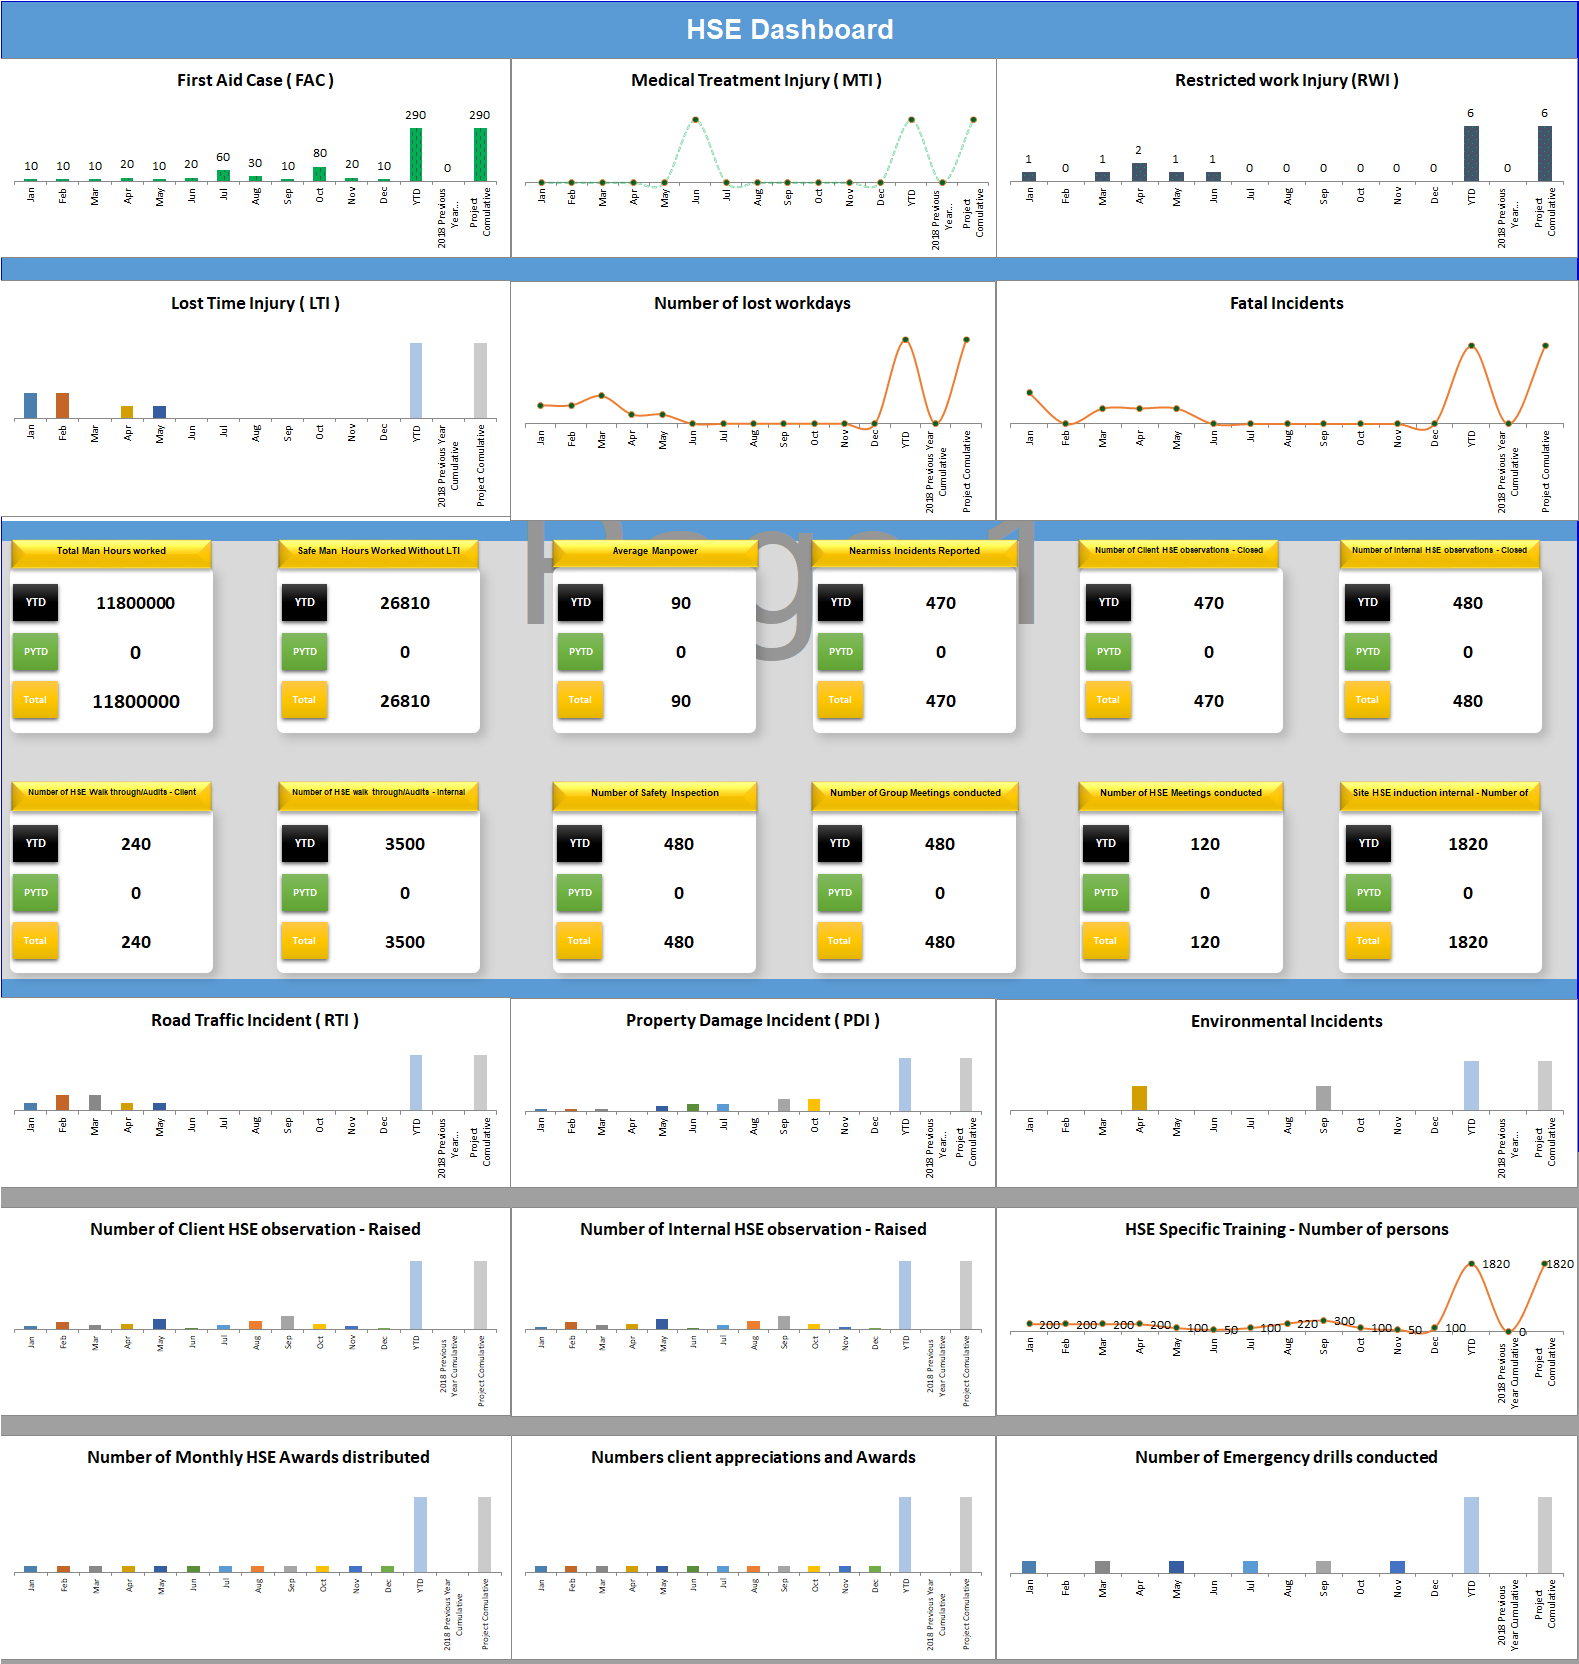
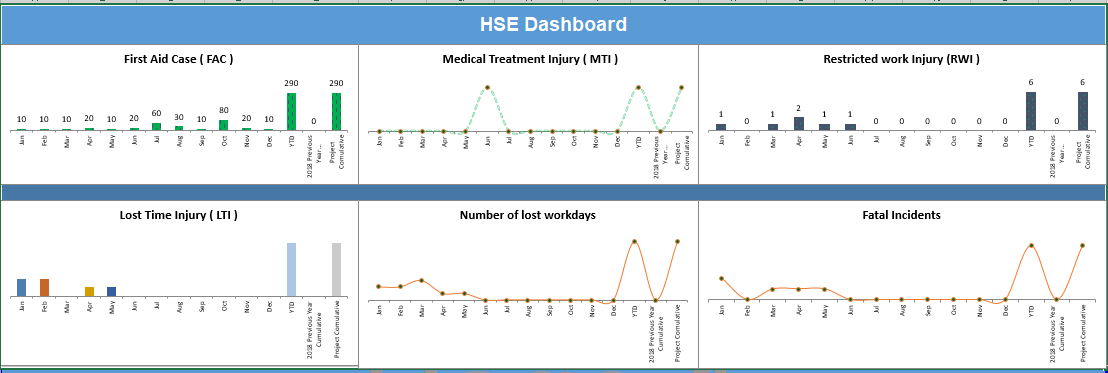
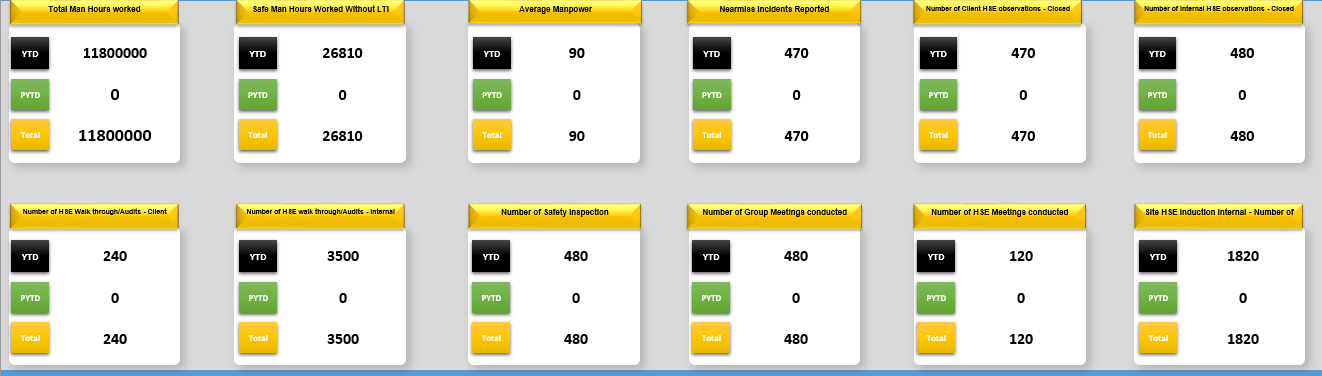
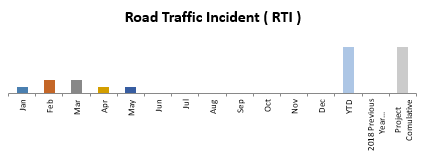
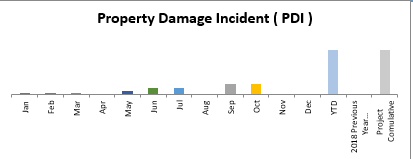
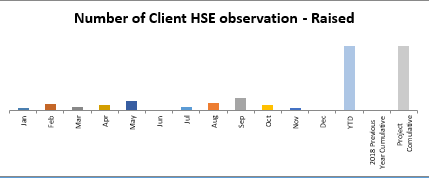
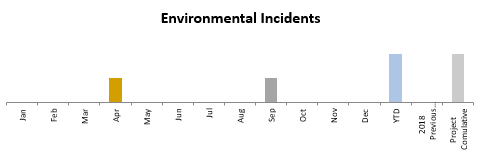
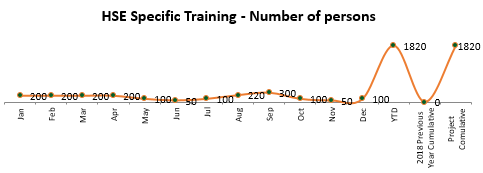
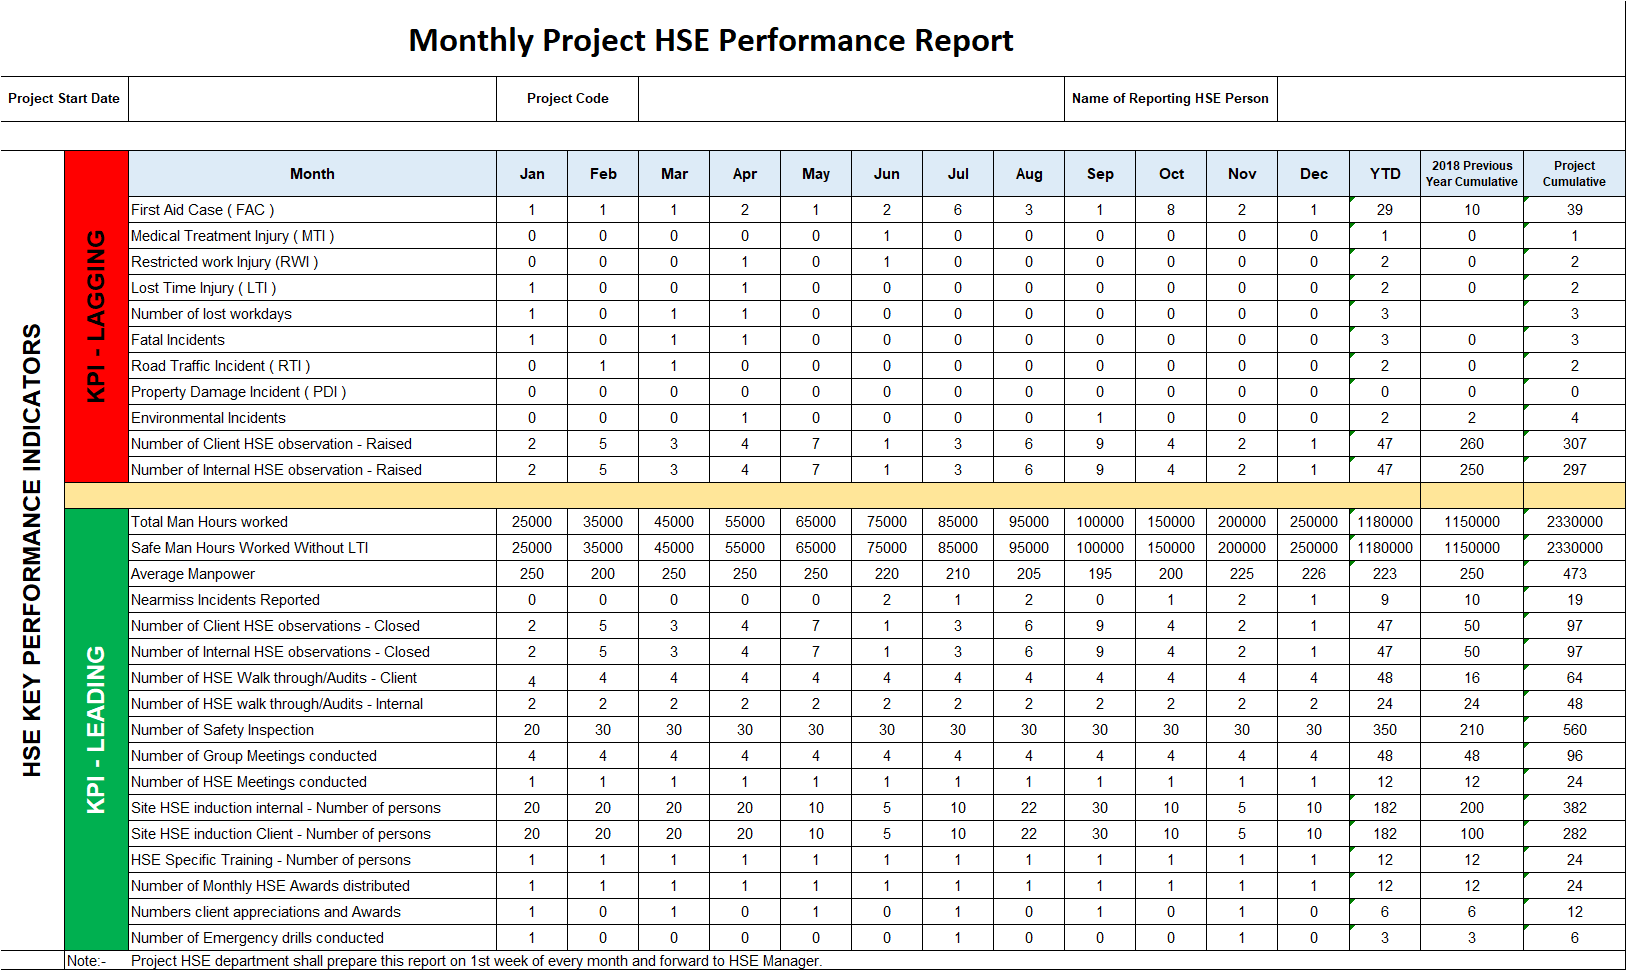
certified

HSE Dashboard

Infographic dashboard template

Description
Give your QHSE data a unique look by using this infographic Dashboard. This dashboard is fully editable and easy to use with simple data entry it will create amazing infographic dashboard to impress your audience.
you can use it for variety of purposes and its fully customizable and editable. I have included 10 sites in it which will help you to cover 10 projects at a time on one dashboard. you can of course add more and remove sites as you want.

I have customized this dashboard for HSE and it covers below aspects

KPI - LAGGING
First Aid Case ( FAC )
Medical Treatment Injury ( MTI )
Restricted work Injury (RWI )
Lost Time Injury ( LTI )
Number of lost workdays
Fatal Incidents
Road Traffic Incident ( RTI )
Property Damage Incident ( PDI )
Environmental Incidents
Number of Client HSE observation - Raised
Number of Internal HSE observation - Raised

KPI - LEADING
Total Man Hours worked
Safe Man Hours Worked Without LTI
Average Manpower
Nearmiss Incidents Reported
Number of Client HSE observations - Closed
Number of Internal HSE observations - Closed
Number of HSE Walk through/Audits - Client
Number of HSE walk through/Audits - Internal
Number of Safety Inspection
Number of Group Meetings conducted
Number of HSE Meetings conducted
Site HSE induction internal - Number of persons
Site HSE induction Client - Number of persons
HSE Specific Training - Number of persons
Number of Monthly HSE Awards distributed
Numbers client appreciations and Awards


This Best Practice includes
1 Excel file

Acquire business license for $15.00

Add to cart

Add to bookmarks

Discuss

Further information

This dashboards provides an intuitive and accessible platform for data analysis.


0.0 / 5 (0 votes)

please wait...