
Originally published: 28/08/2025 07:36
Publication number: ELQ-61858-1
View all versions & Certificate
Publication number: ELQ-61858-1
View all versions & Certificate

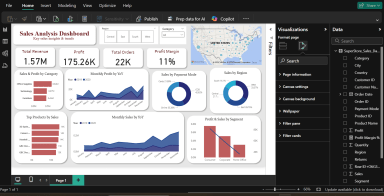
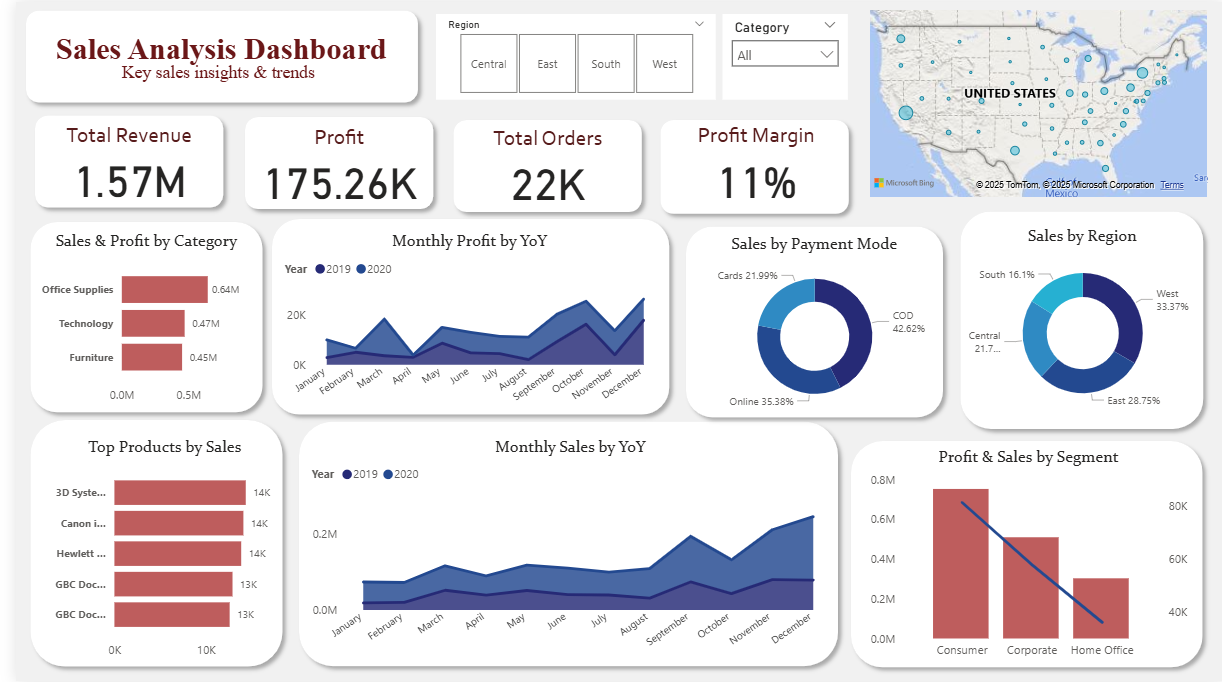
Interactive Sales Analysis Dashboard – Power BI Template
A ready-to-use Power BI dashboard to analyze sales performance, track profit, monitor revenue trends, and visualize key business metrics interactively.
Data Analyst | Excel, Power BI, Python, SQL Expert | Turning Data into Decisions | Business AnalystFollow
Further information
To help businesses and analysts monitor, analyze, and improve sales performance using a clean, interactive, and professional dashboard.
When teams are seeking to standardize their processes efficiently.
Ideal for projects with clearly defined goals and measurable outcomes.
Works best in environments with consistent workflows and moderate complexity.
Less effective in rapidly changing or highly uncertain environments.
May not fit well where resources (time, tools, or expertise) are severely limited.
