
Publication number: ELQ-29080-1
View all versions & Certificate

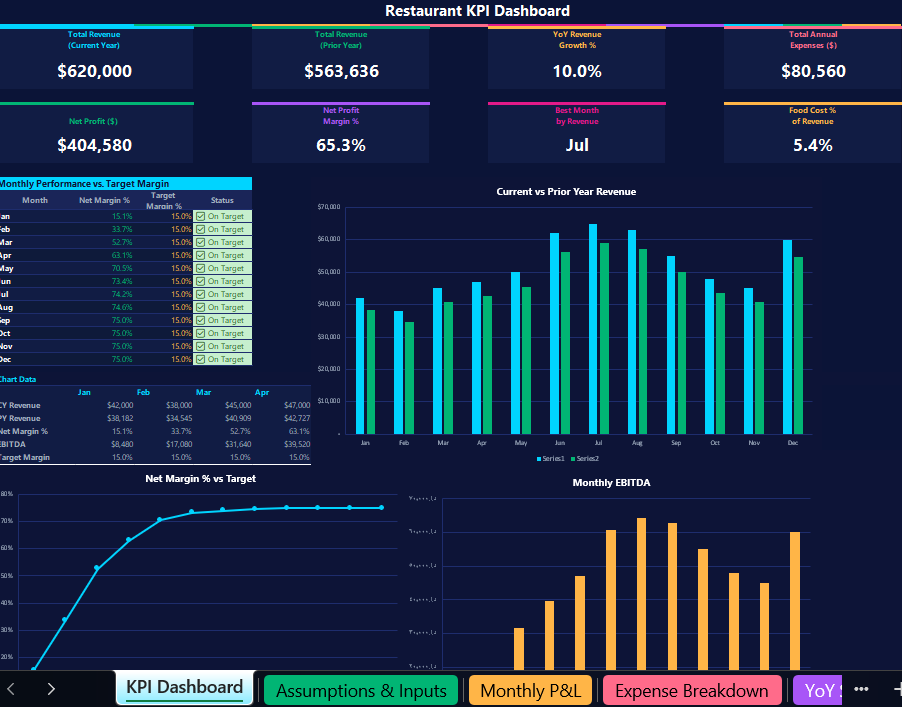
Restaurant KPI Dashboard: Track Revenue, Margins & Performance in Excel
A ready-to-use Excel dashboard to monitor your restaurant's financial health at a glance.
Further information
Enable restaurant owners to monitor monthly revenue, costs, and profitability in a single structured workbook
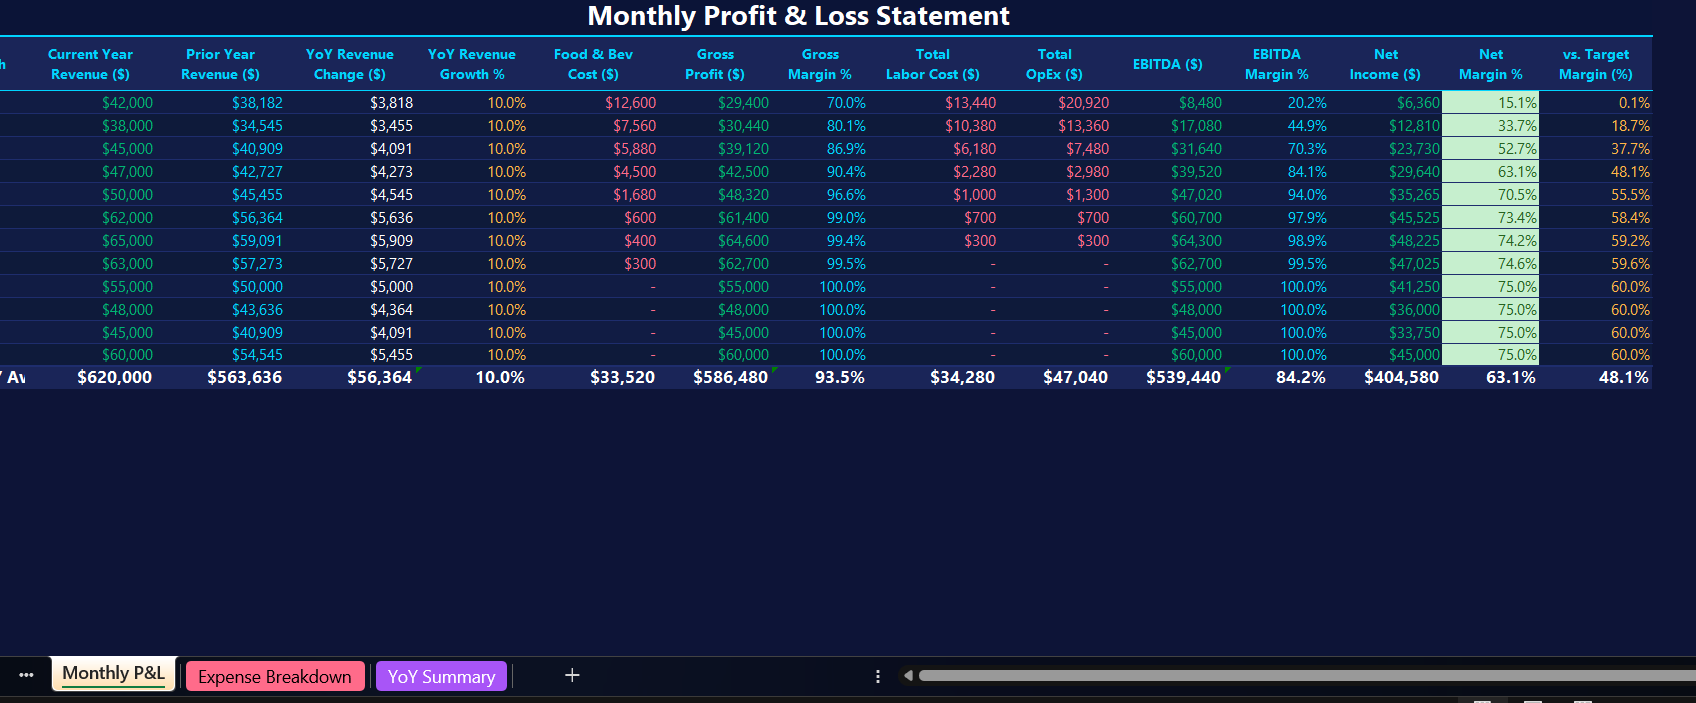
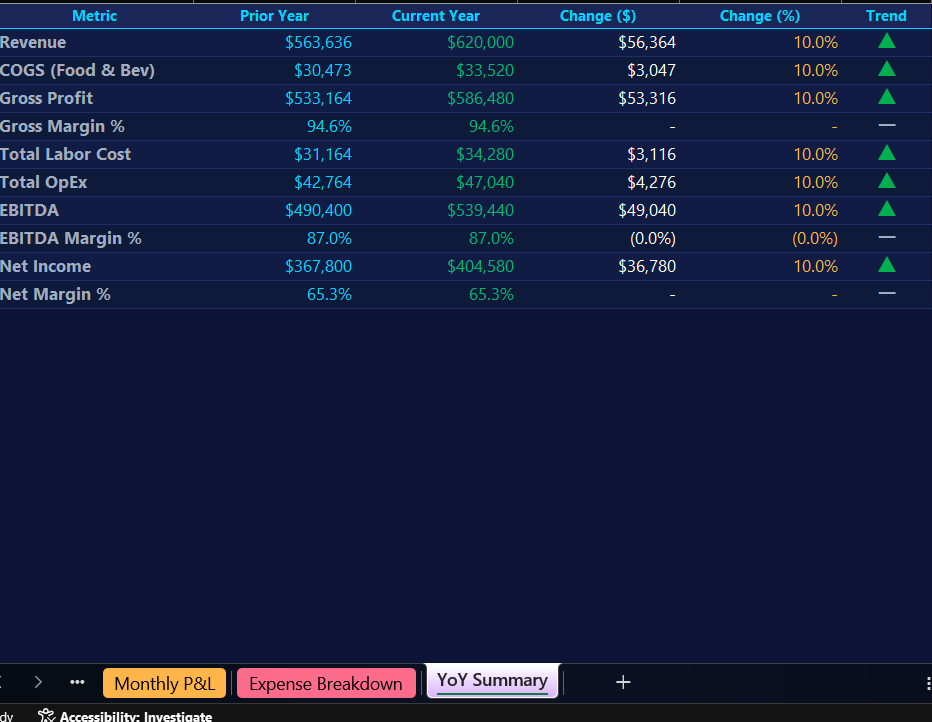
Provide instant visibility into gross margin, EBITDA, and net profit margin against a defined target
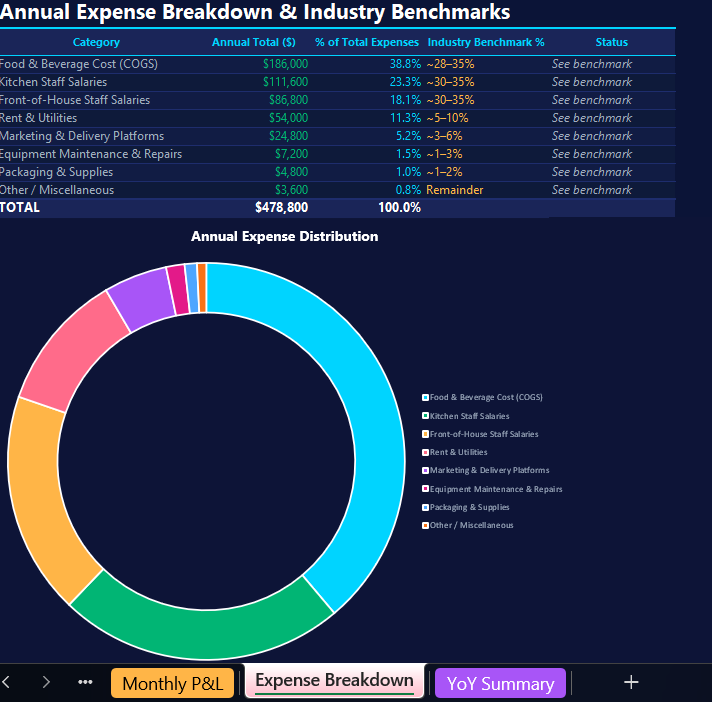
Benchmark actual expense categories against hospitality industry standards
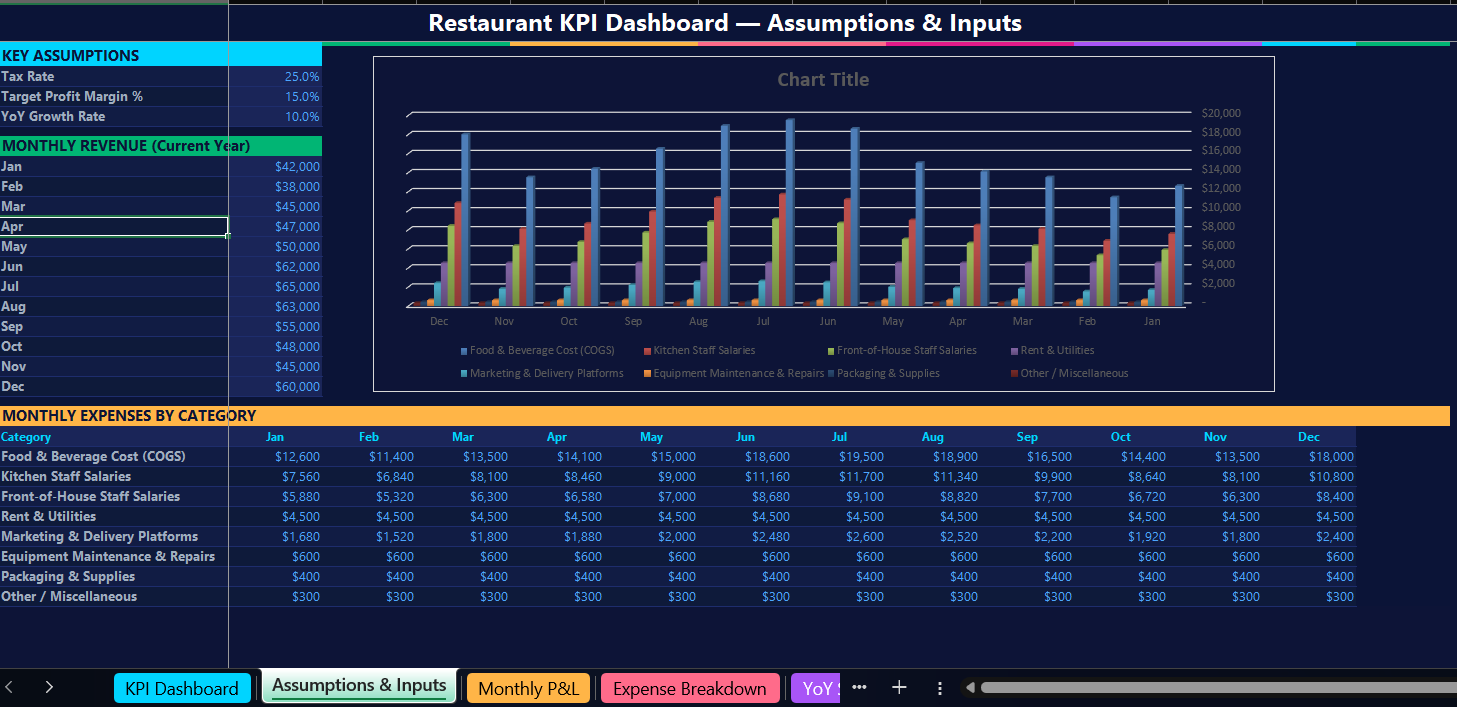
Automate year-over-year revenue and profit comparisons using a single growth rate assumption
Eliminate manual calculations and reduce the risk of financial reporting errors
Support data-driven decisions around staffing, food costs, marketing spend, and pricing
Independent restaurants, cafés, or casual dining operations with monthly revenue between $20,000 and $200,000
Businesses tracking performance across a full 12-month fiscal year
Owners or managers who maintain basic monthly records of revenue and expense categories
Operations seeking to prepare financial summaries for investors, lenders, or internal review
Teams using Microsoft Excel 2016 or later (or compatible spreadsheet software)
Large restaurant groups or franchises requiring multi-location consolidated reporting
Operations requiring real-time POS system integration or automated data feeds
Businesses with highly complex cost structures requiring project-level or per-dish profitability tracking
Users requiring GAAP-compliant or audit-ready financial statements
Teams exclusively using Google Sheets (minor formula compatibility adjustments may be required)
