Last version published: 15/04/2026 11:54
Publication number: ELQ-30062-2
View all versions & Certificate

Board-Level Project Dashboard for Complete Control & Visibility
Board-level project dashboard for KPI tracking and governance reporting
 by Abdul Ghafur BE MD CCM PMP PBA
Project Management Professional | Board-Level Dashboard Expert Project Dashboard ExpertFollow
Further information
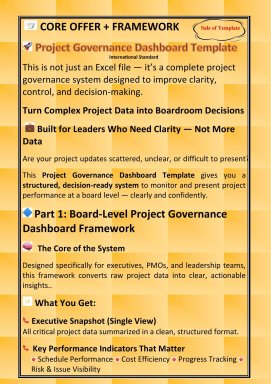
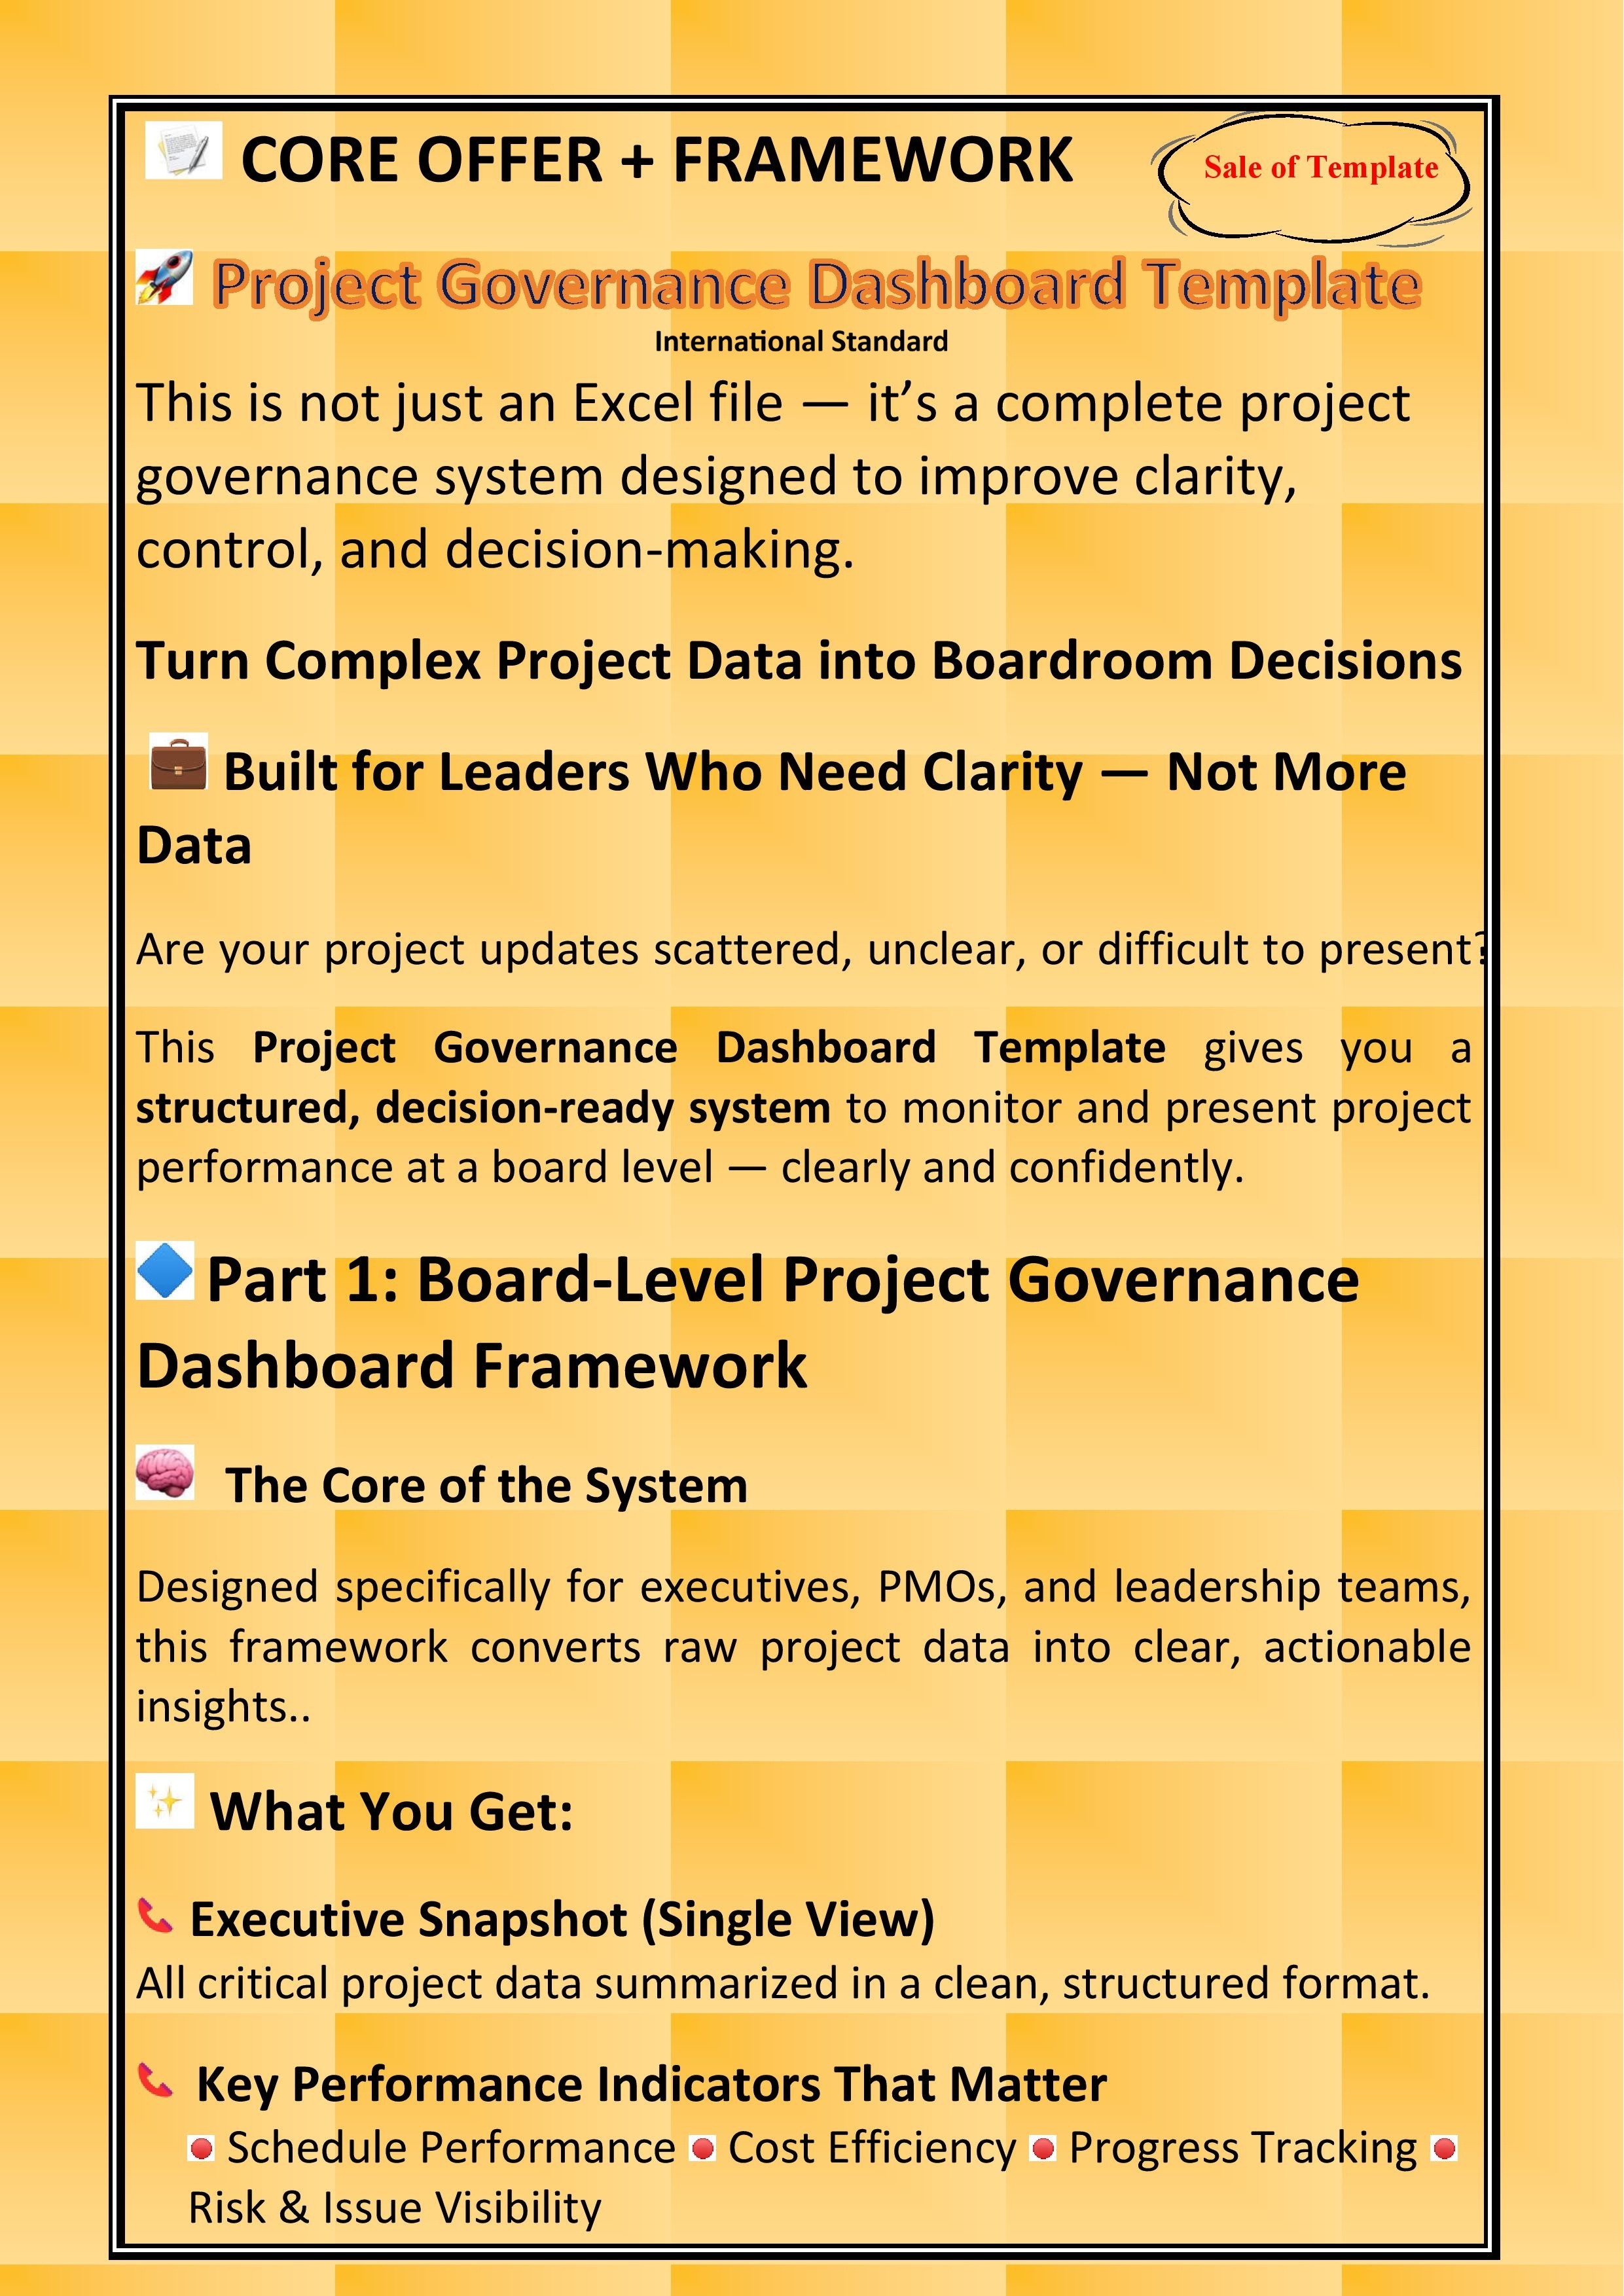
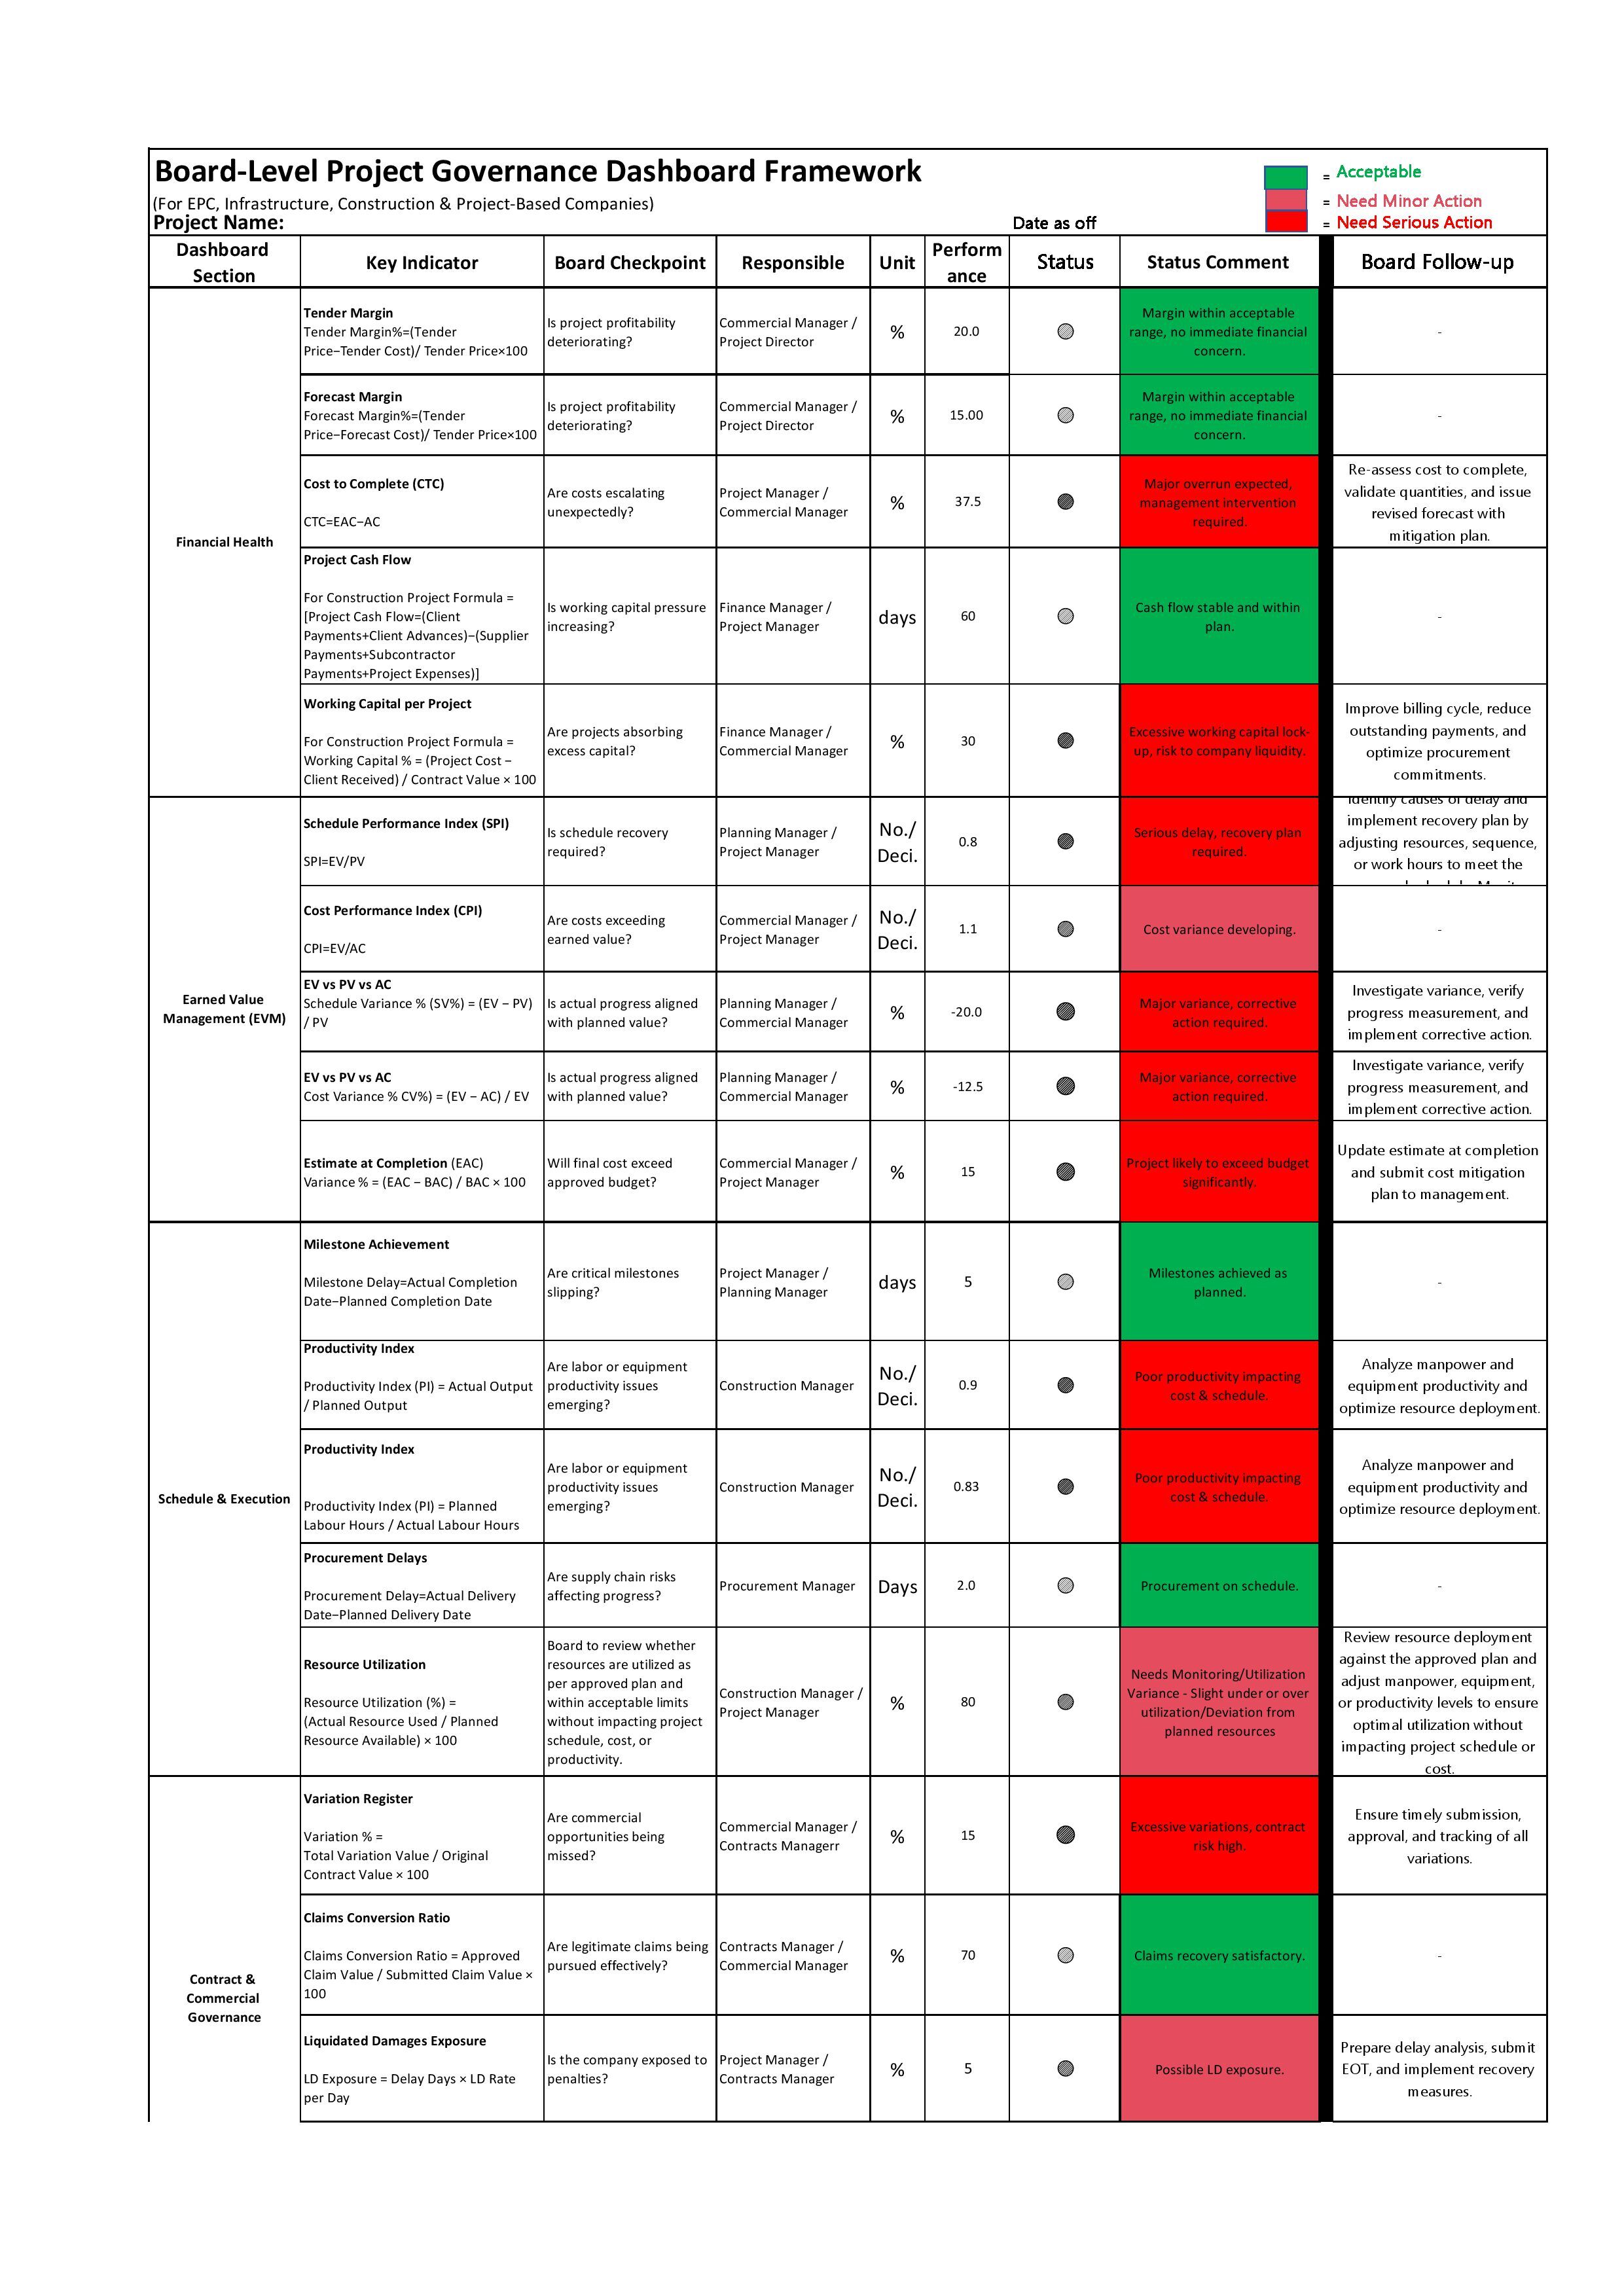
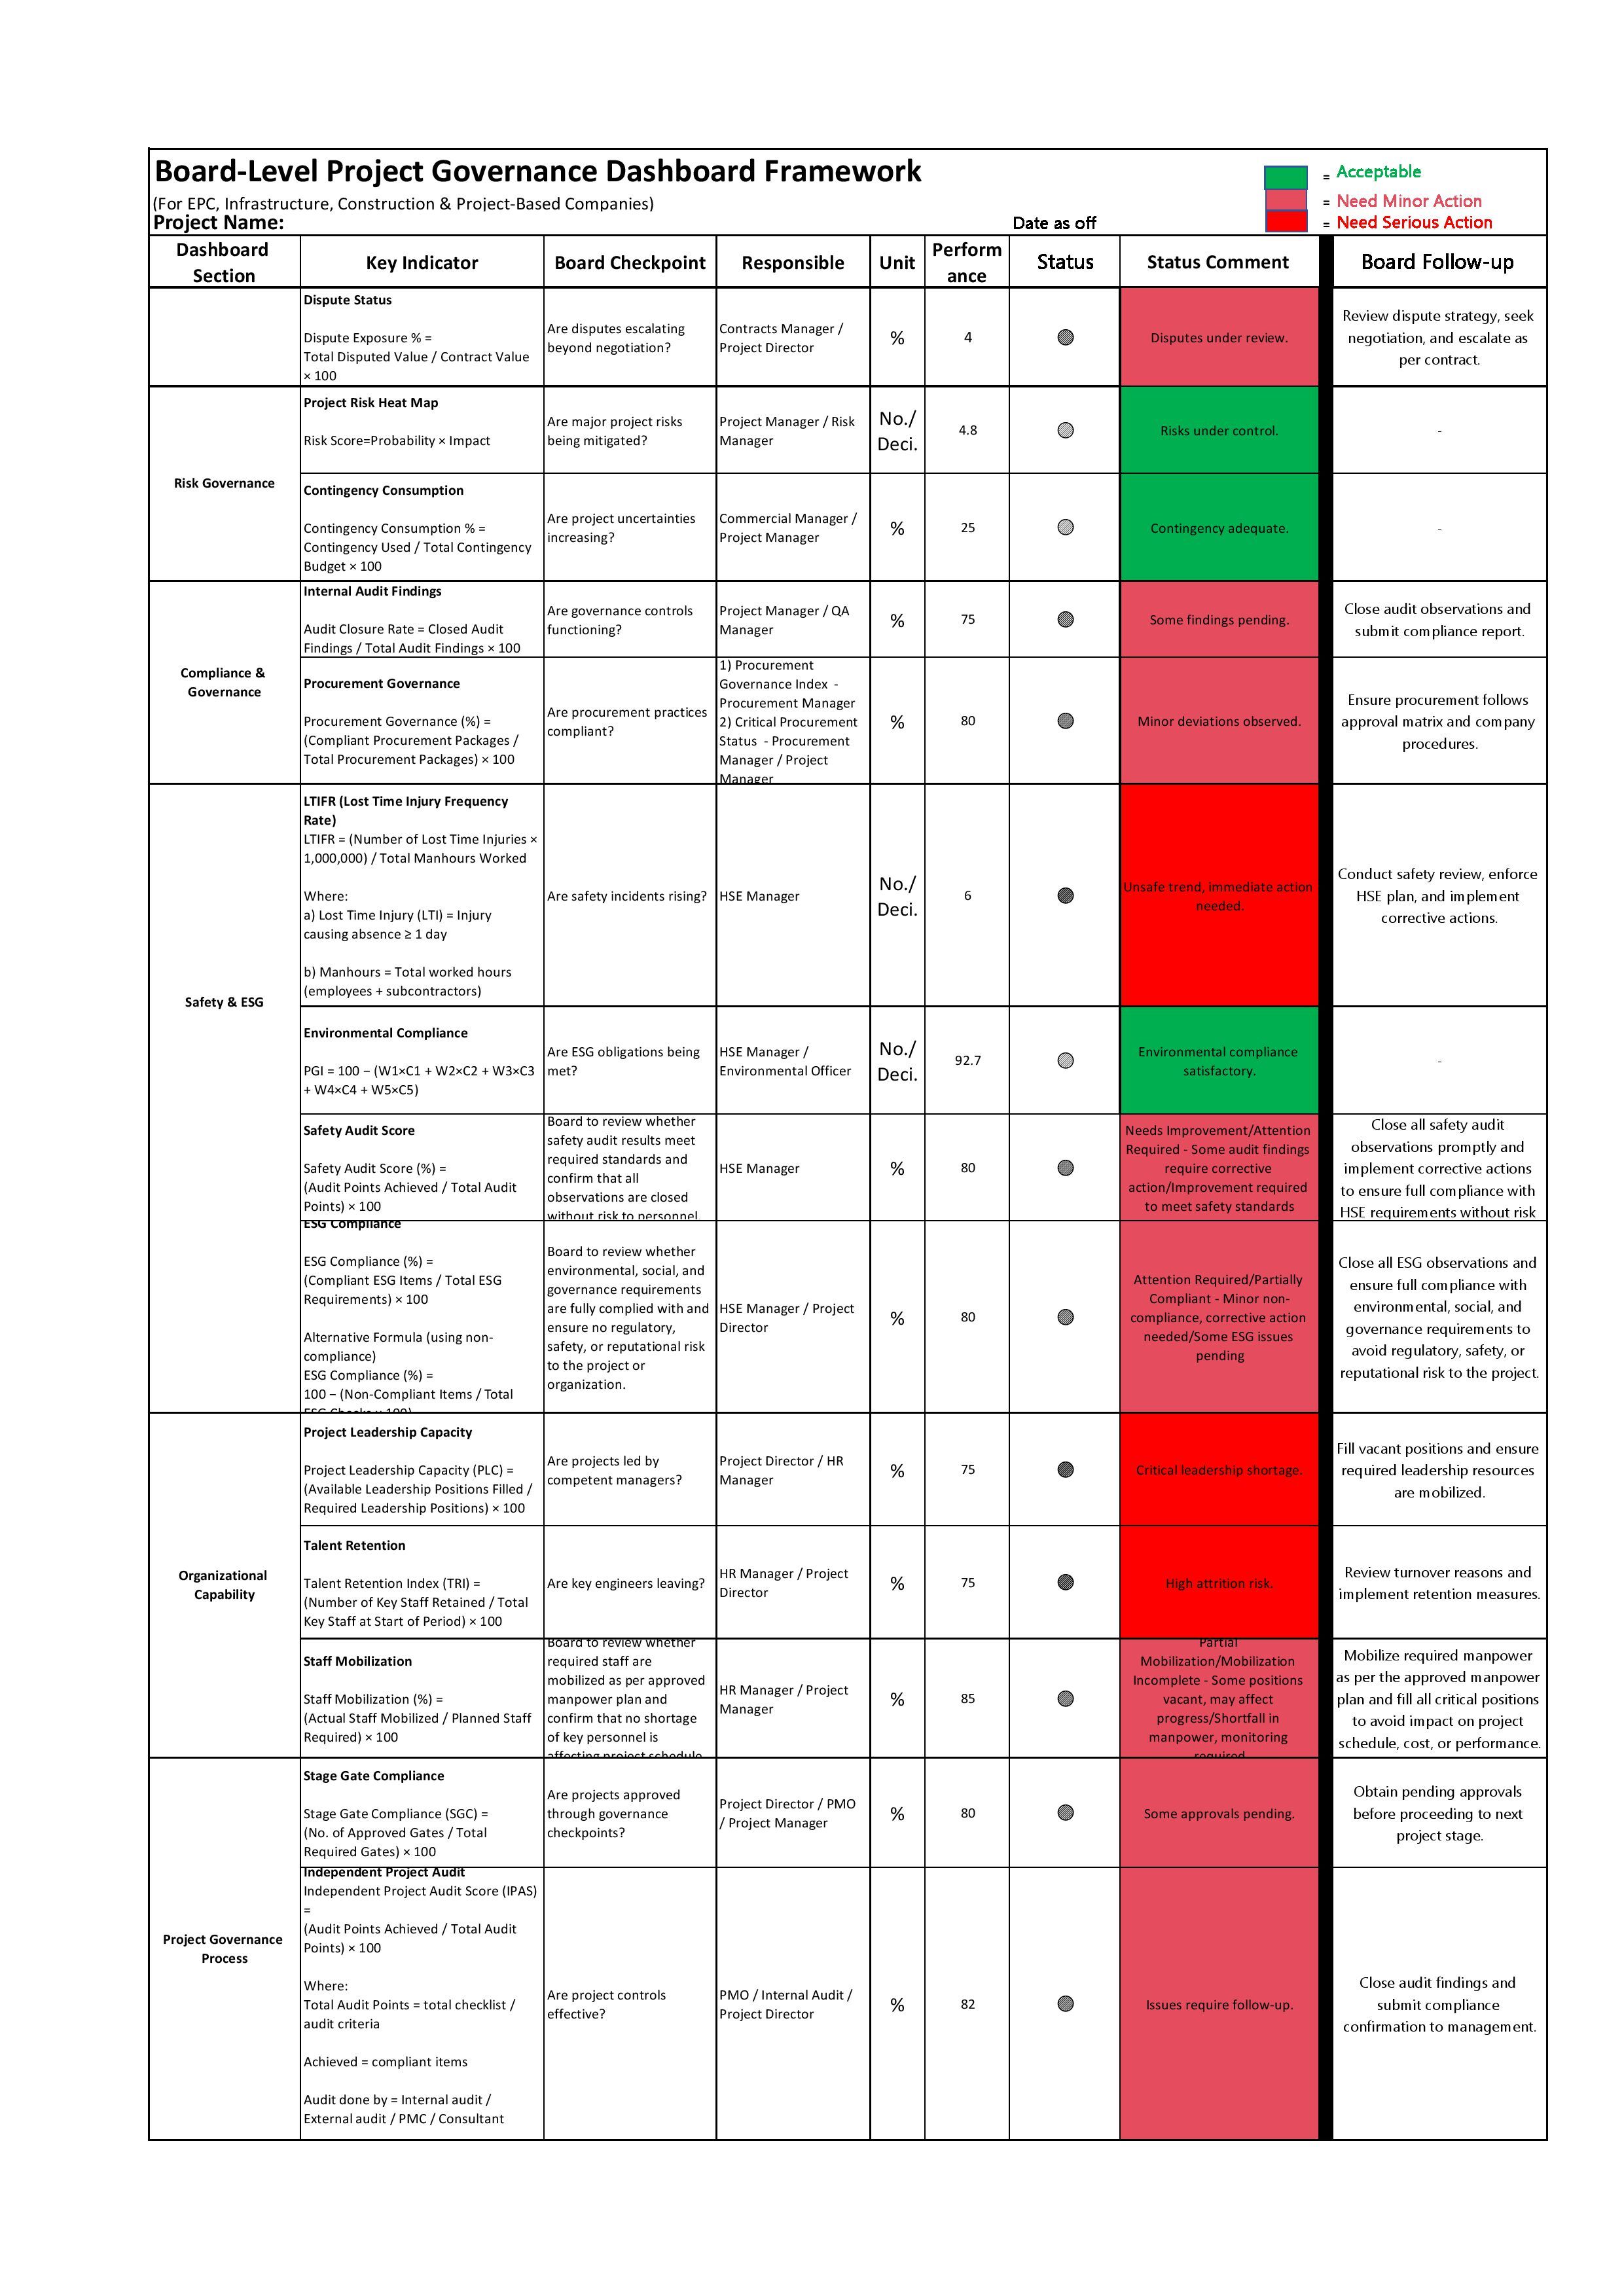
Provide a board-level view of project performance in a single dashboard
Enable quick and informed decision-making using real-time insights
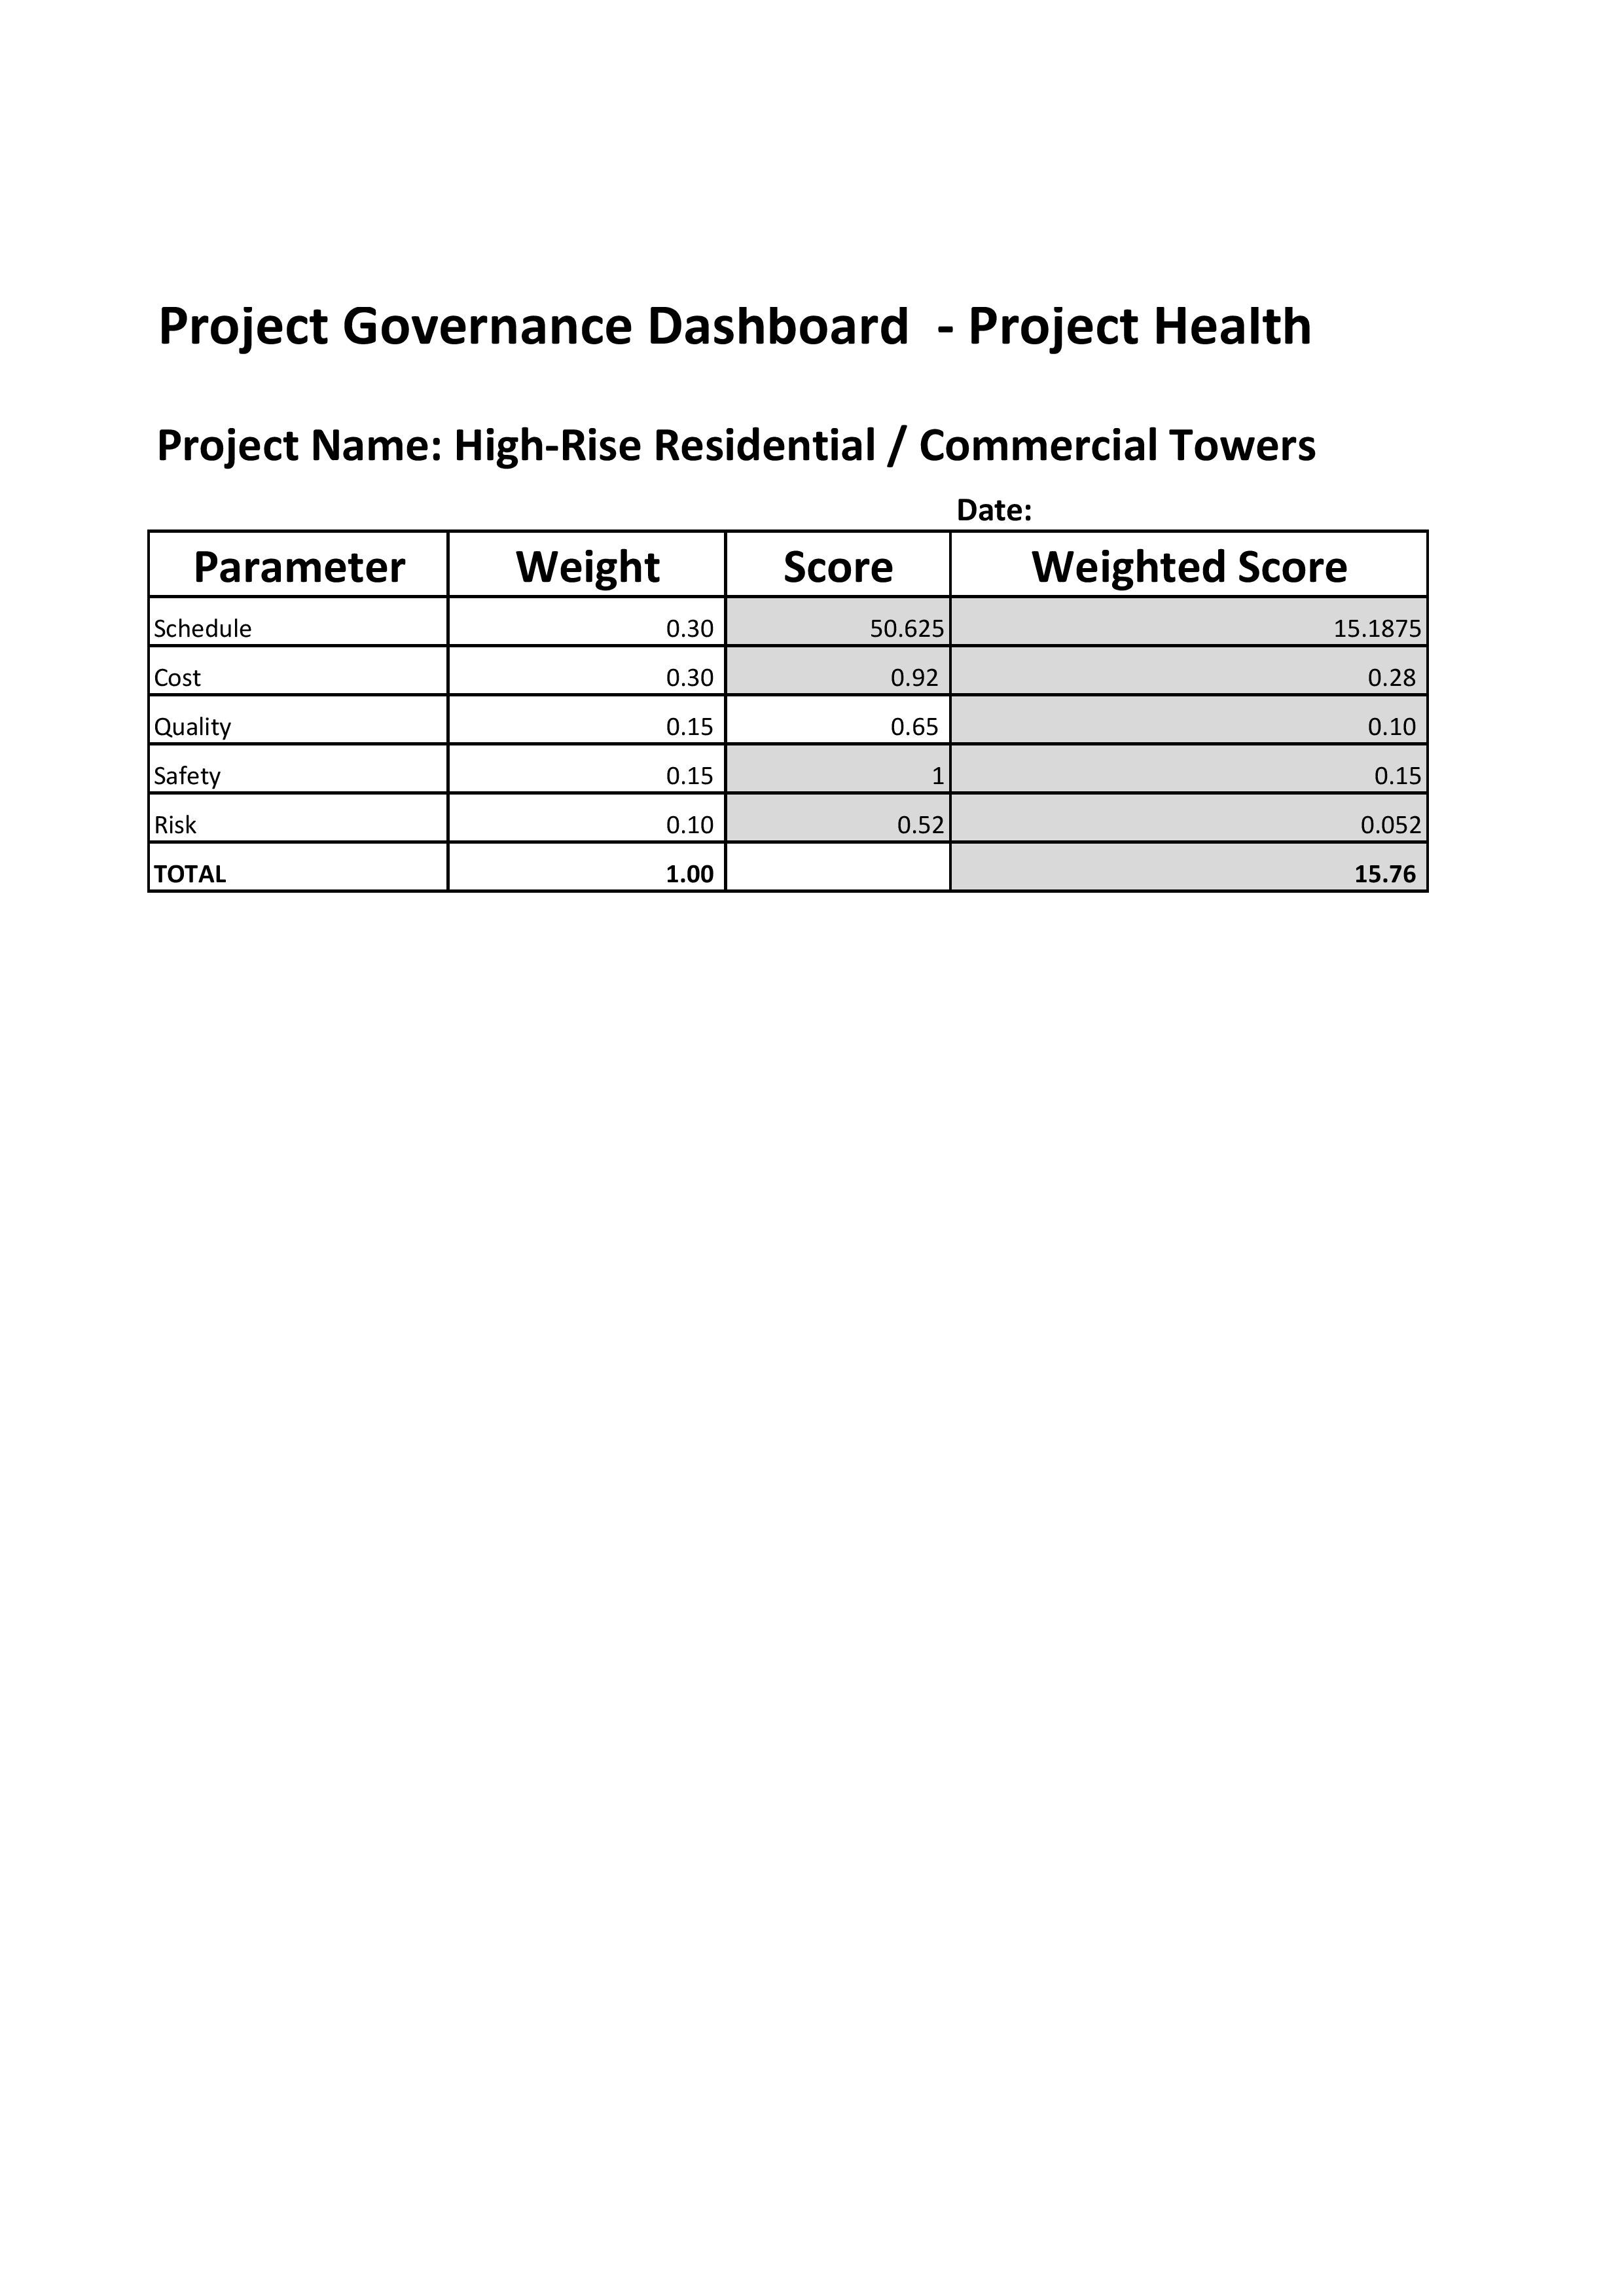
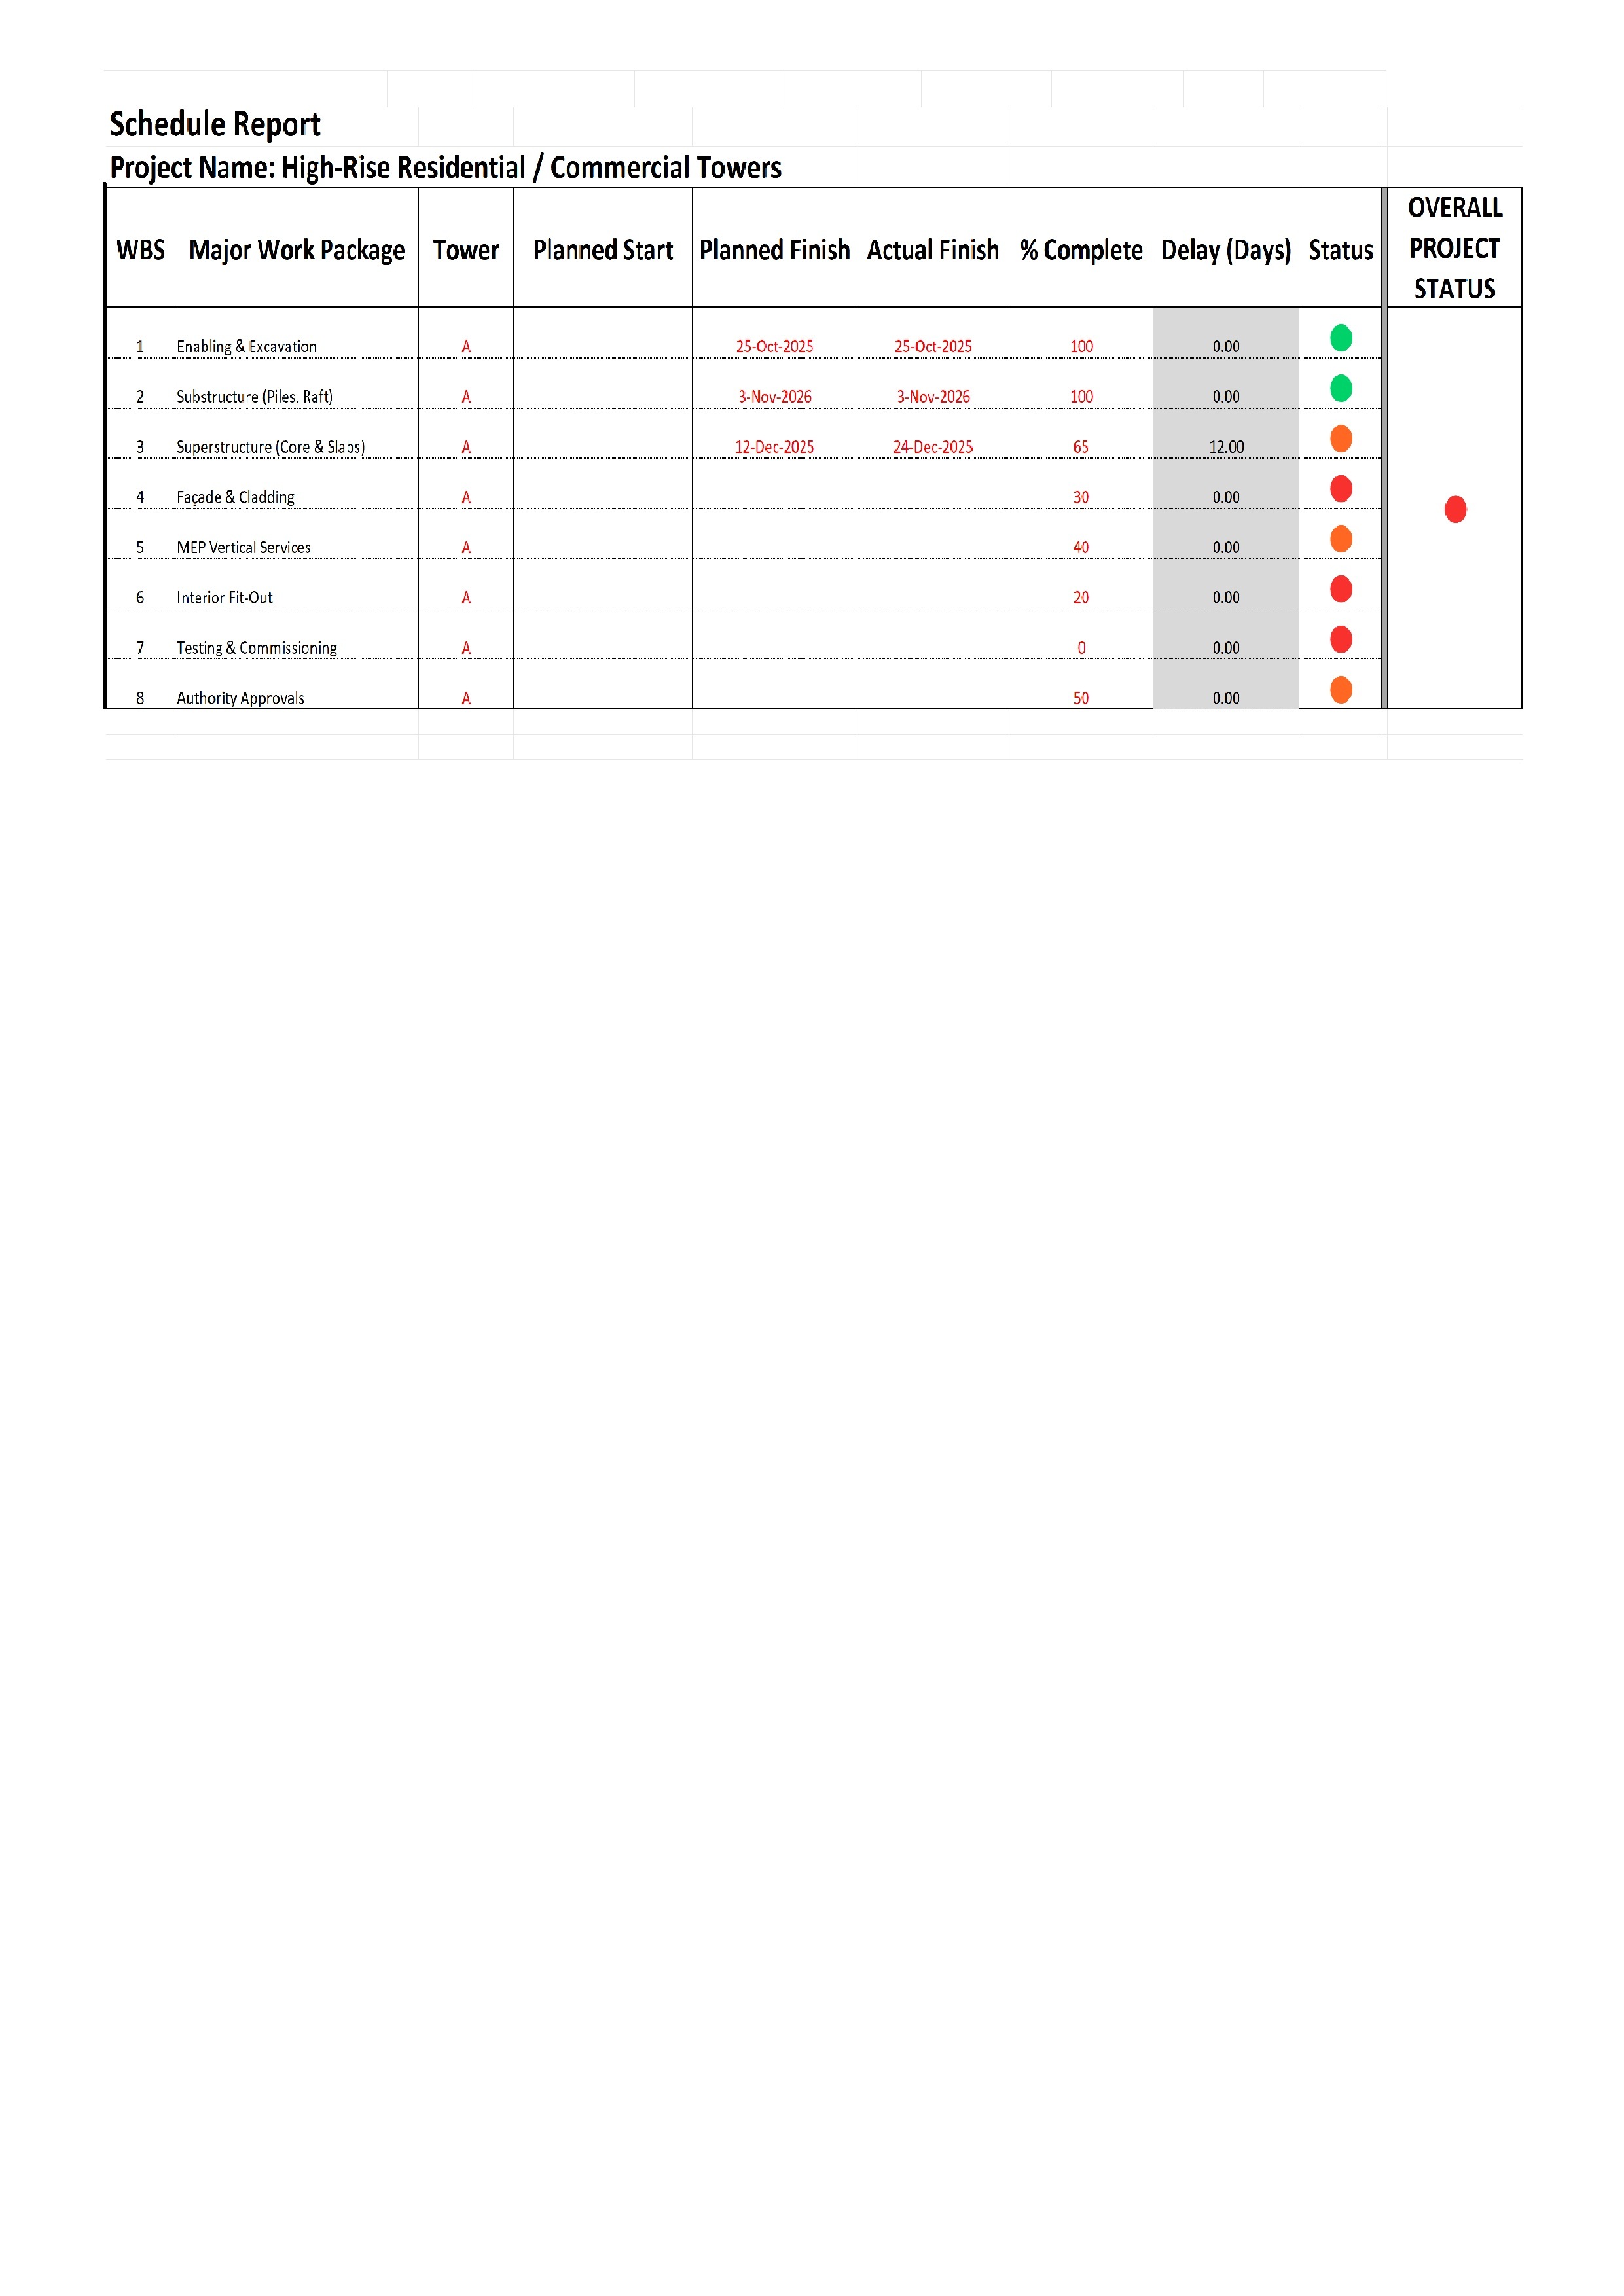
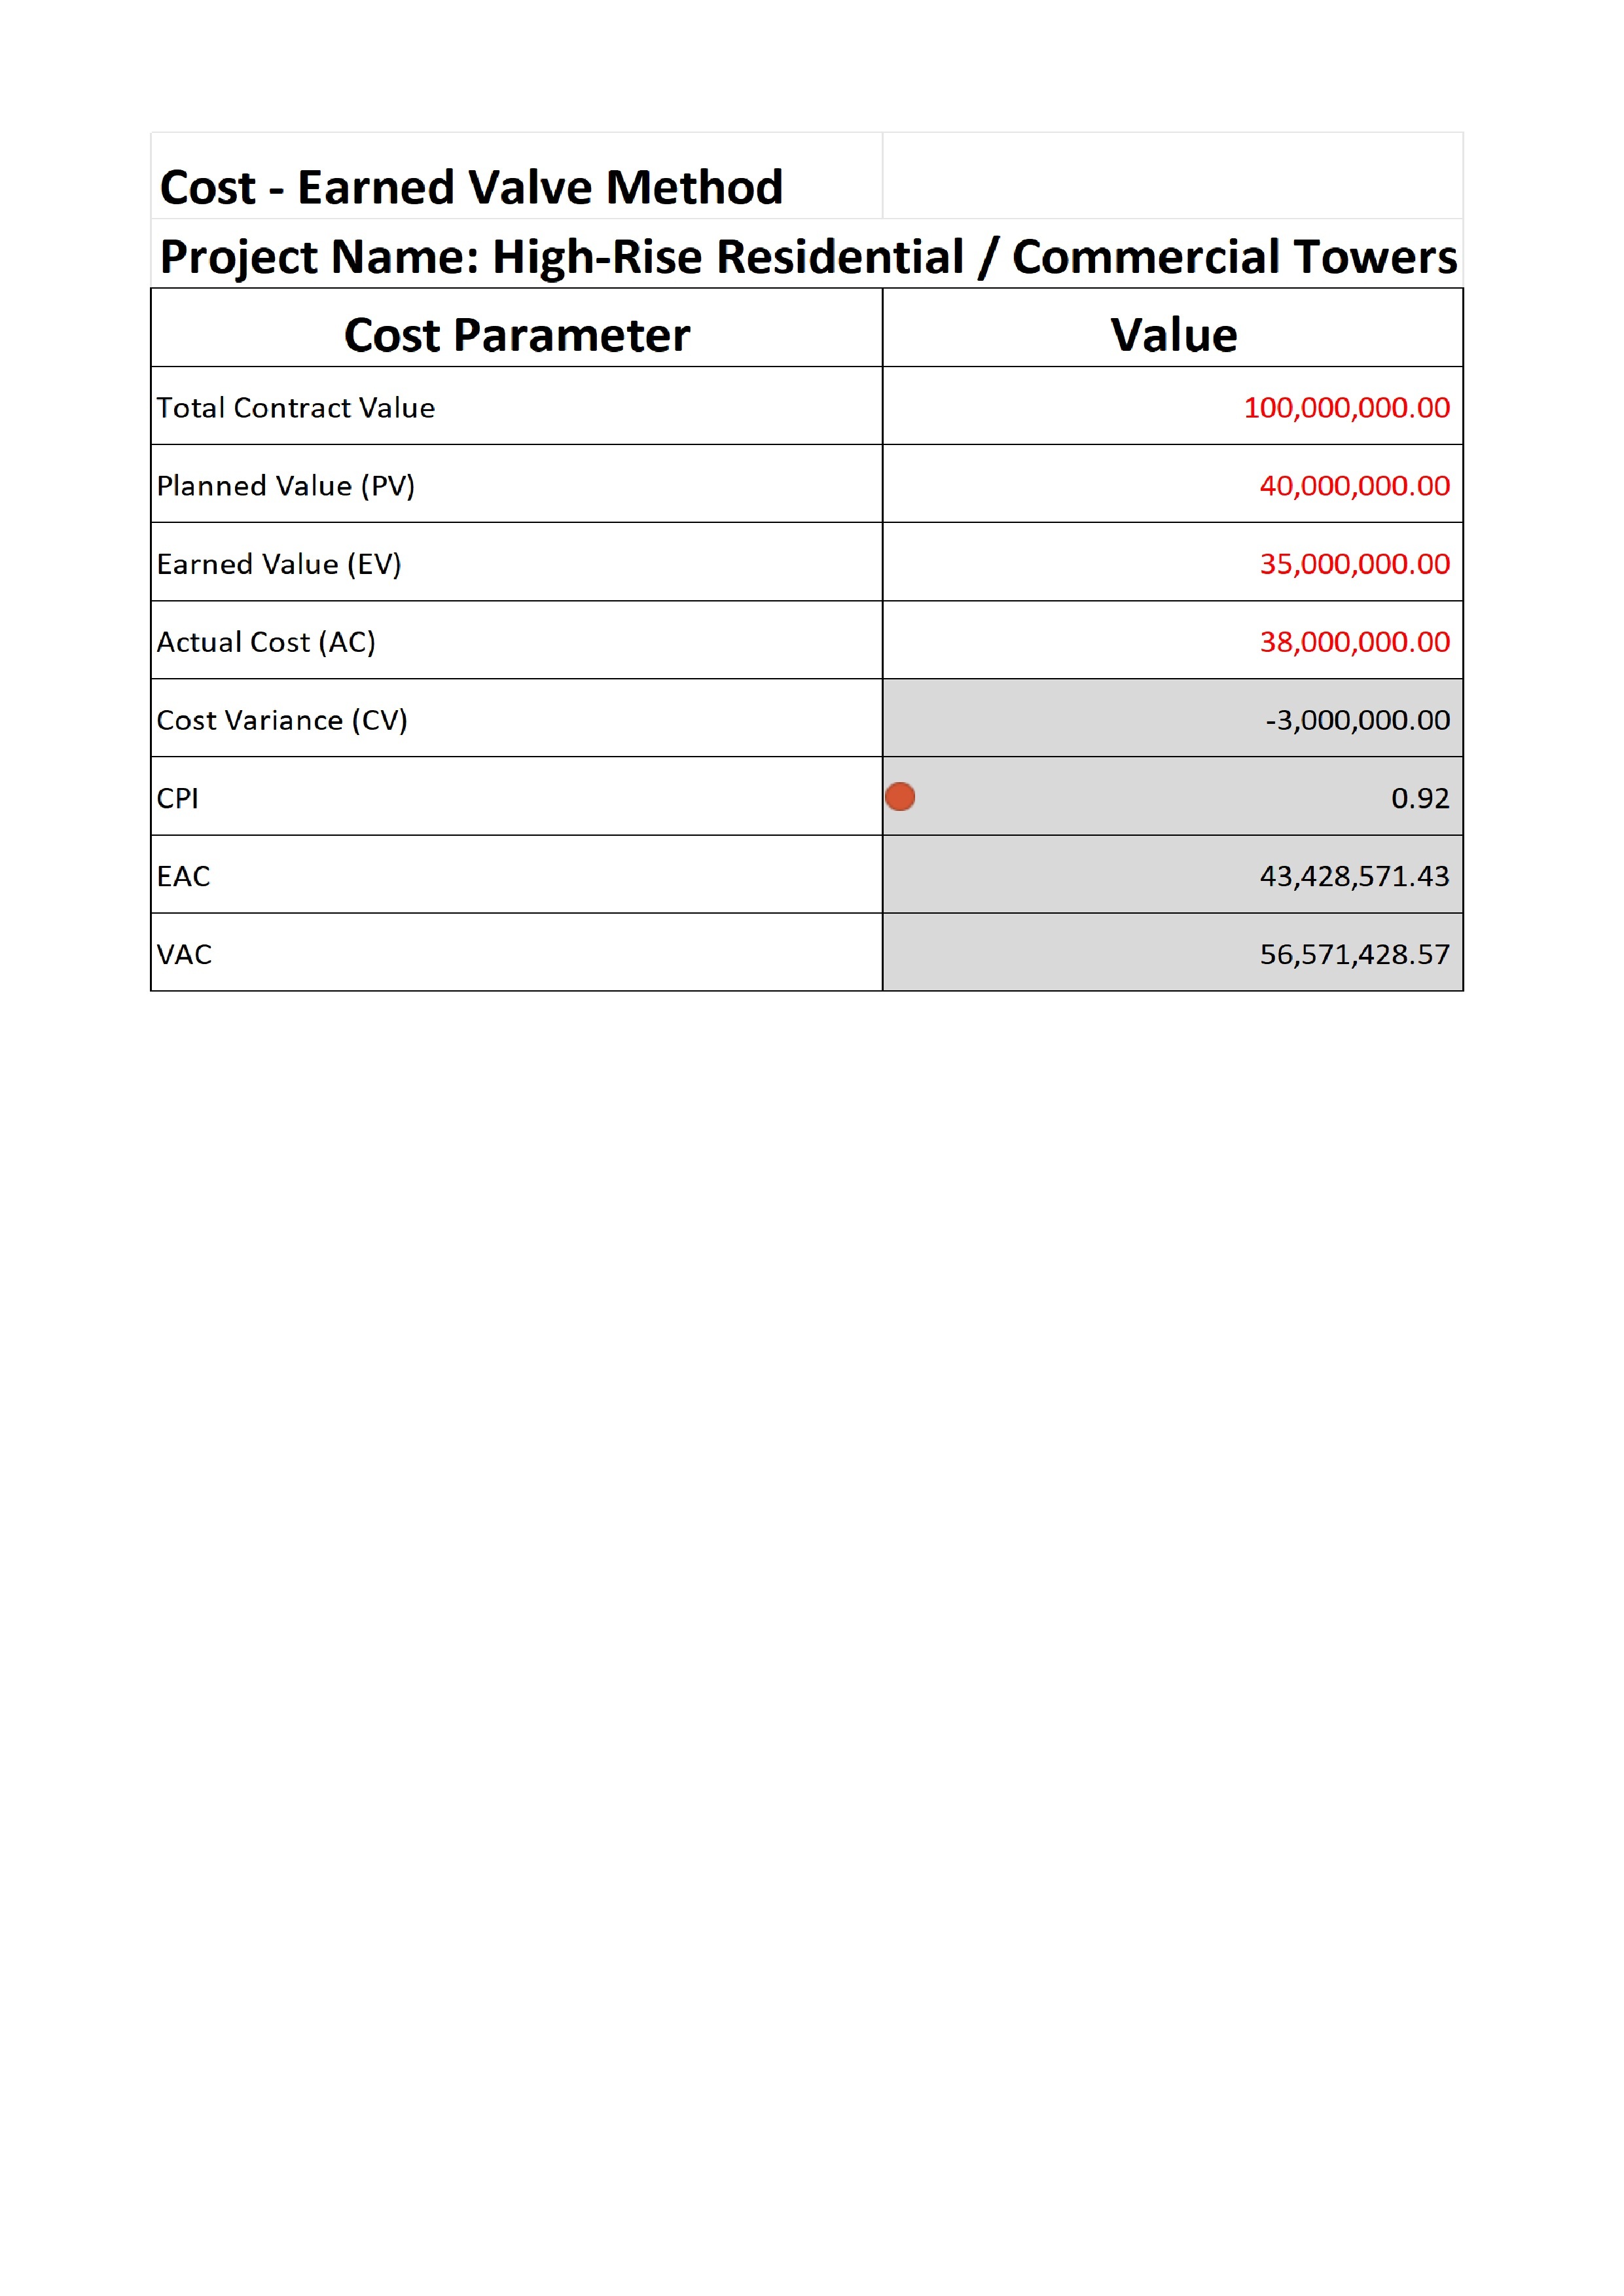
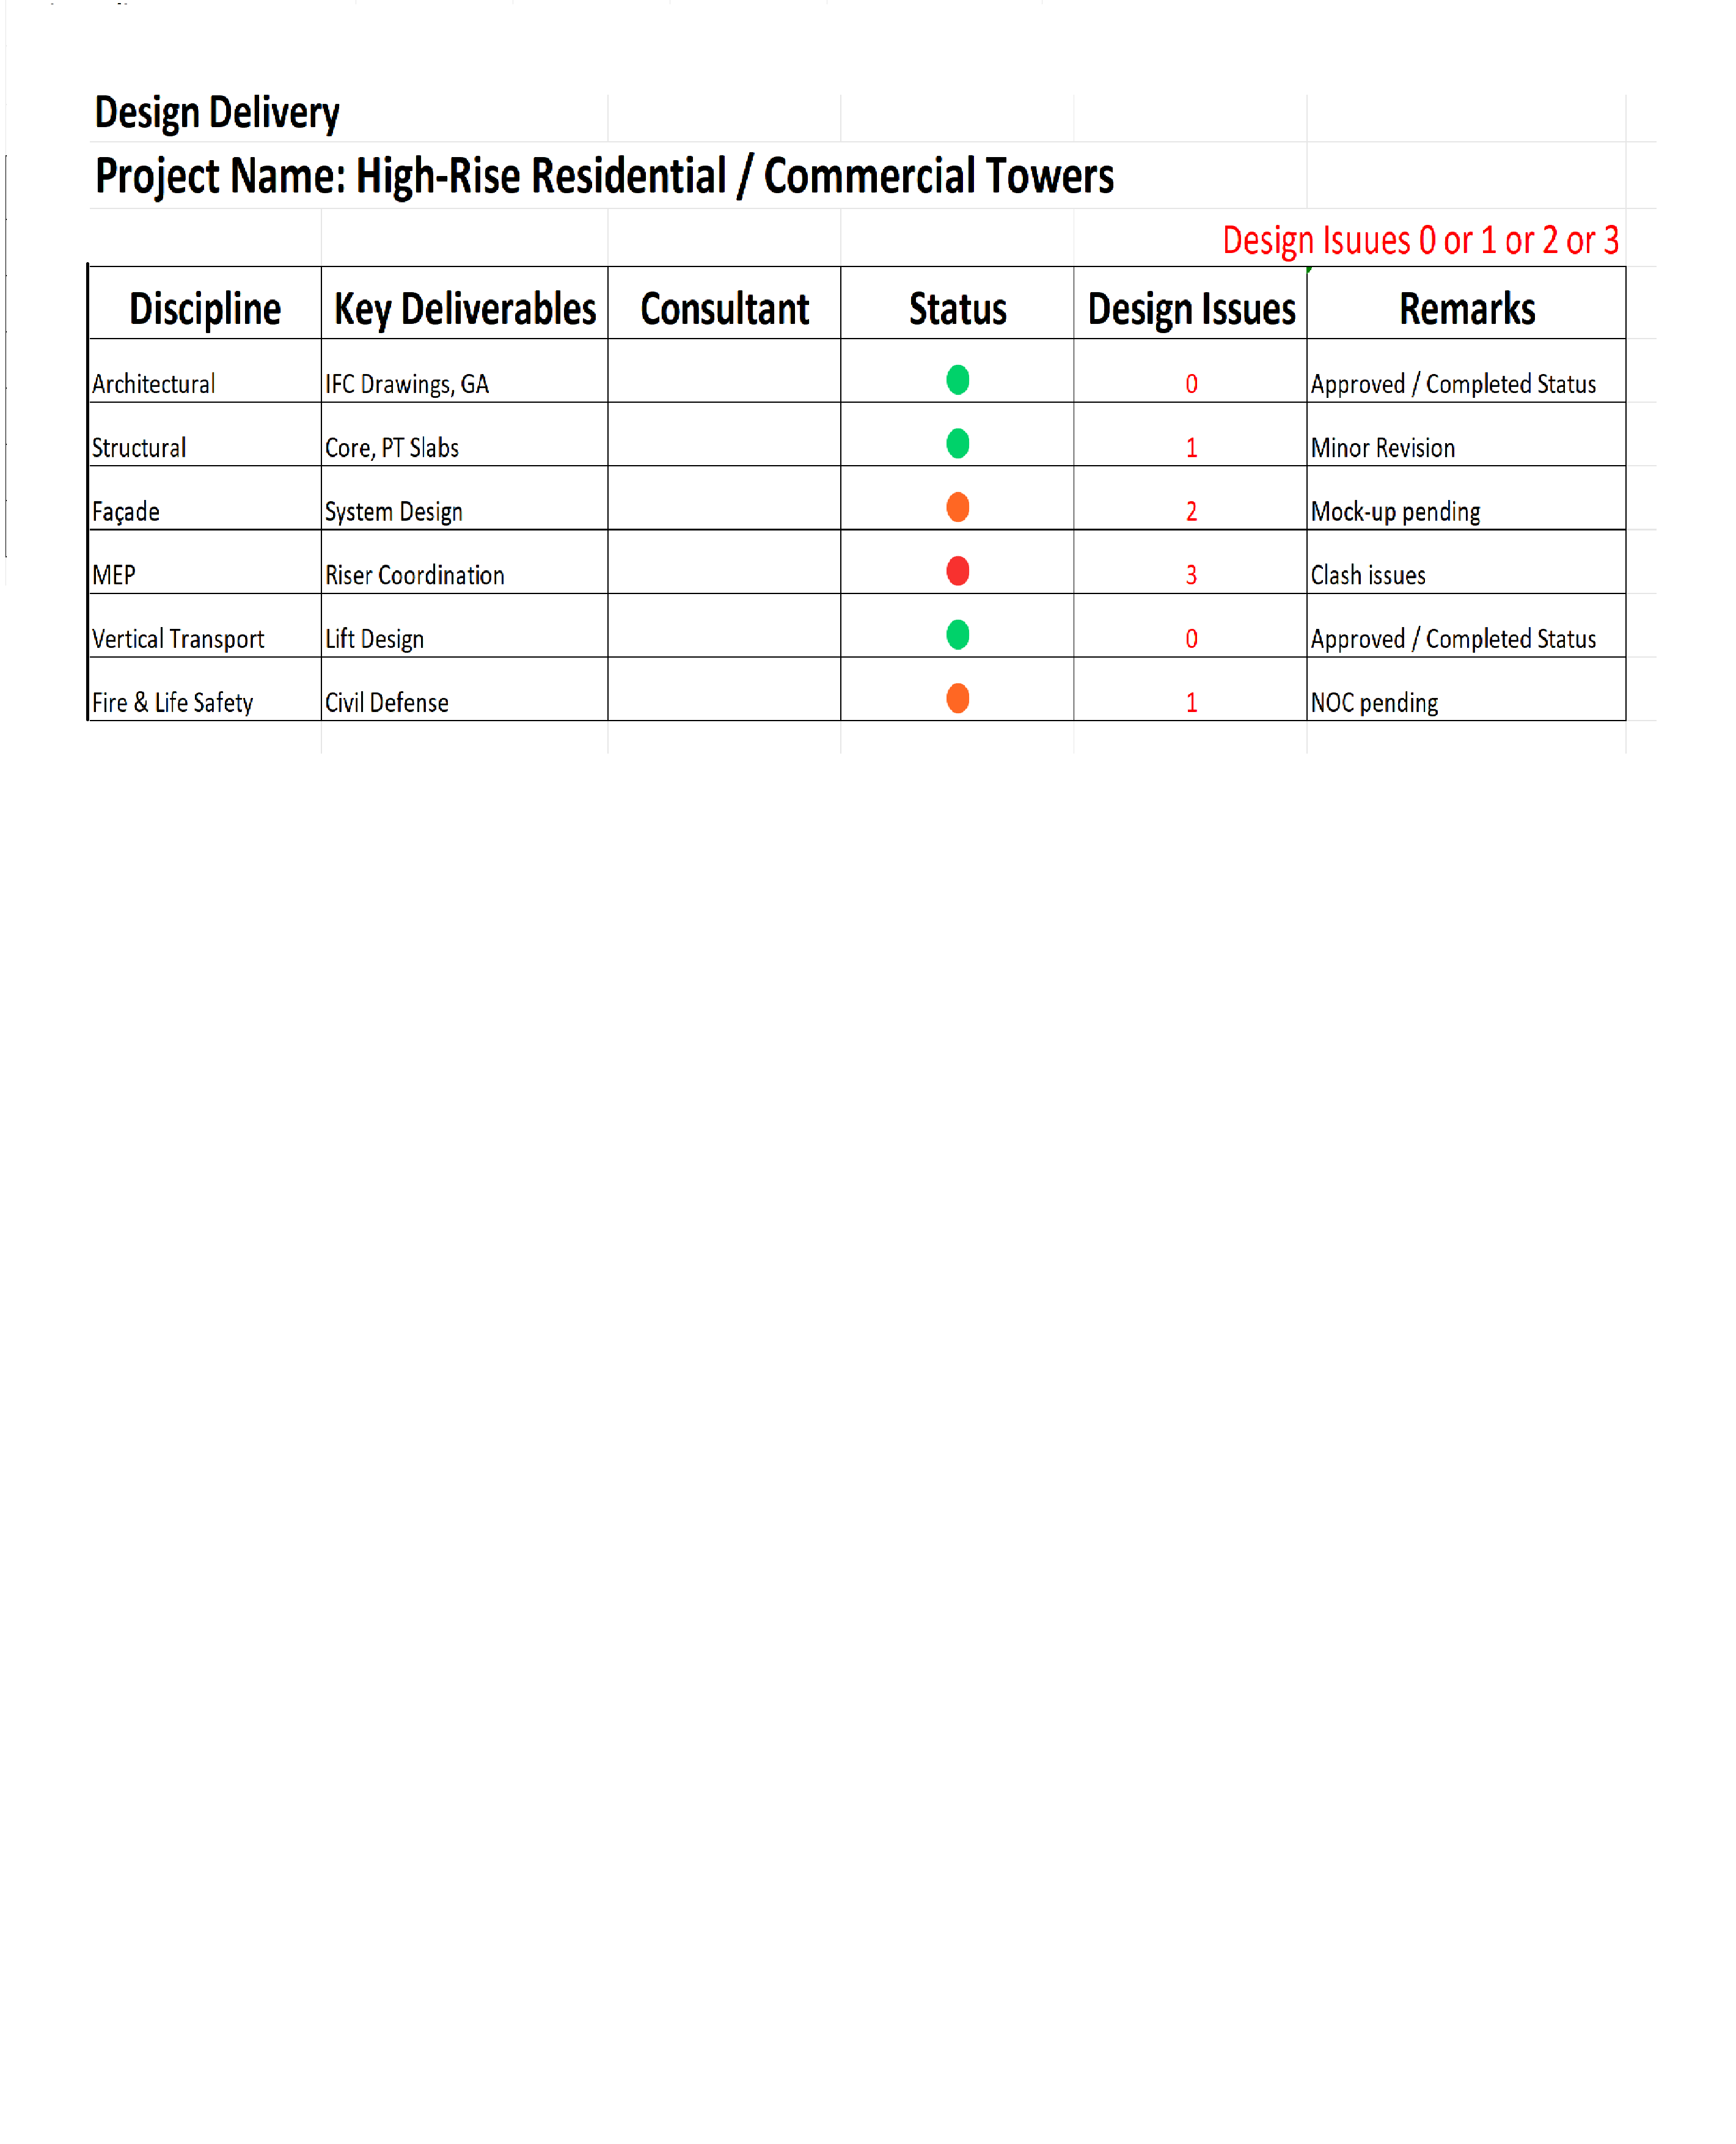
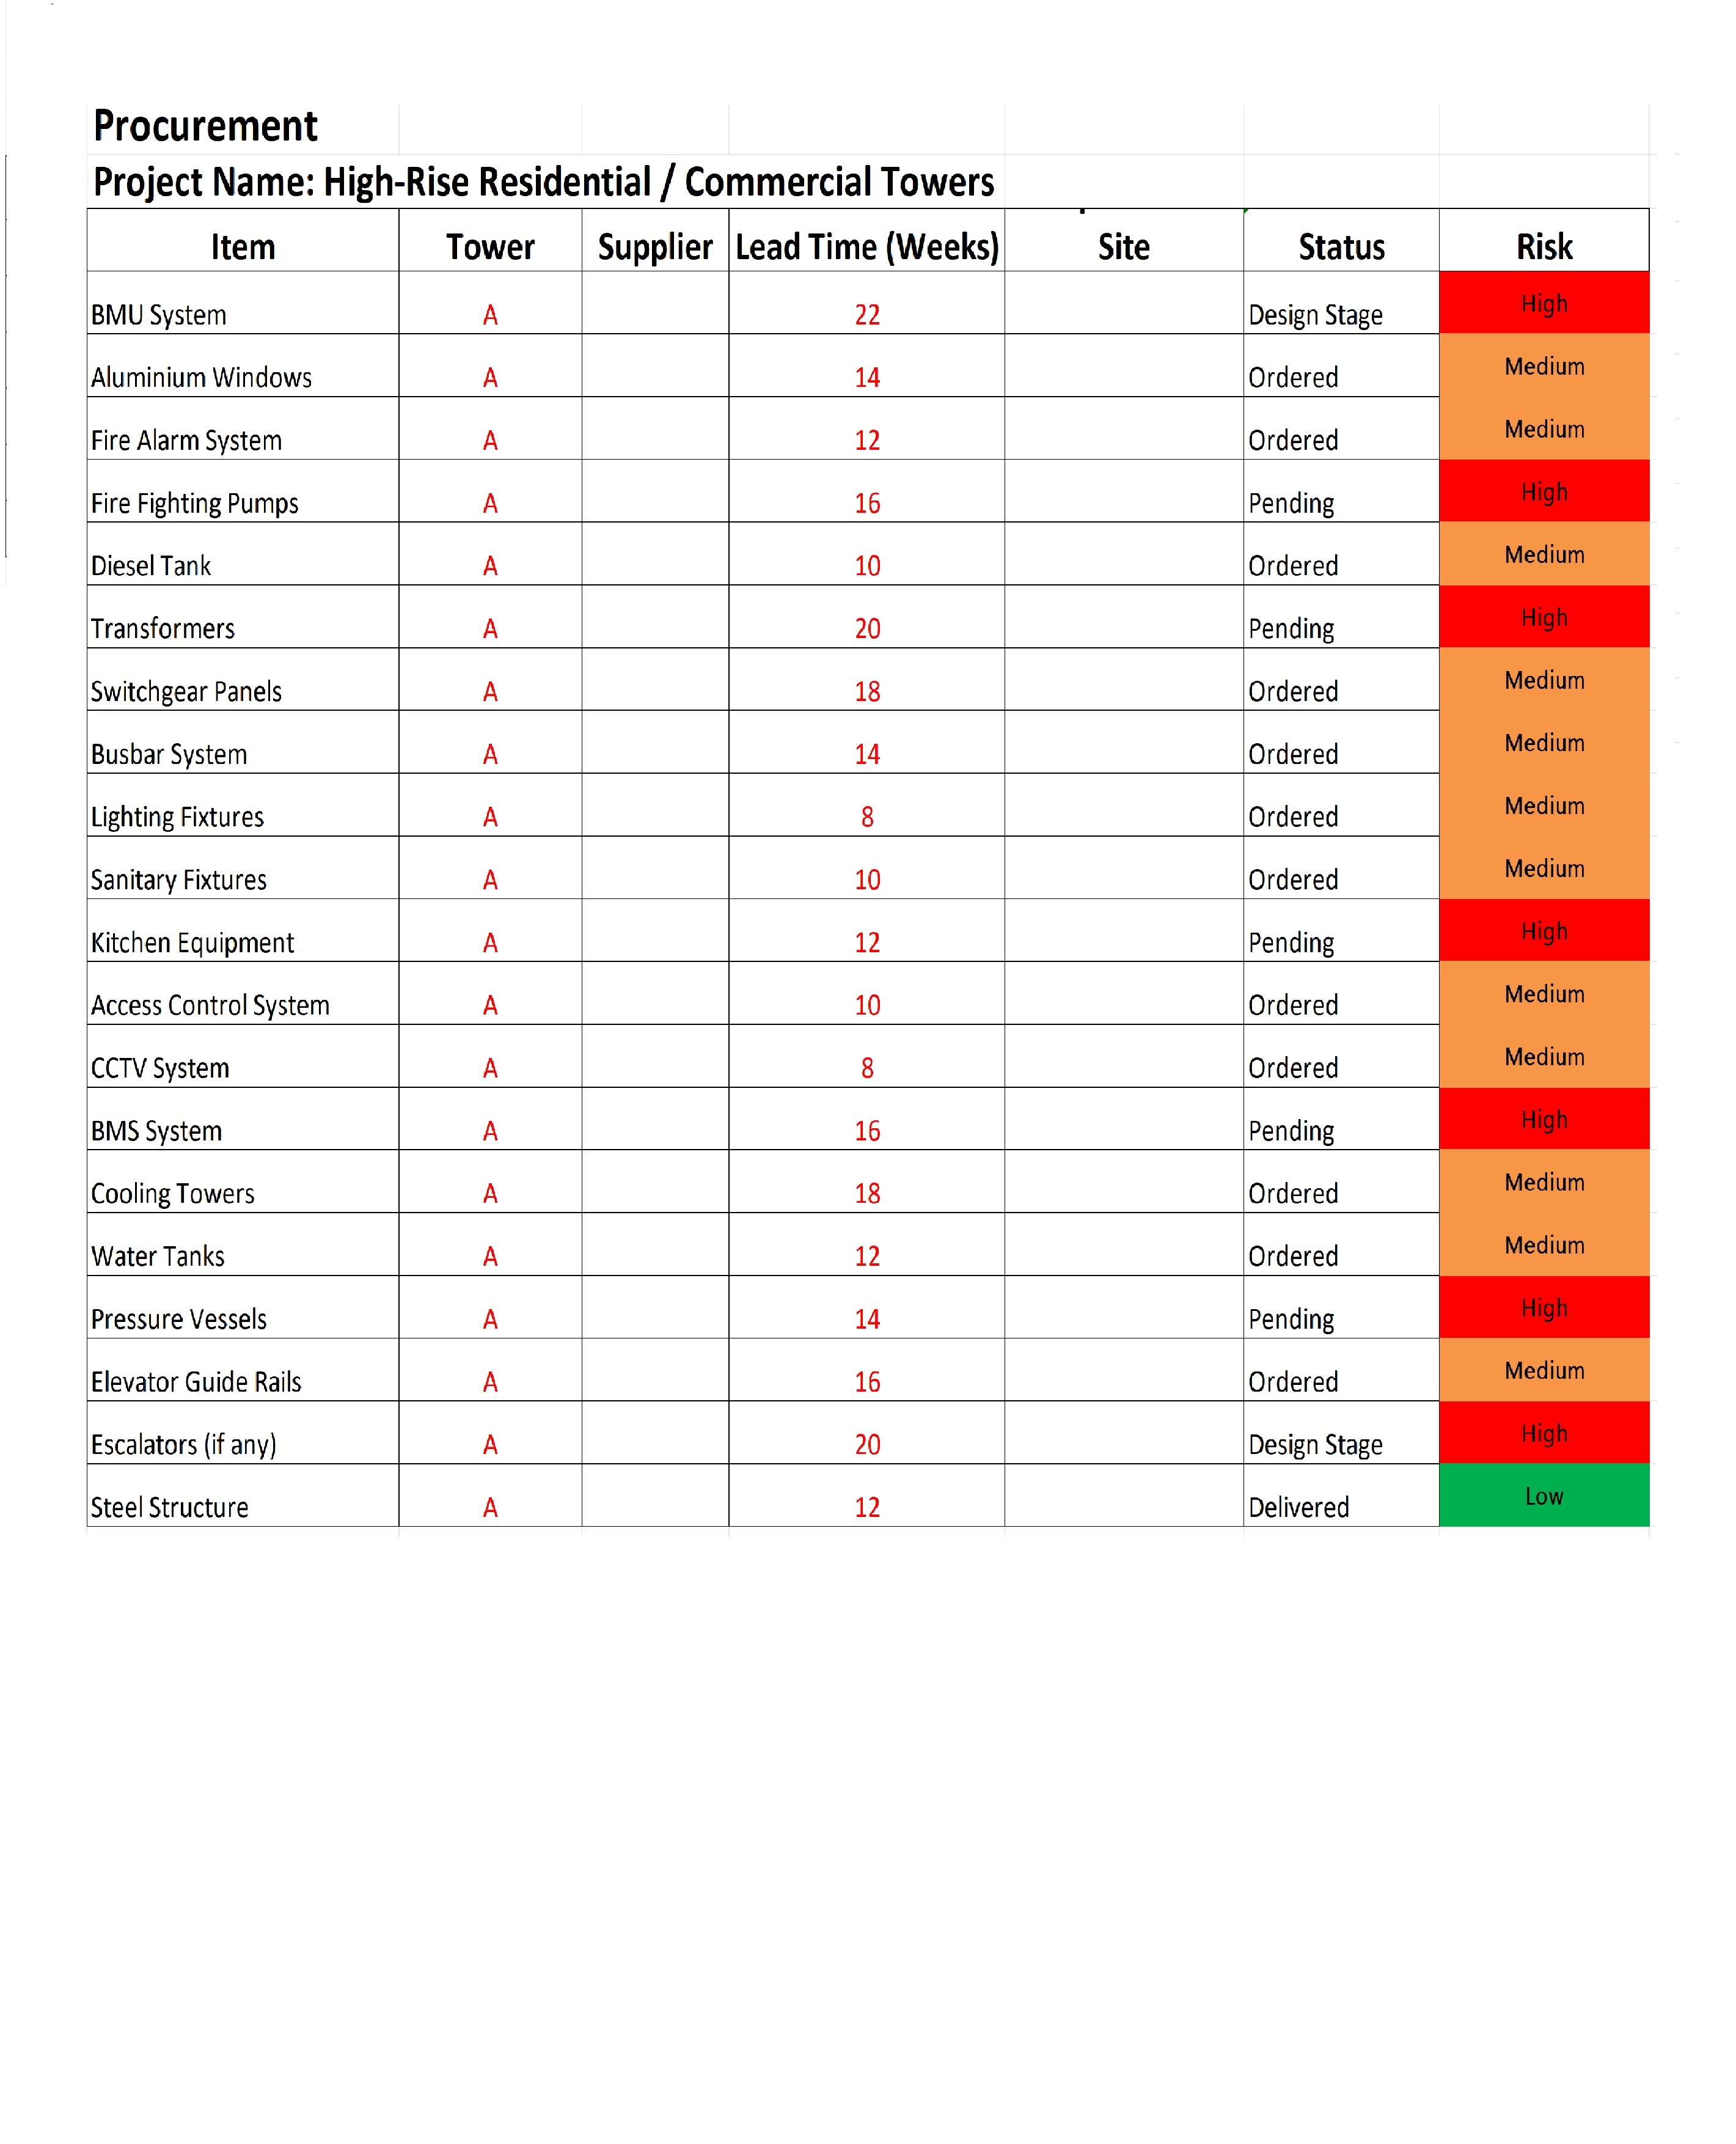
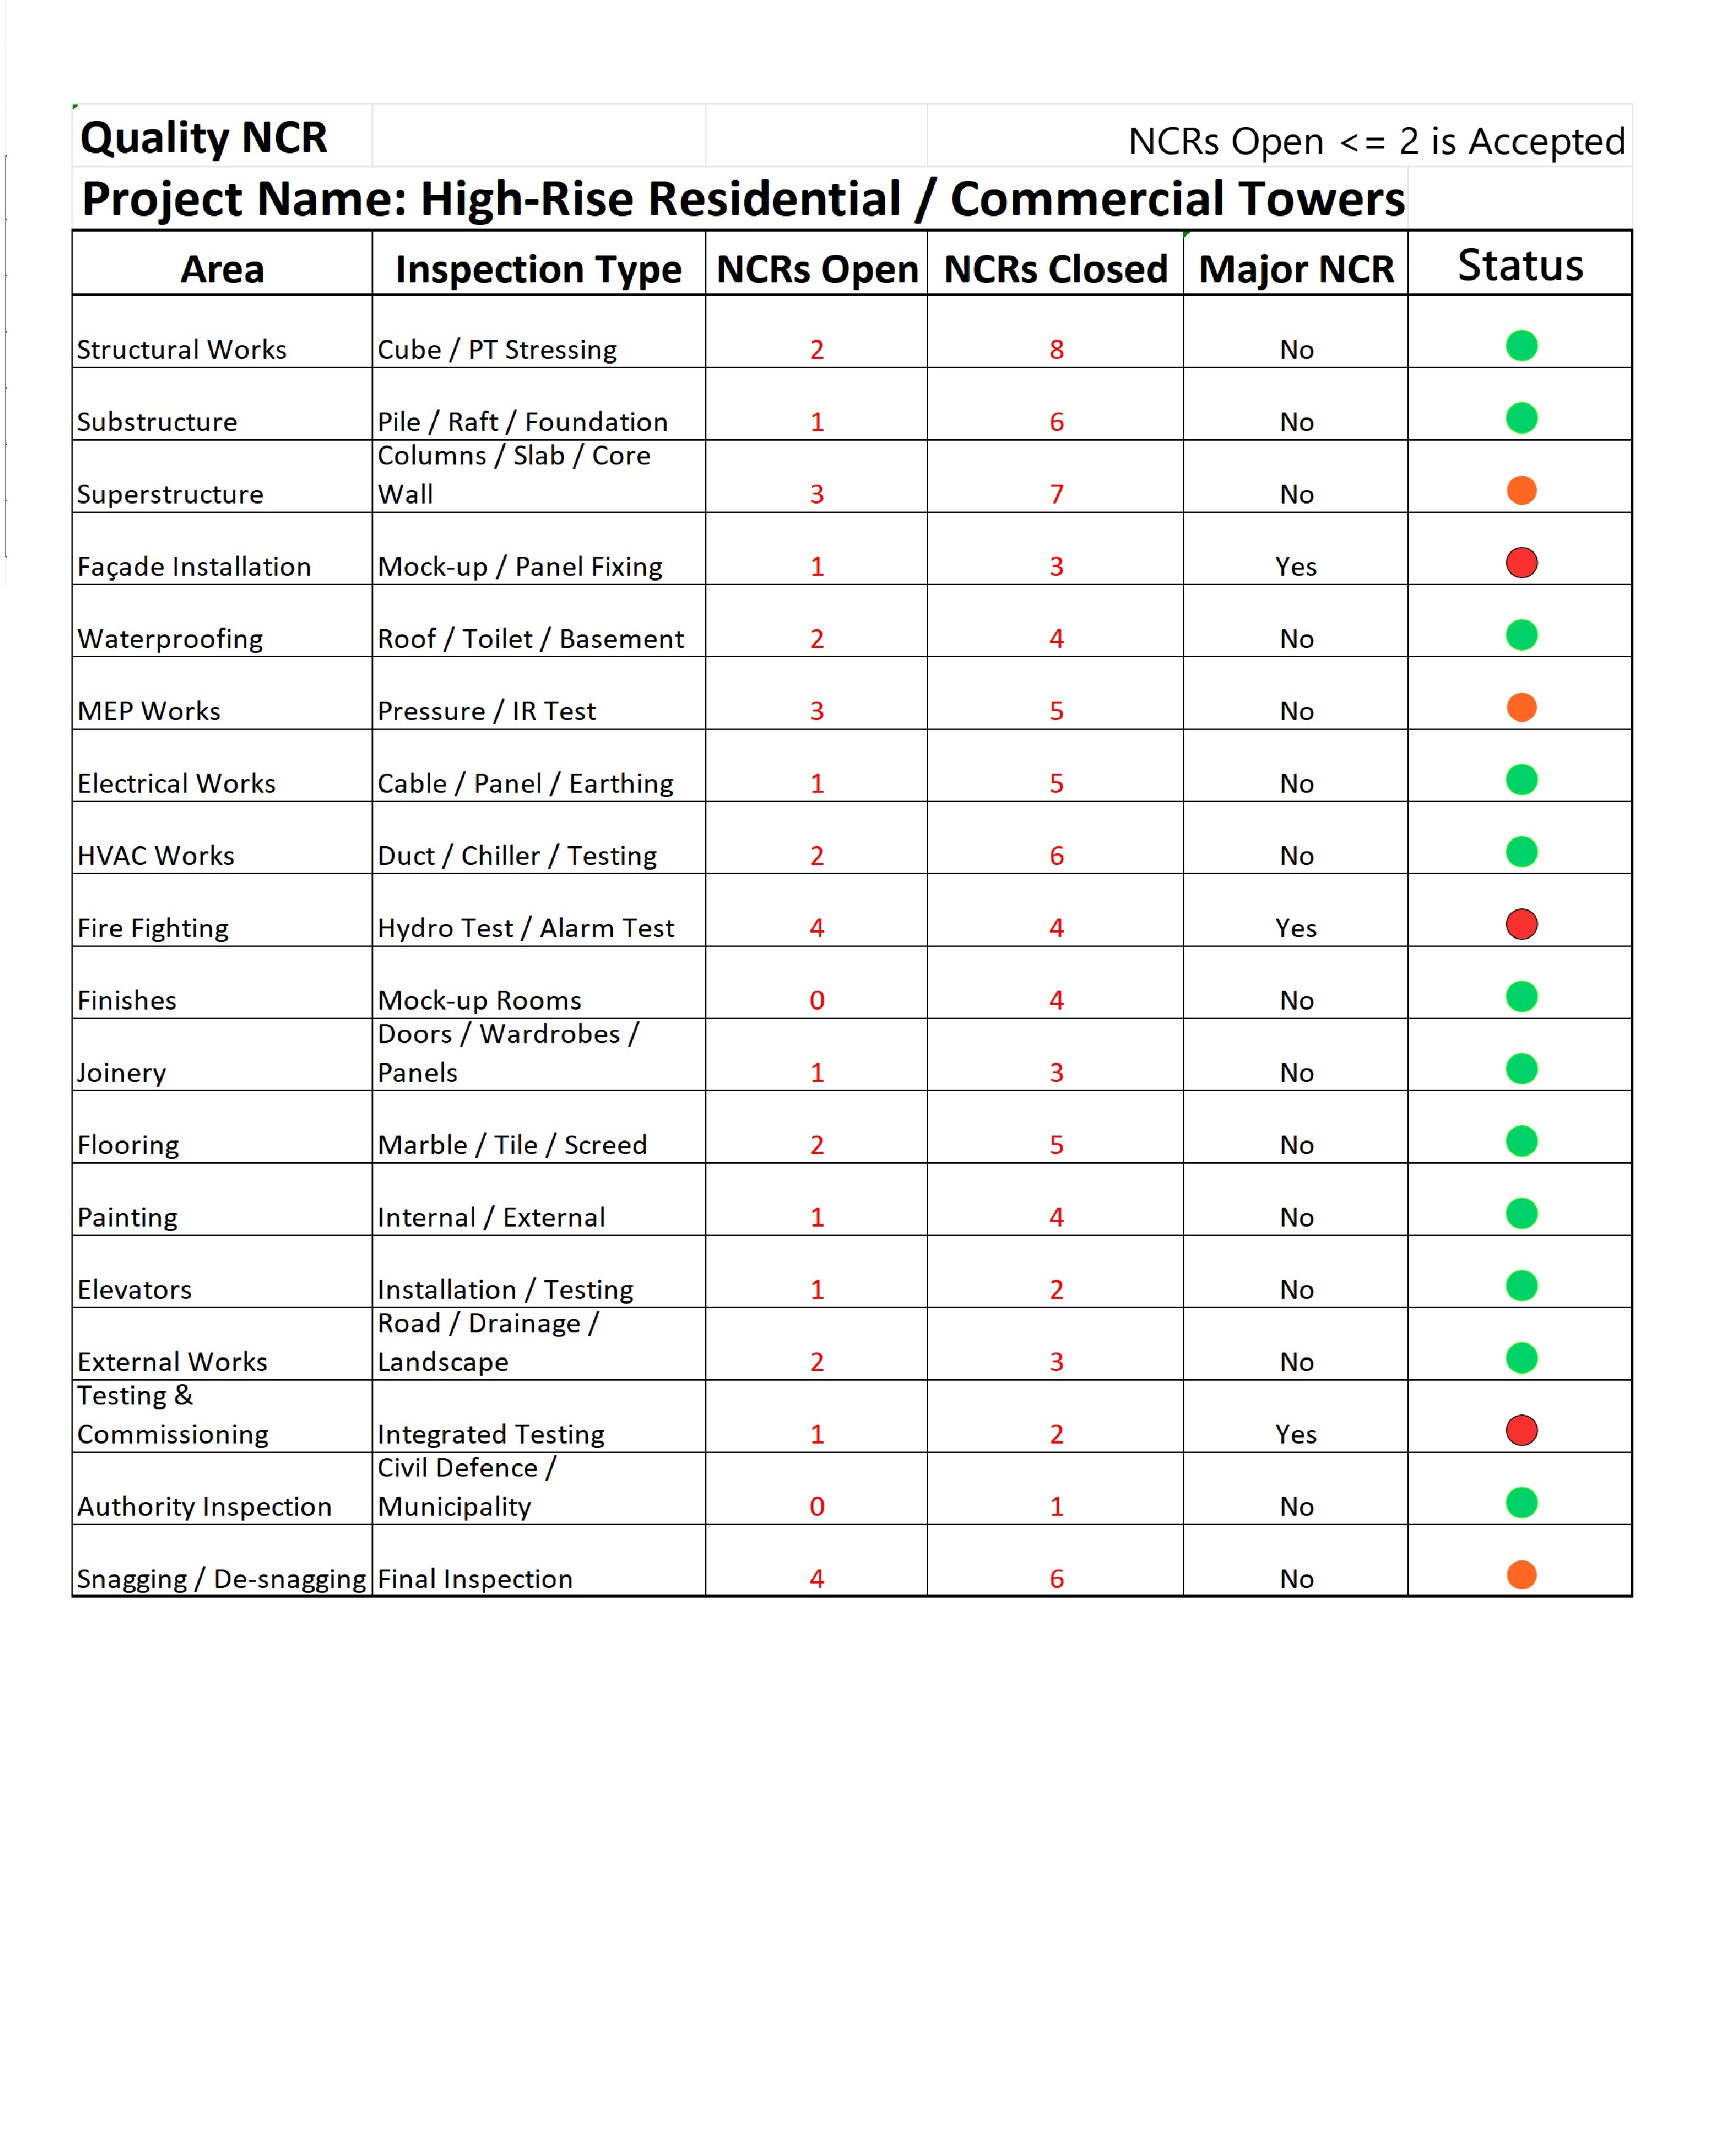
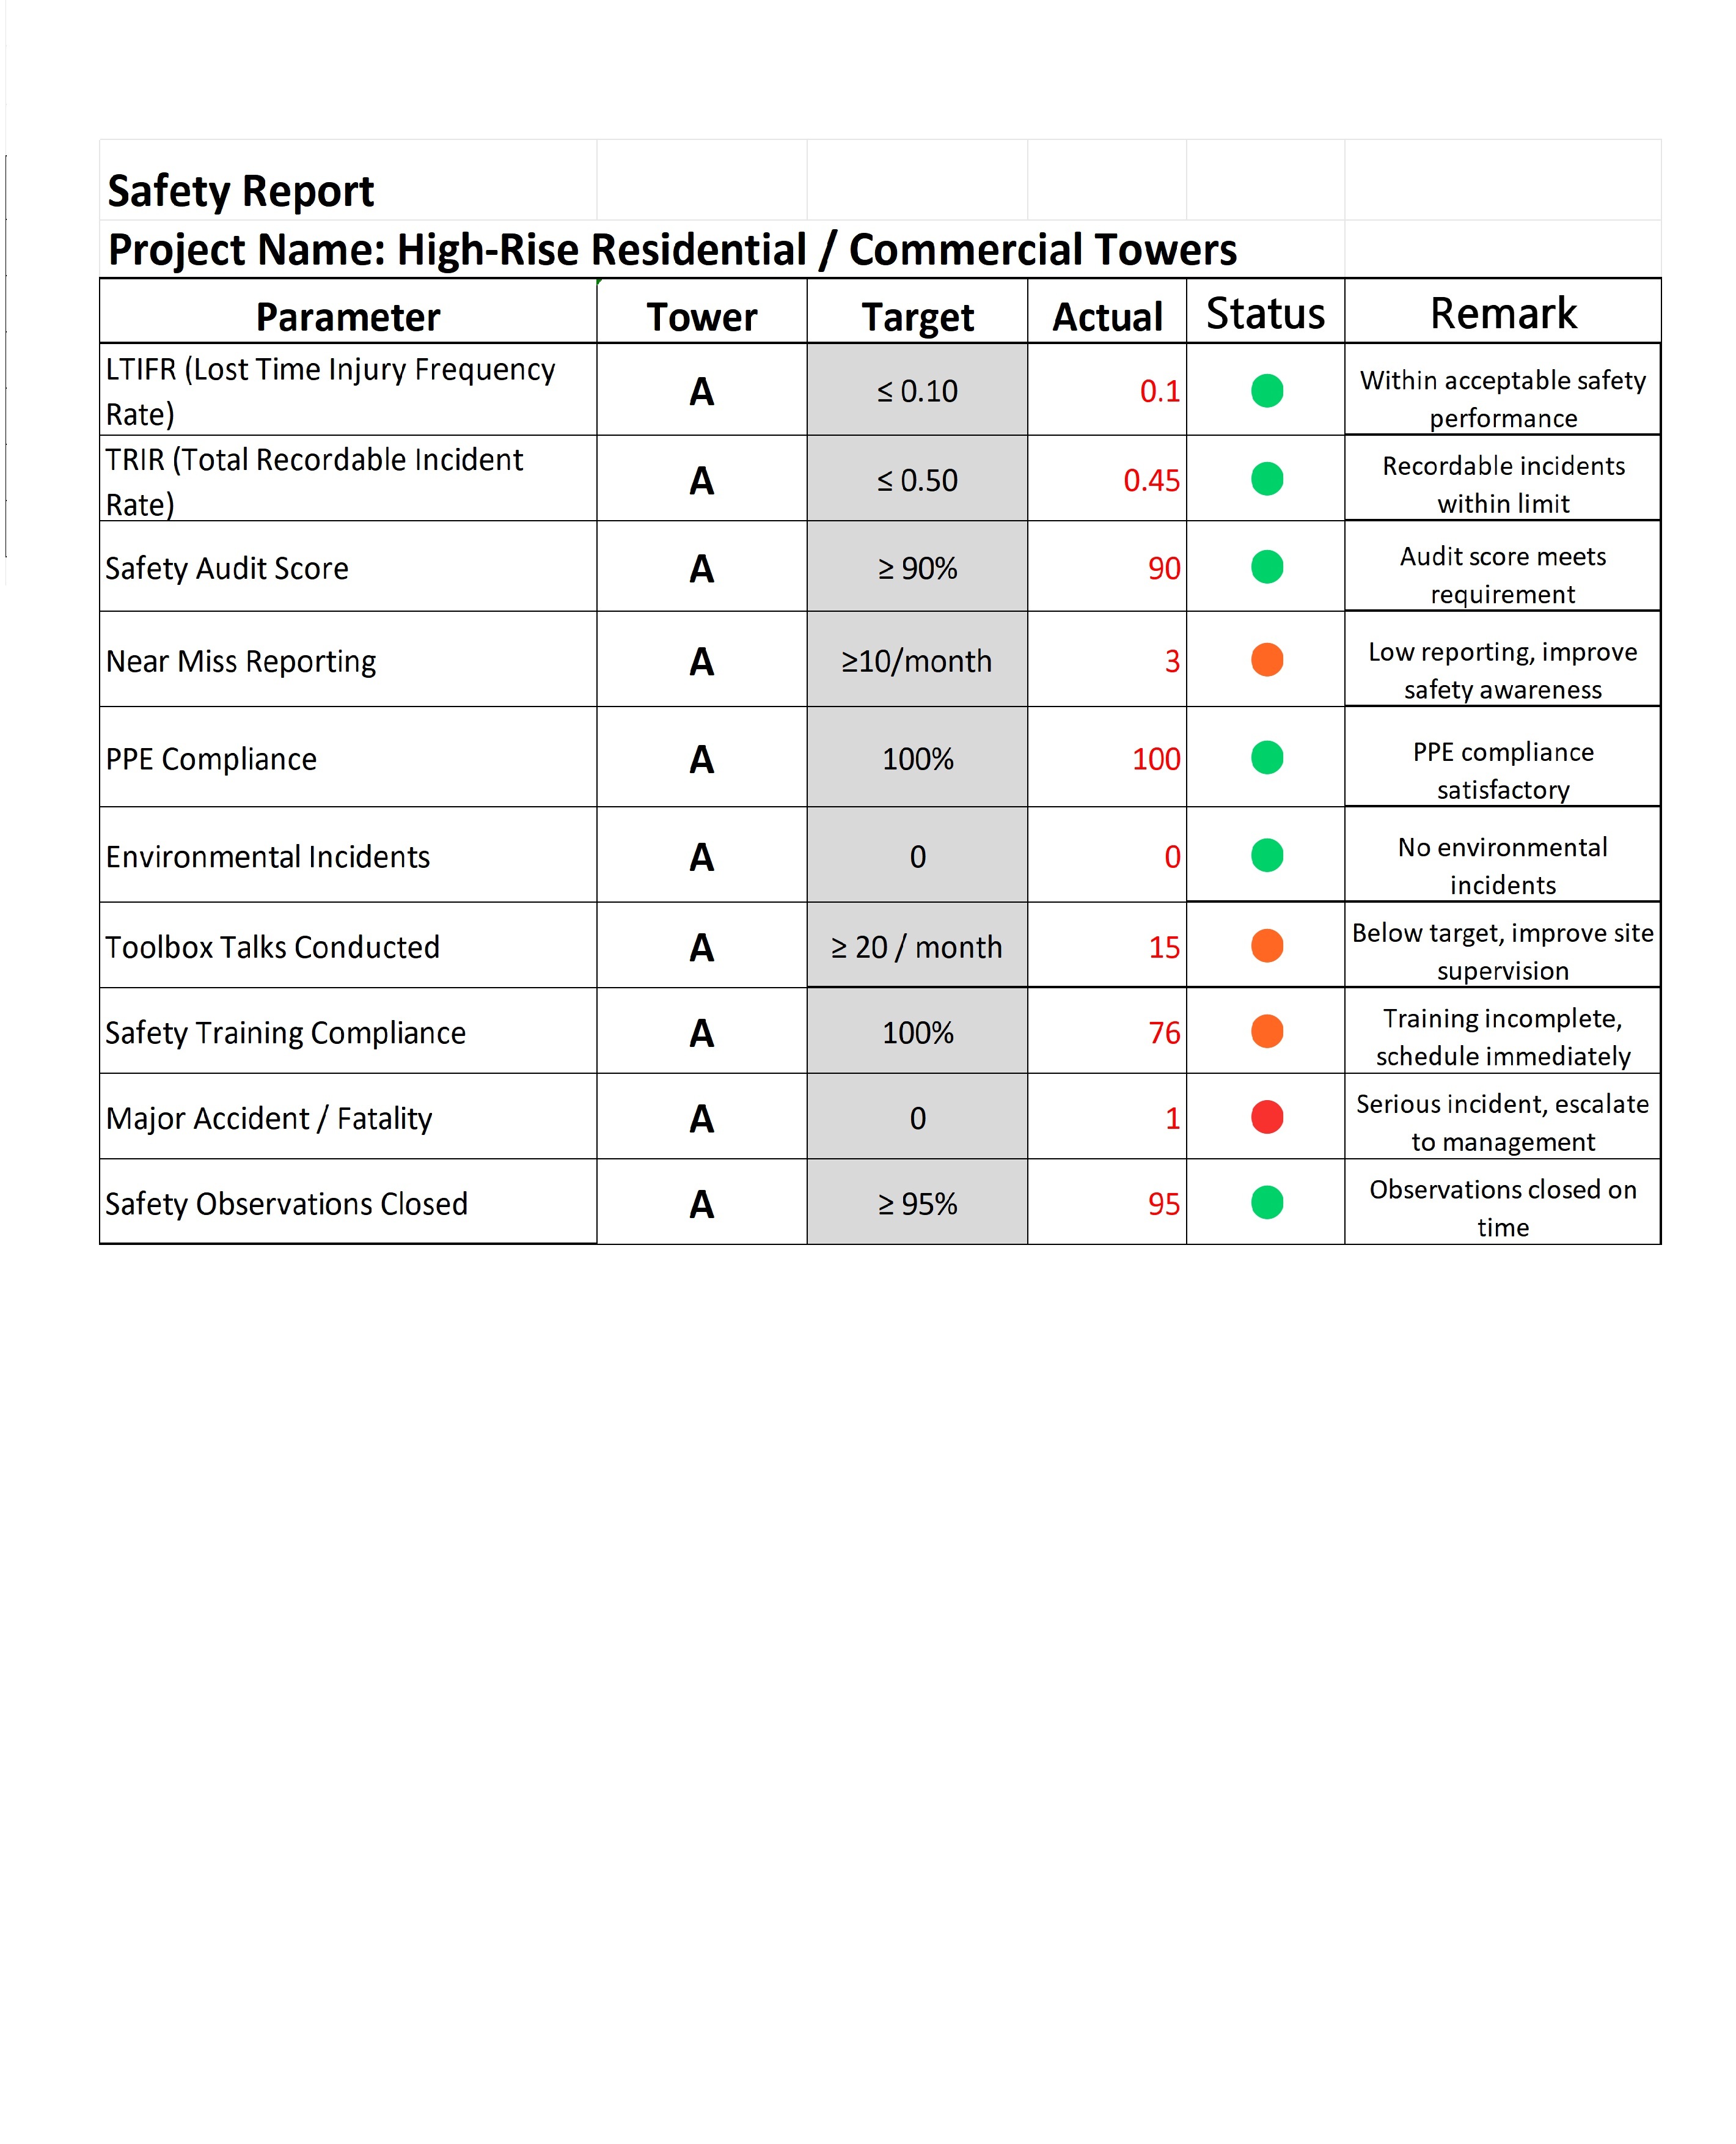
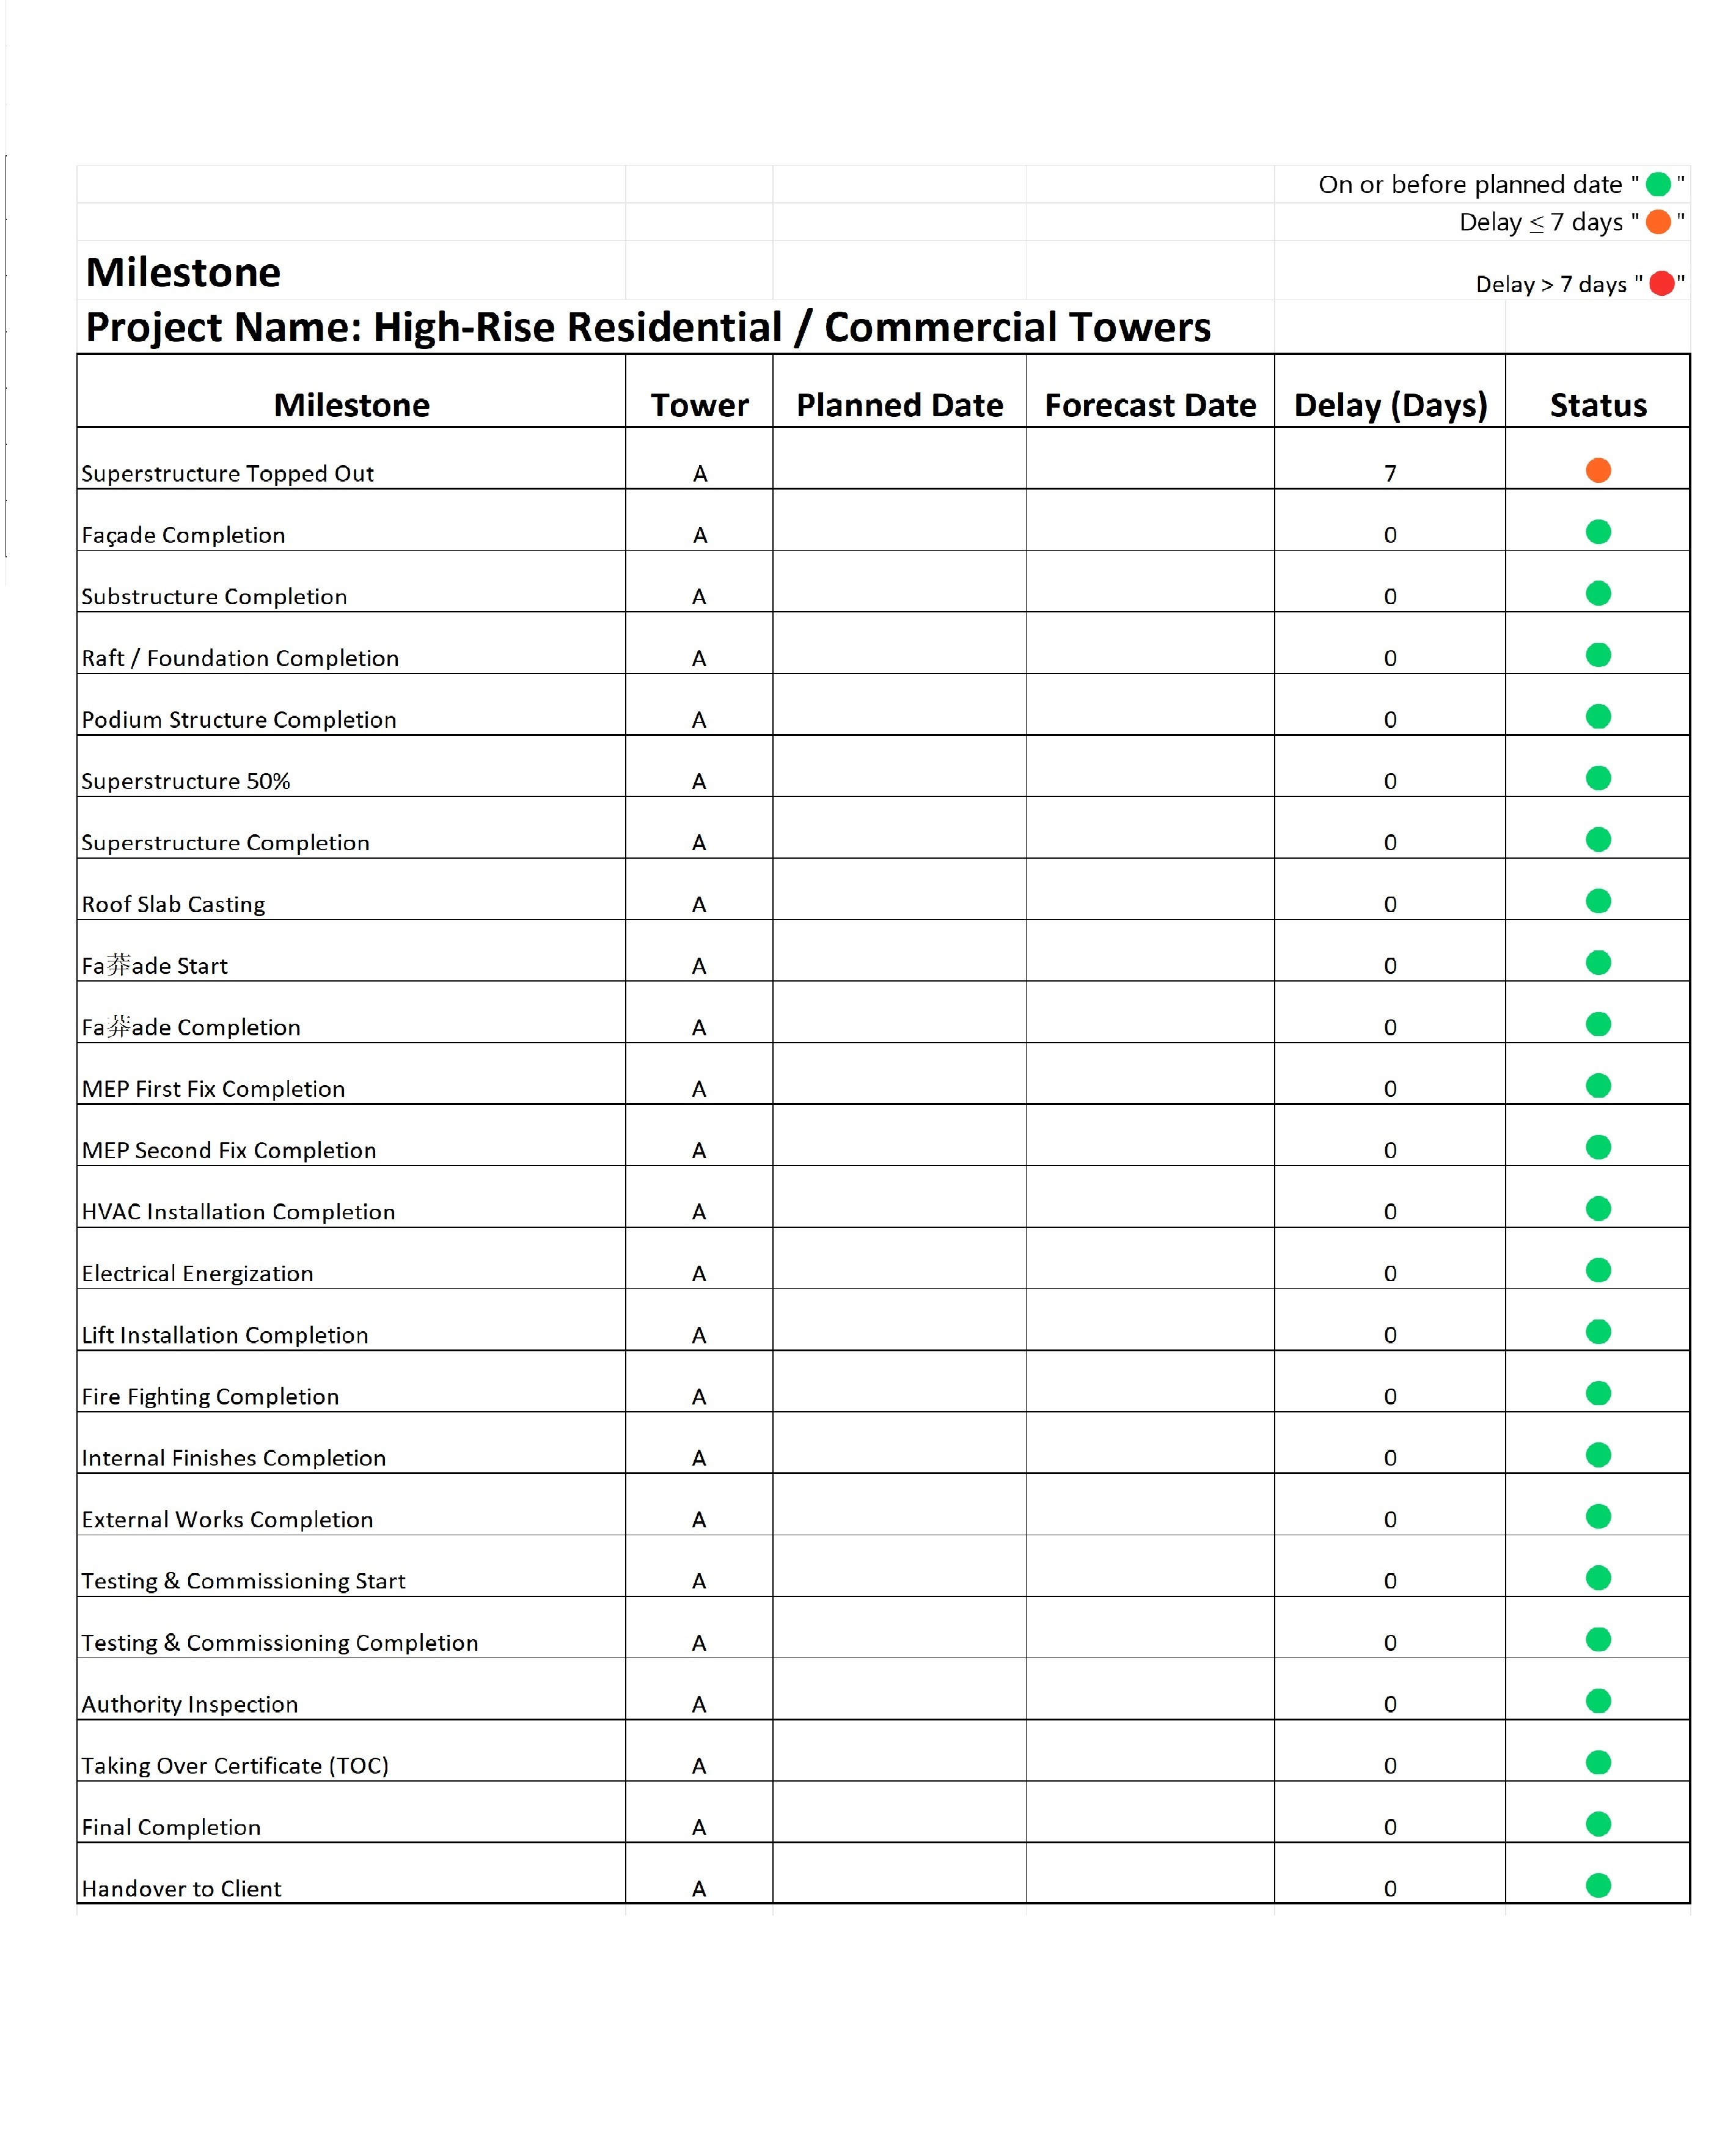
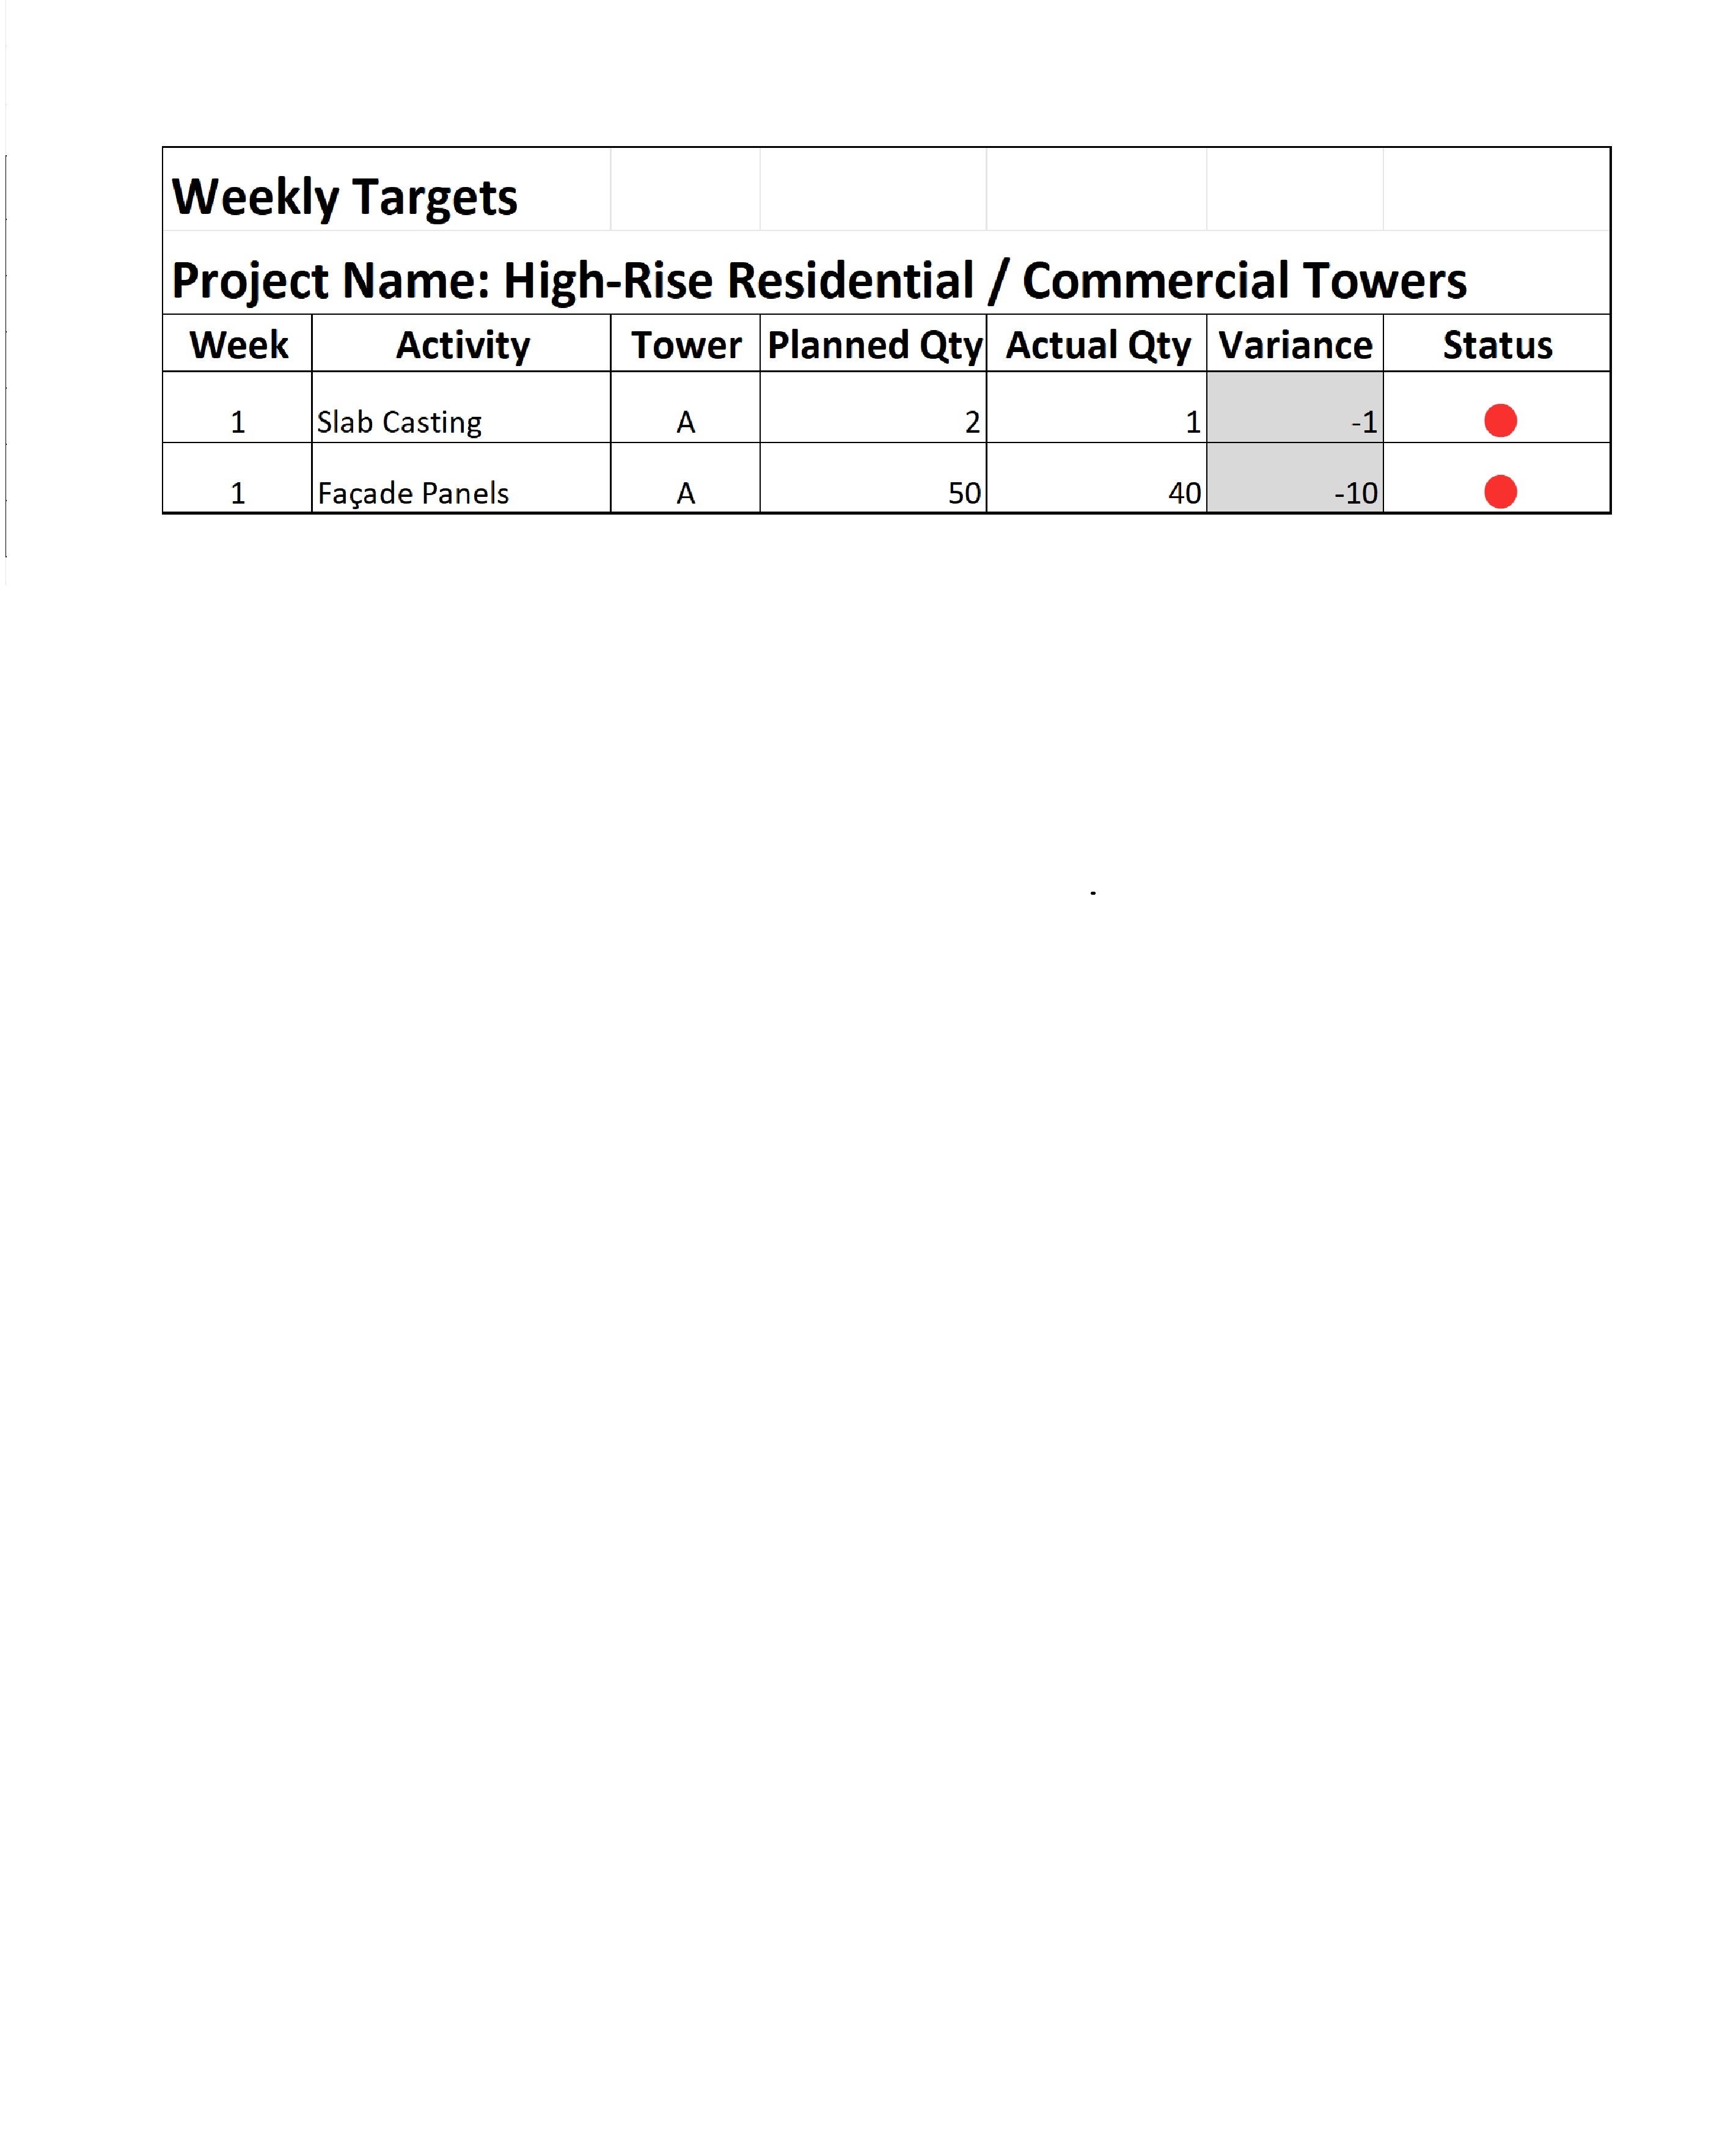
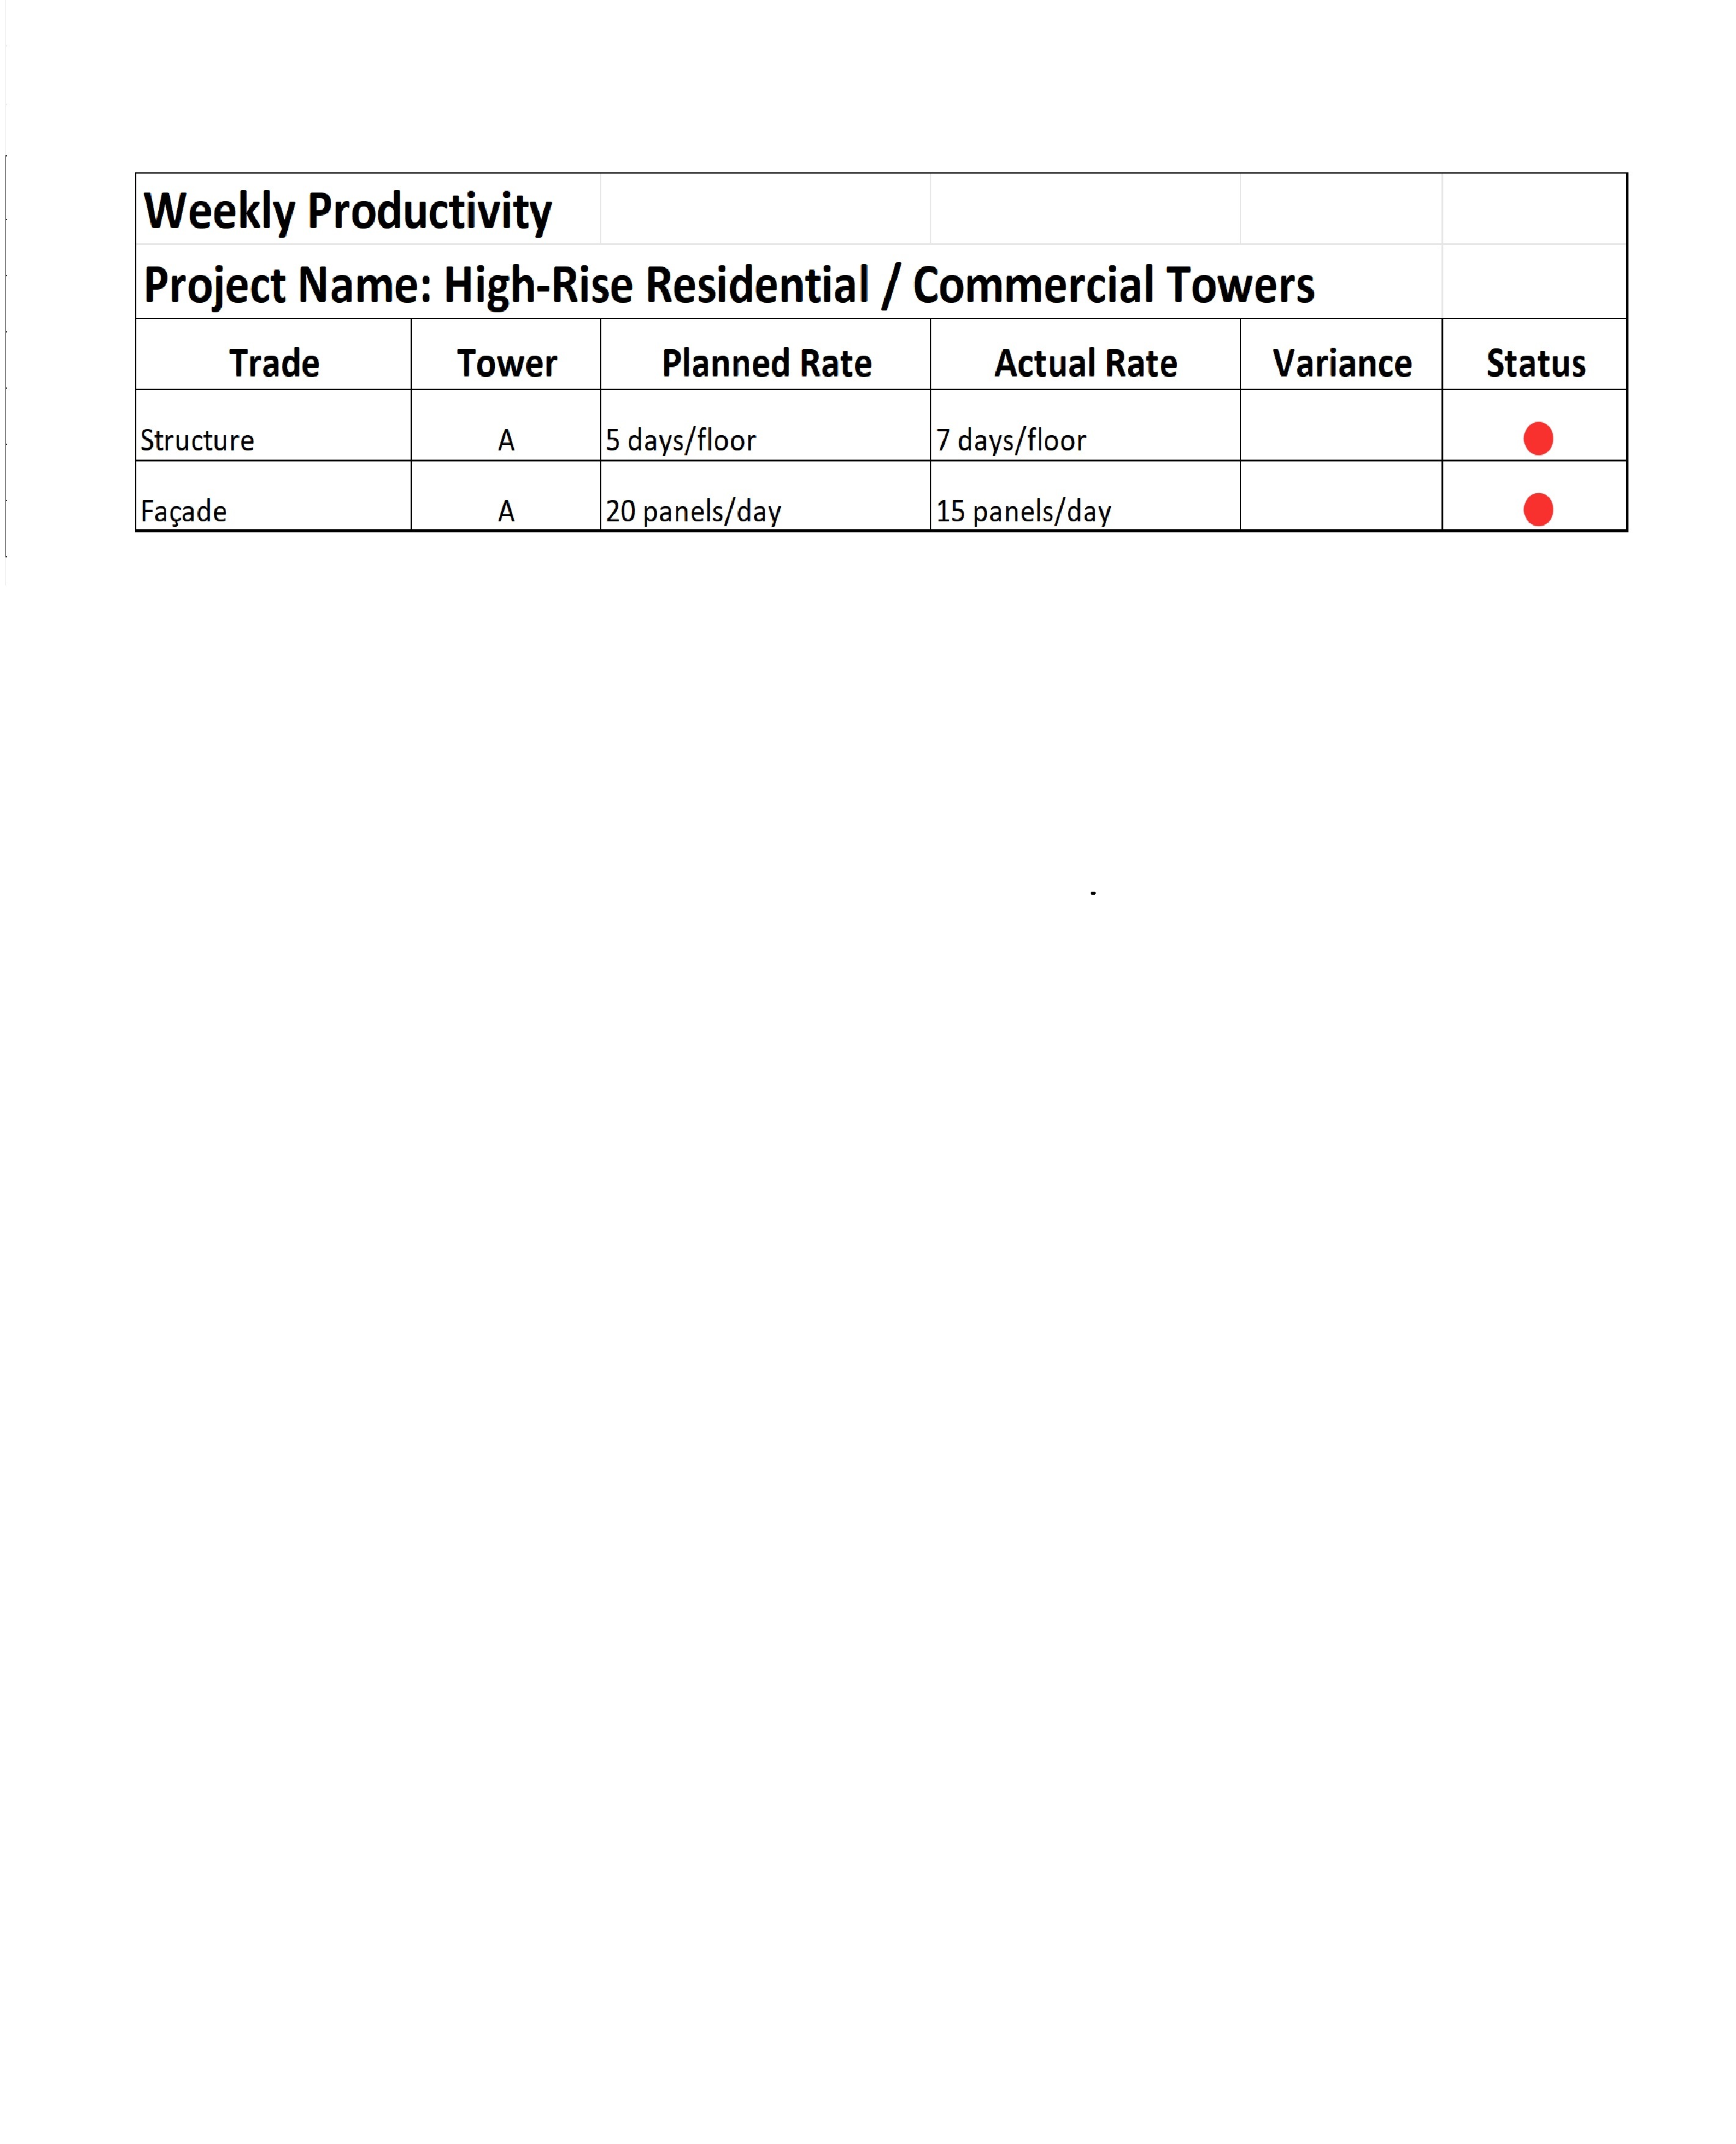
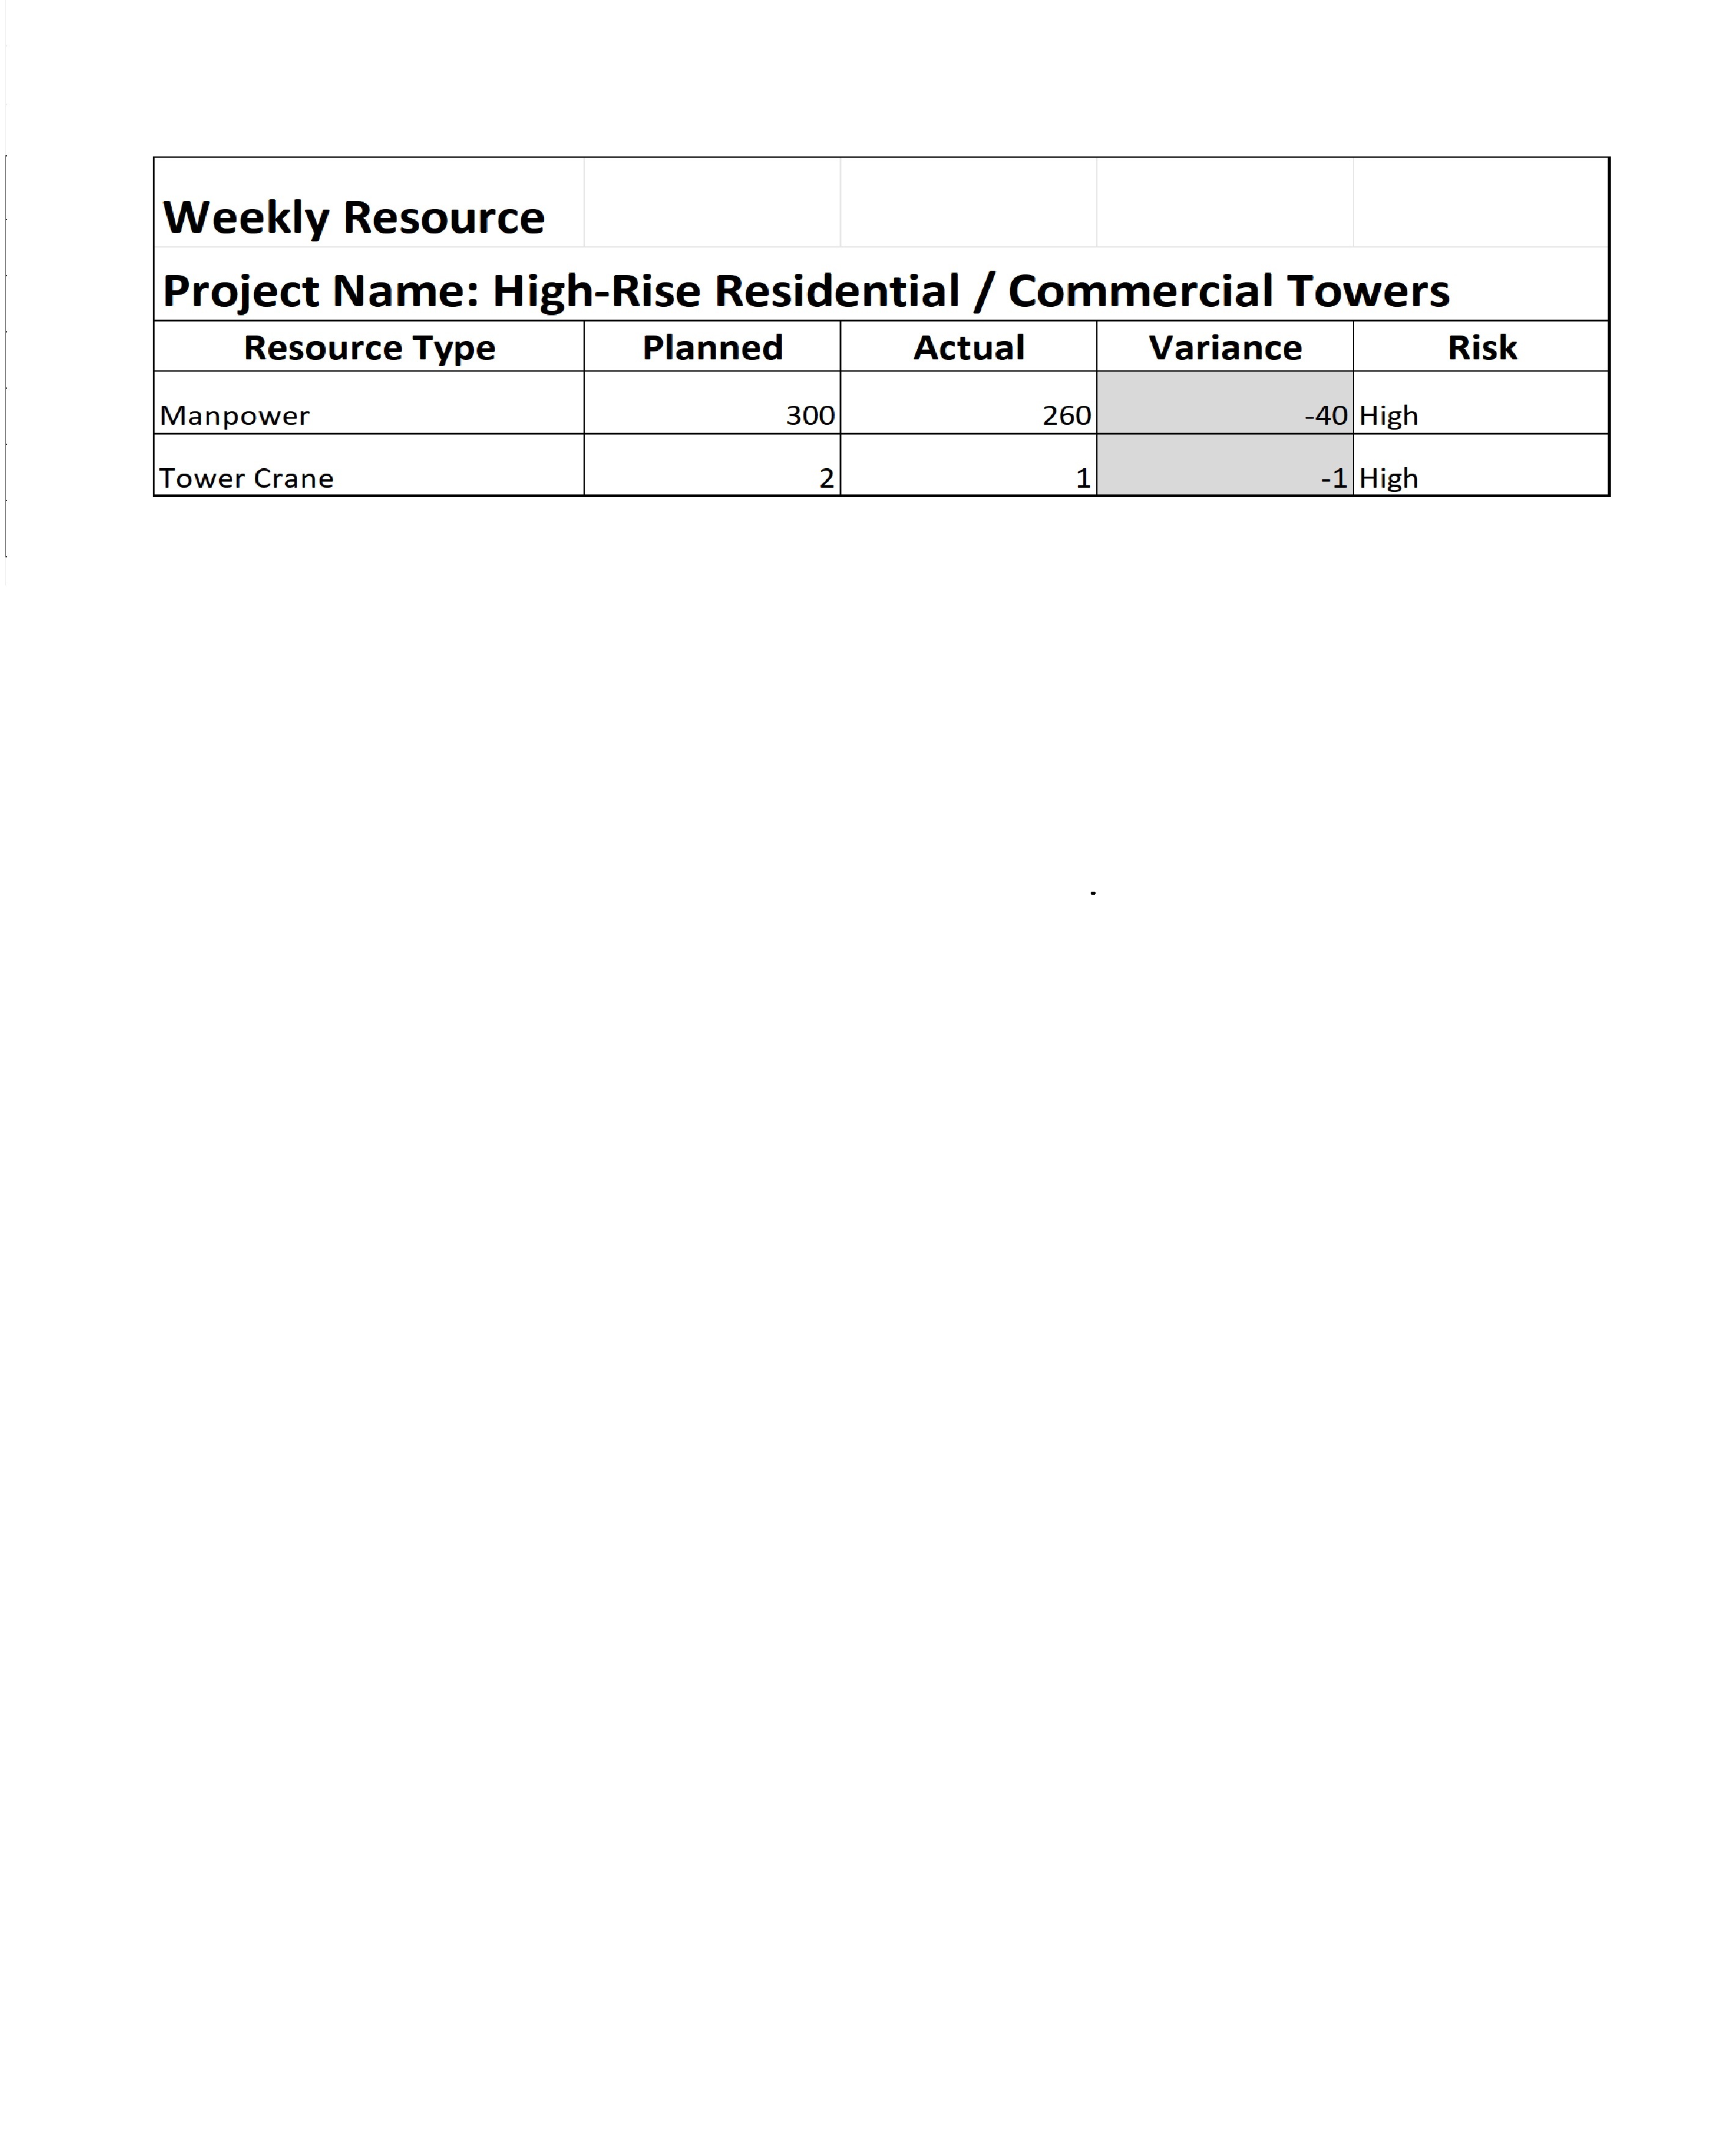
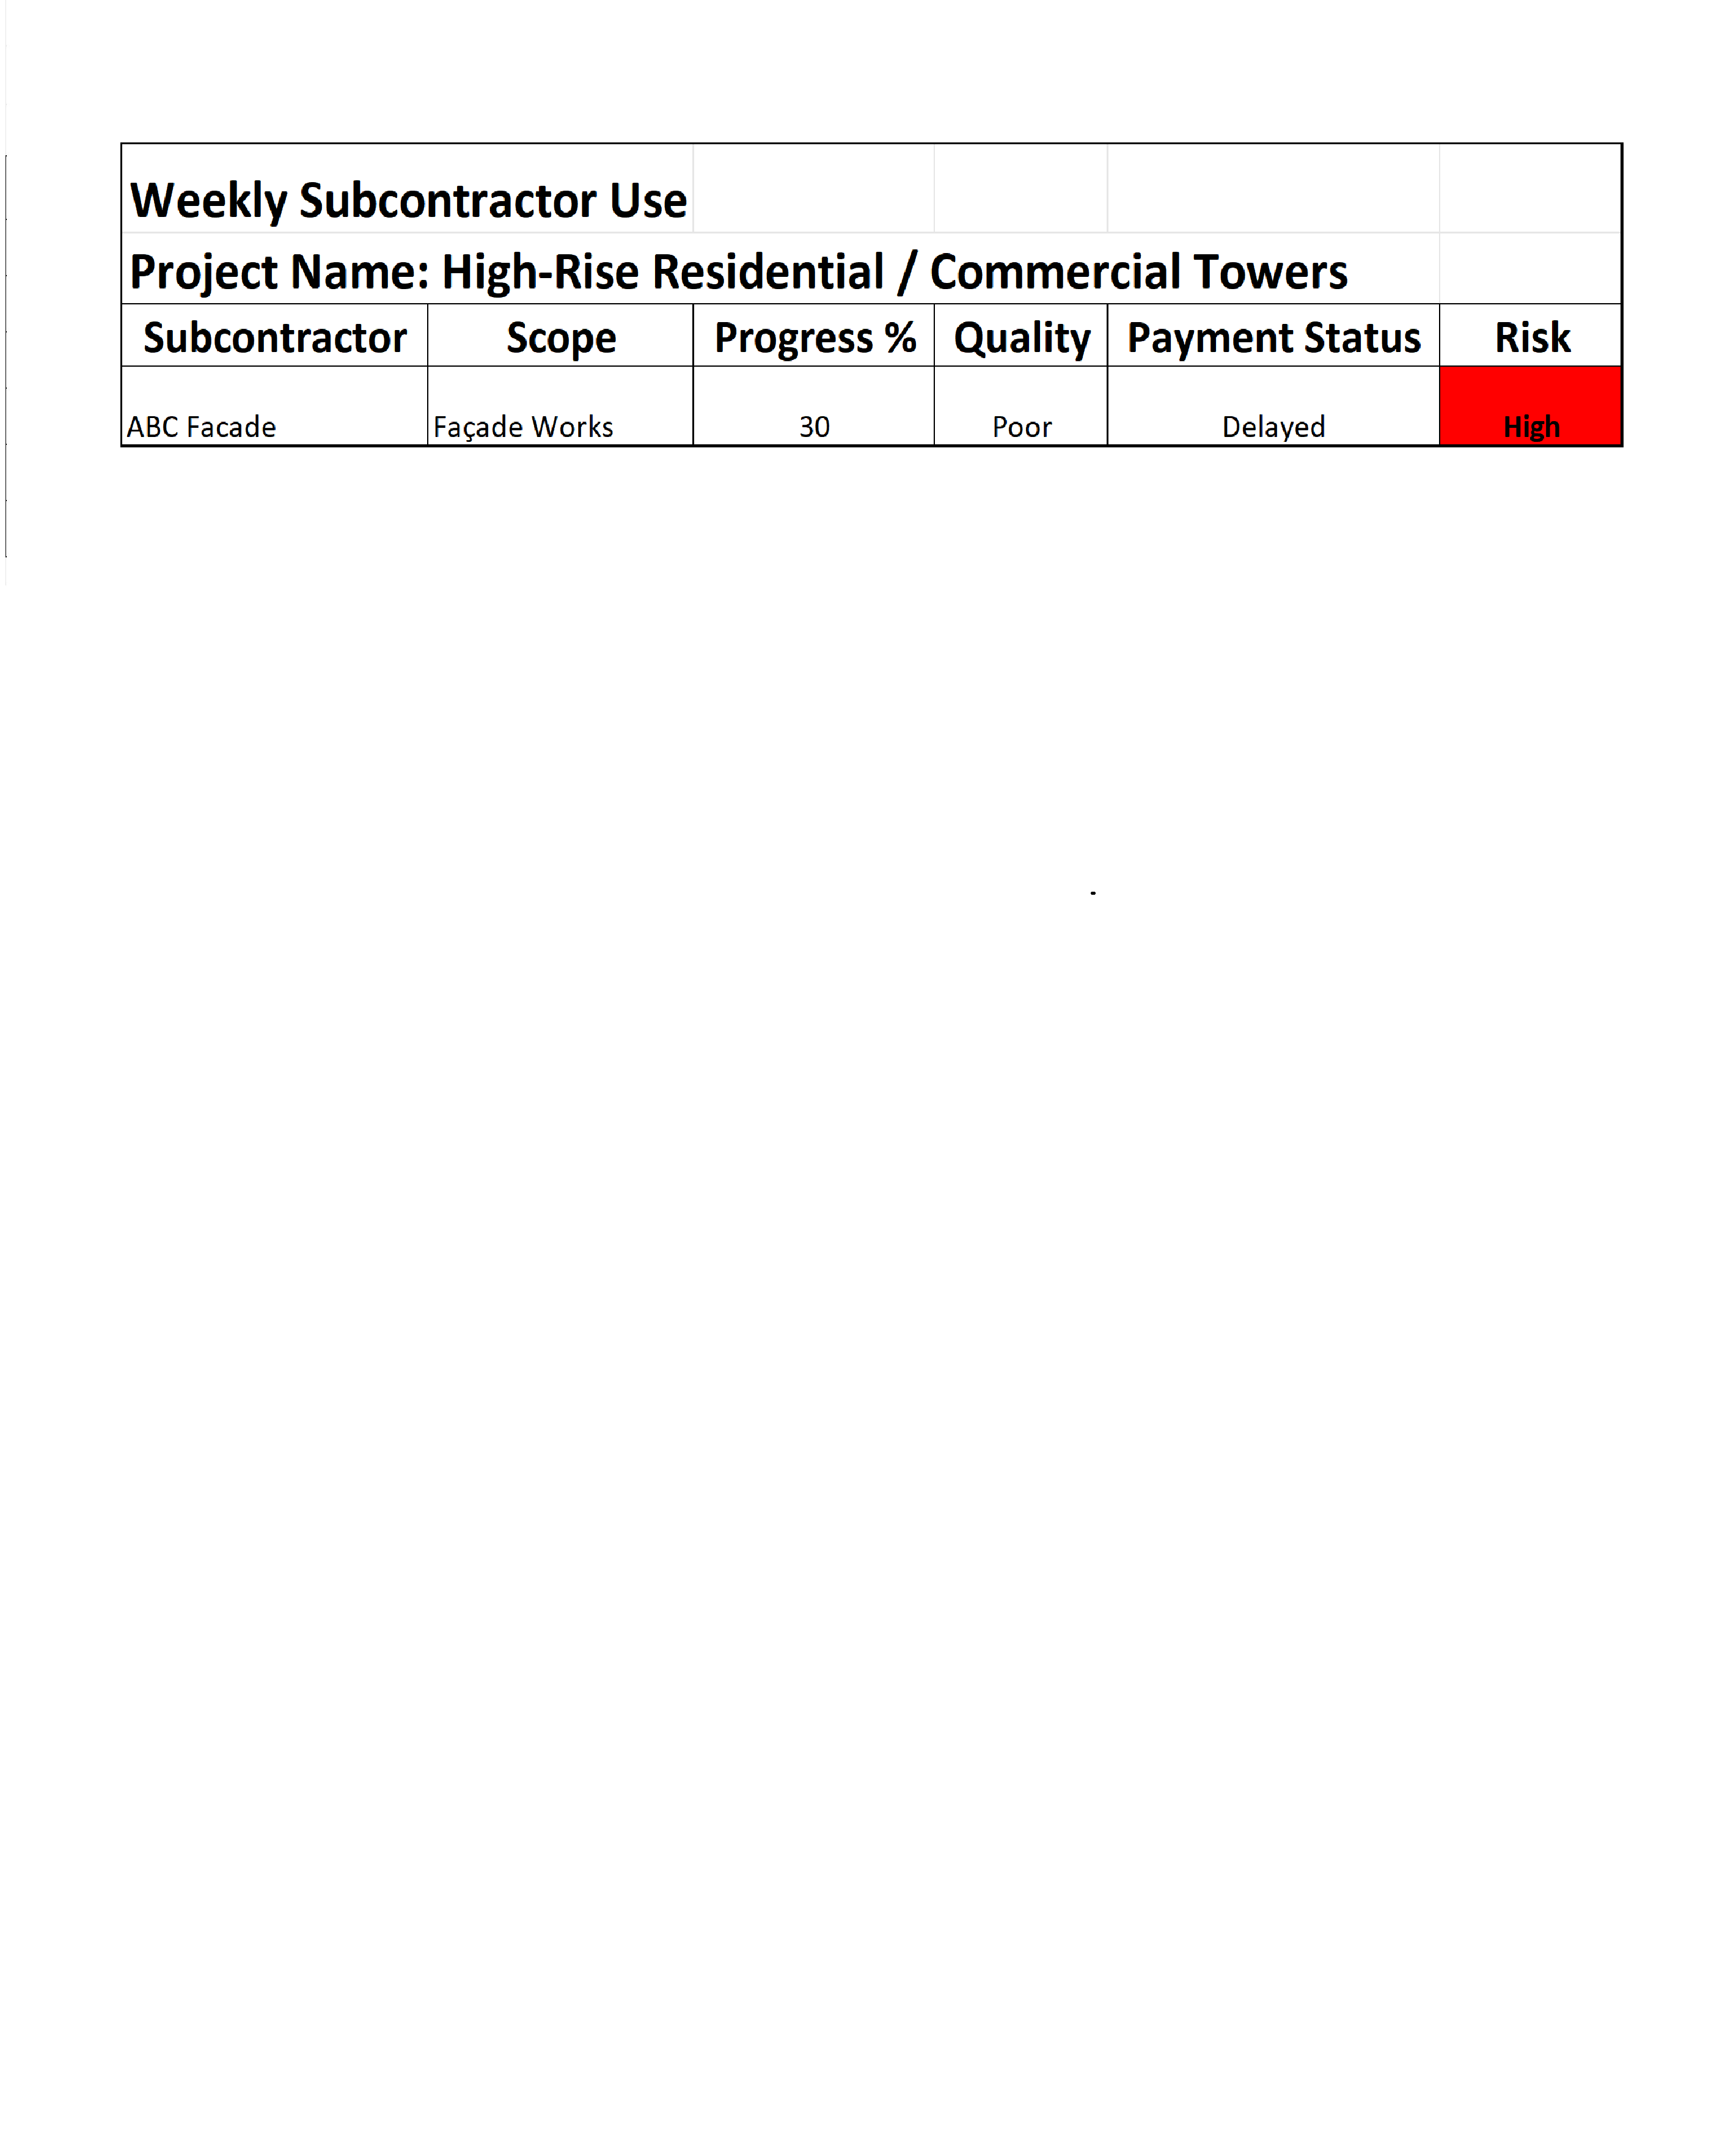
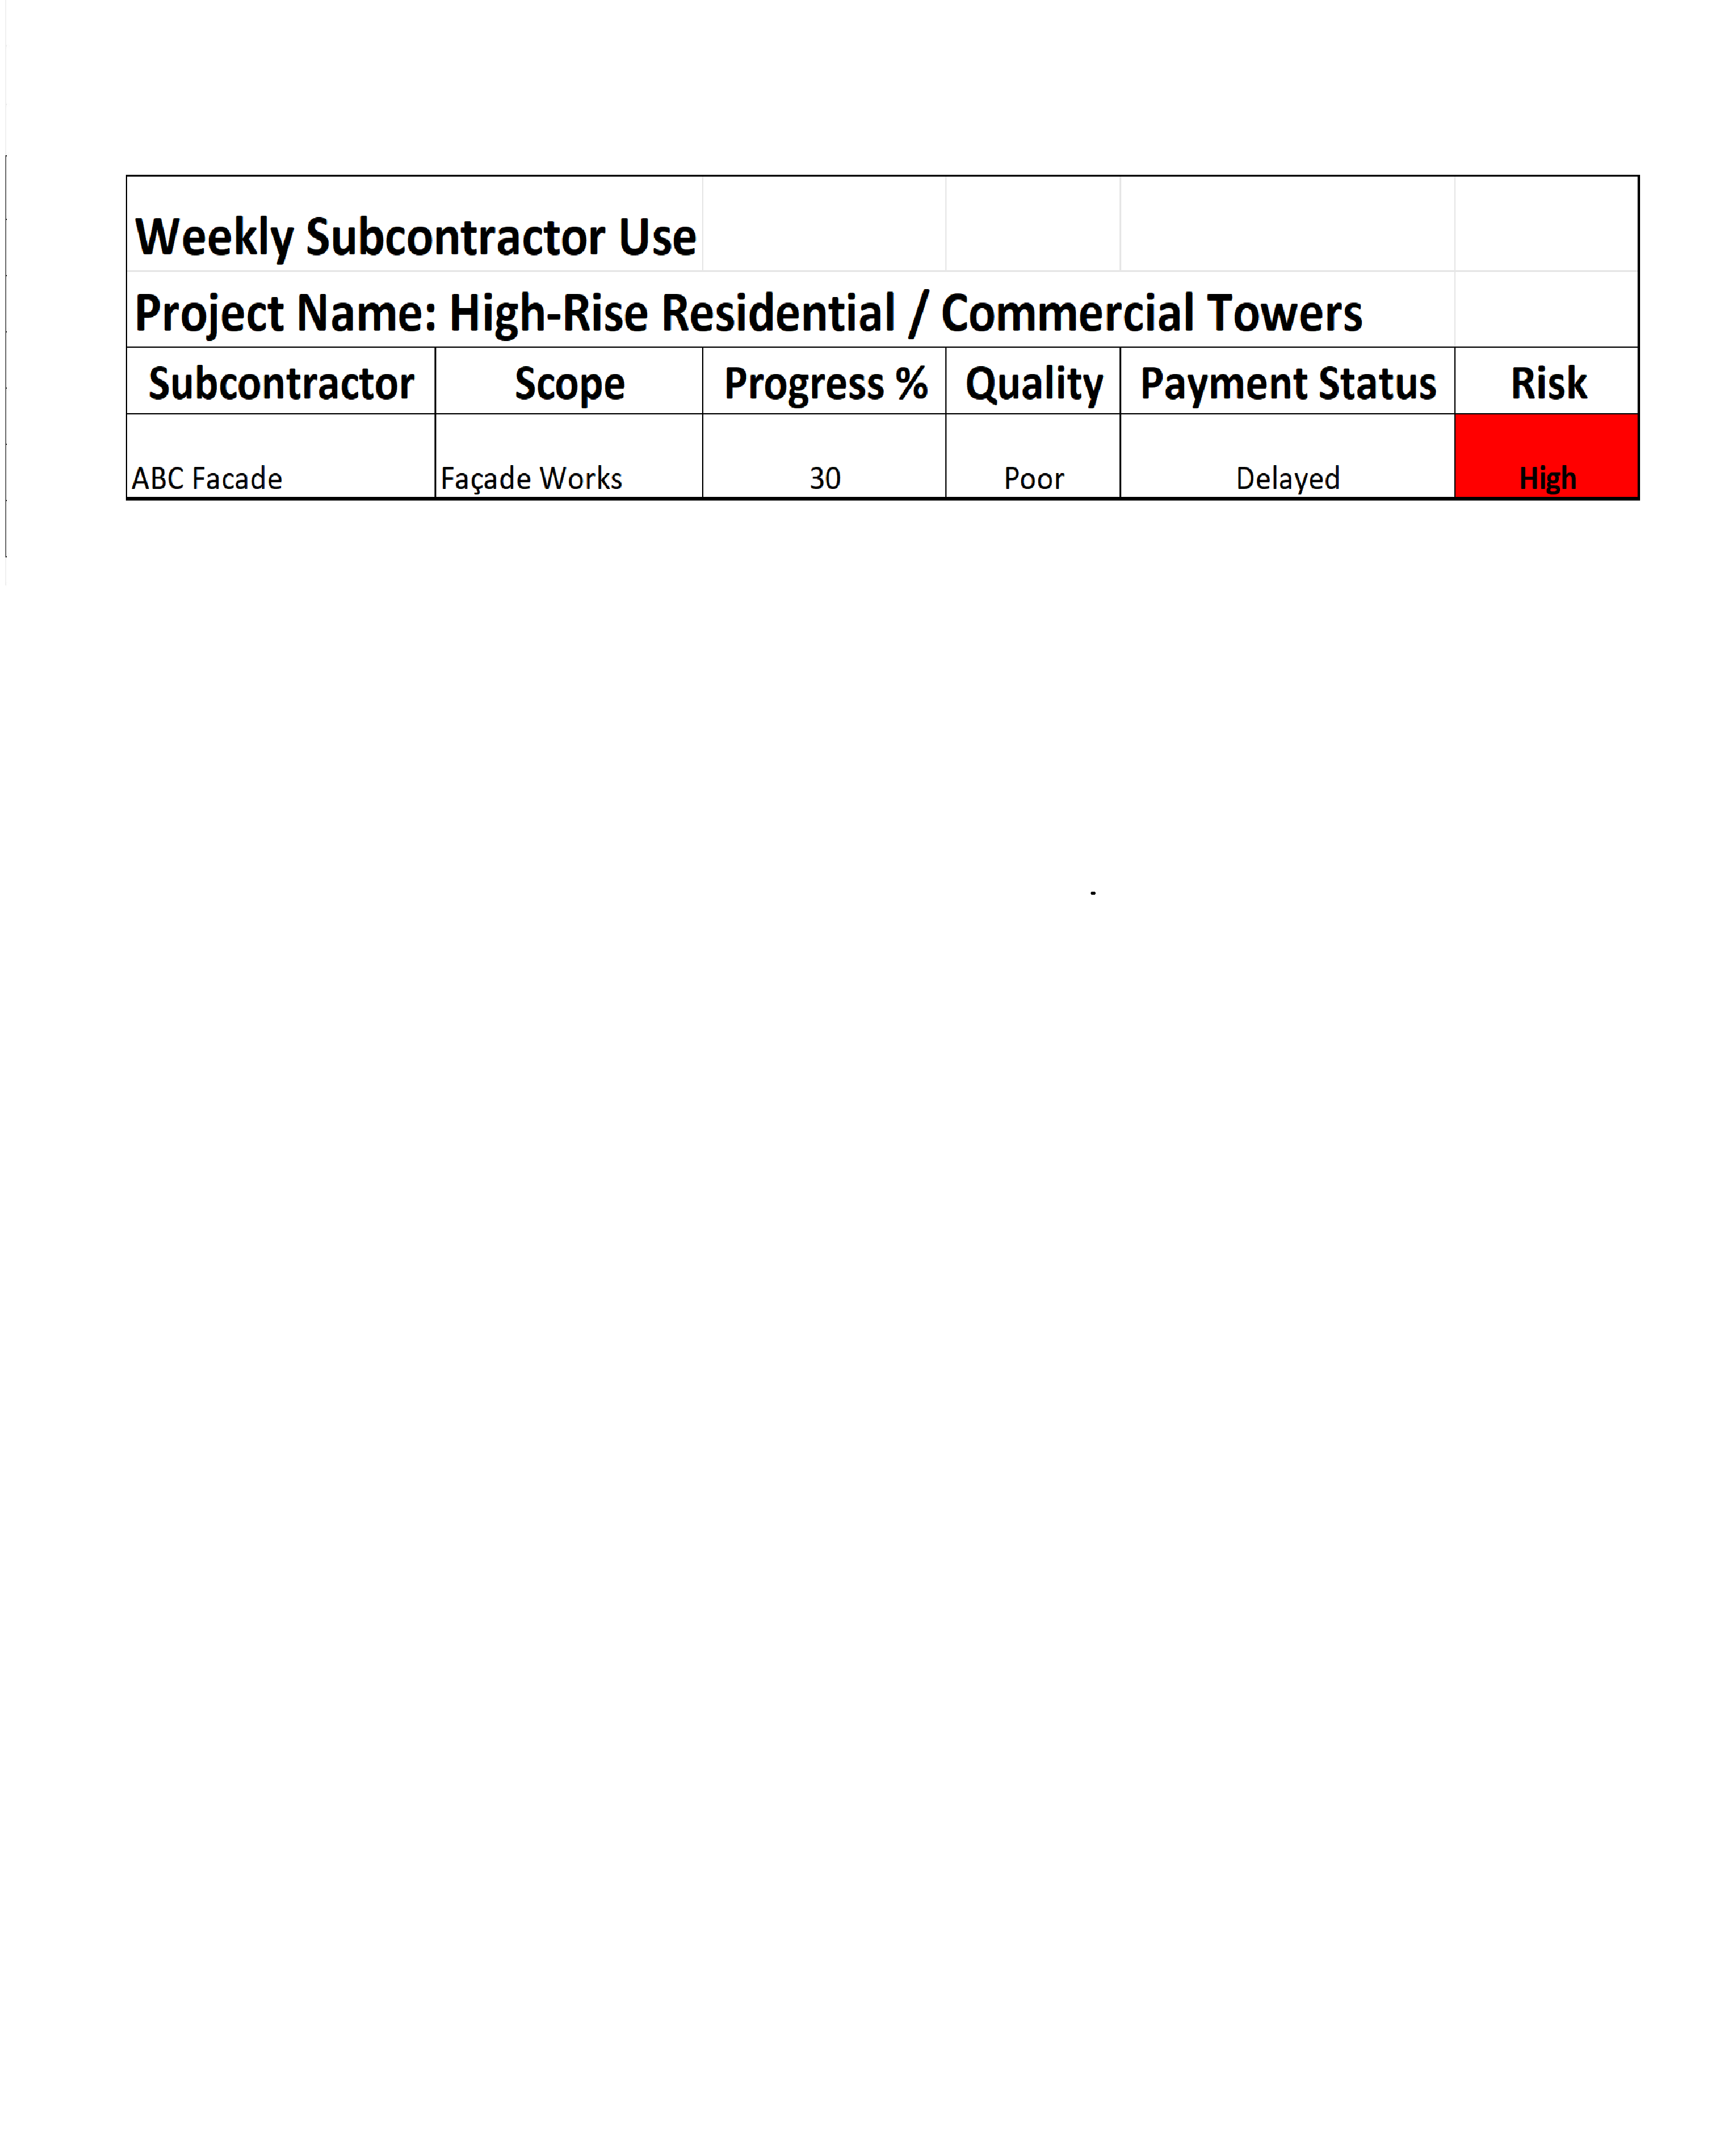
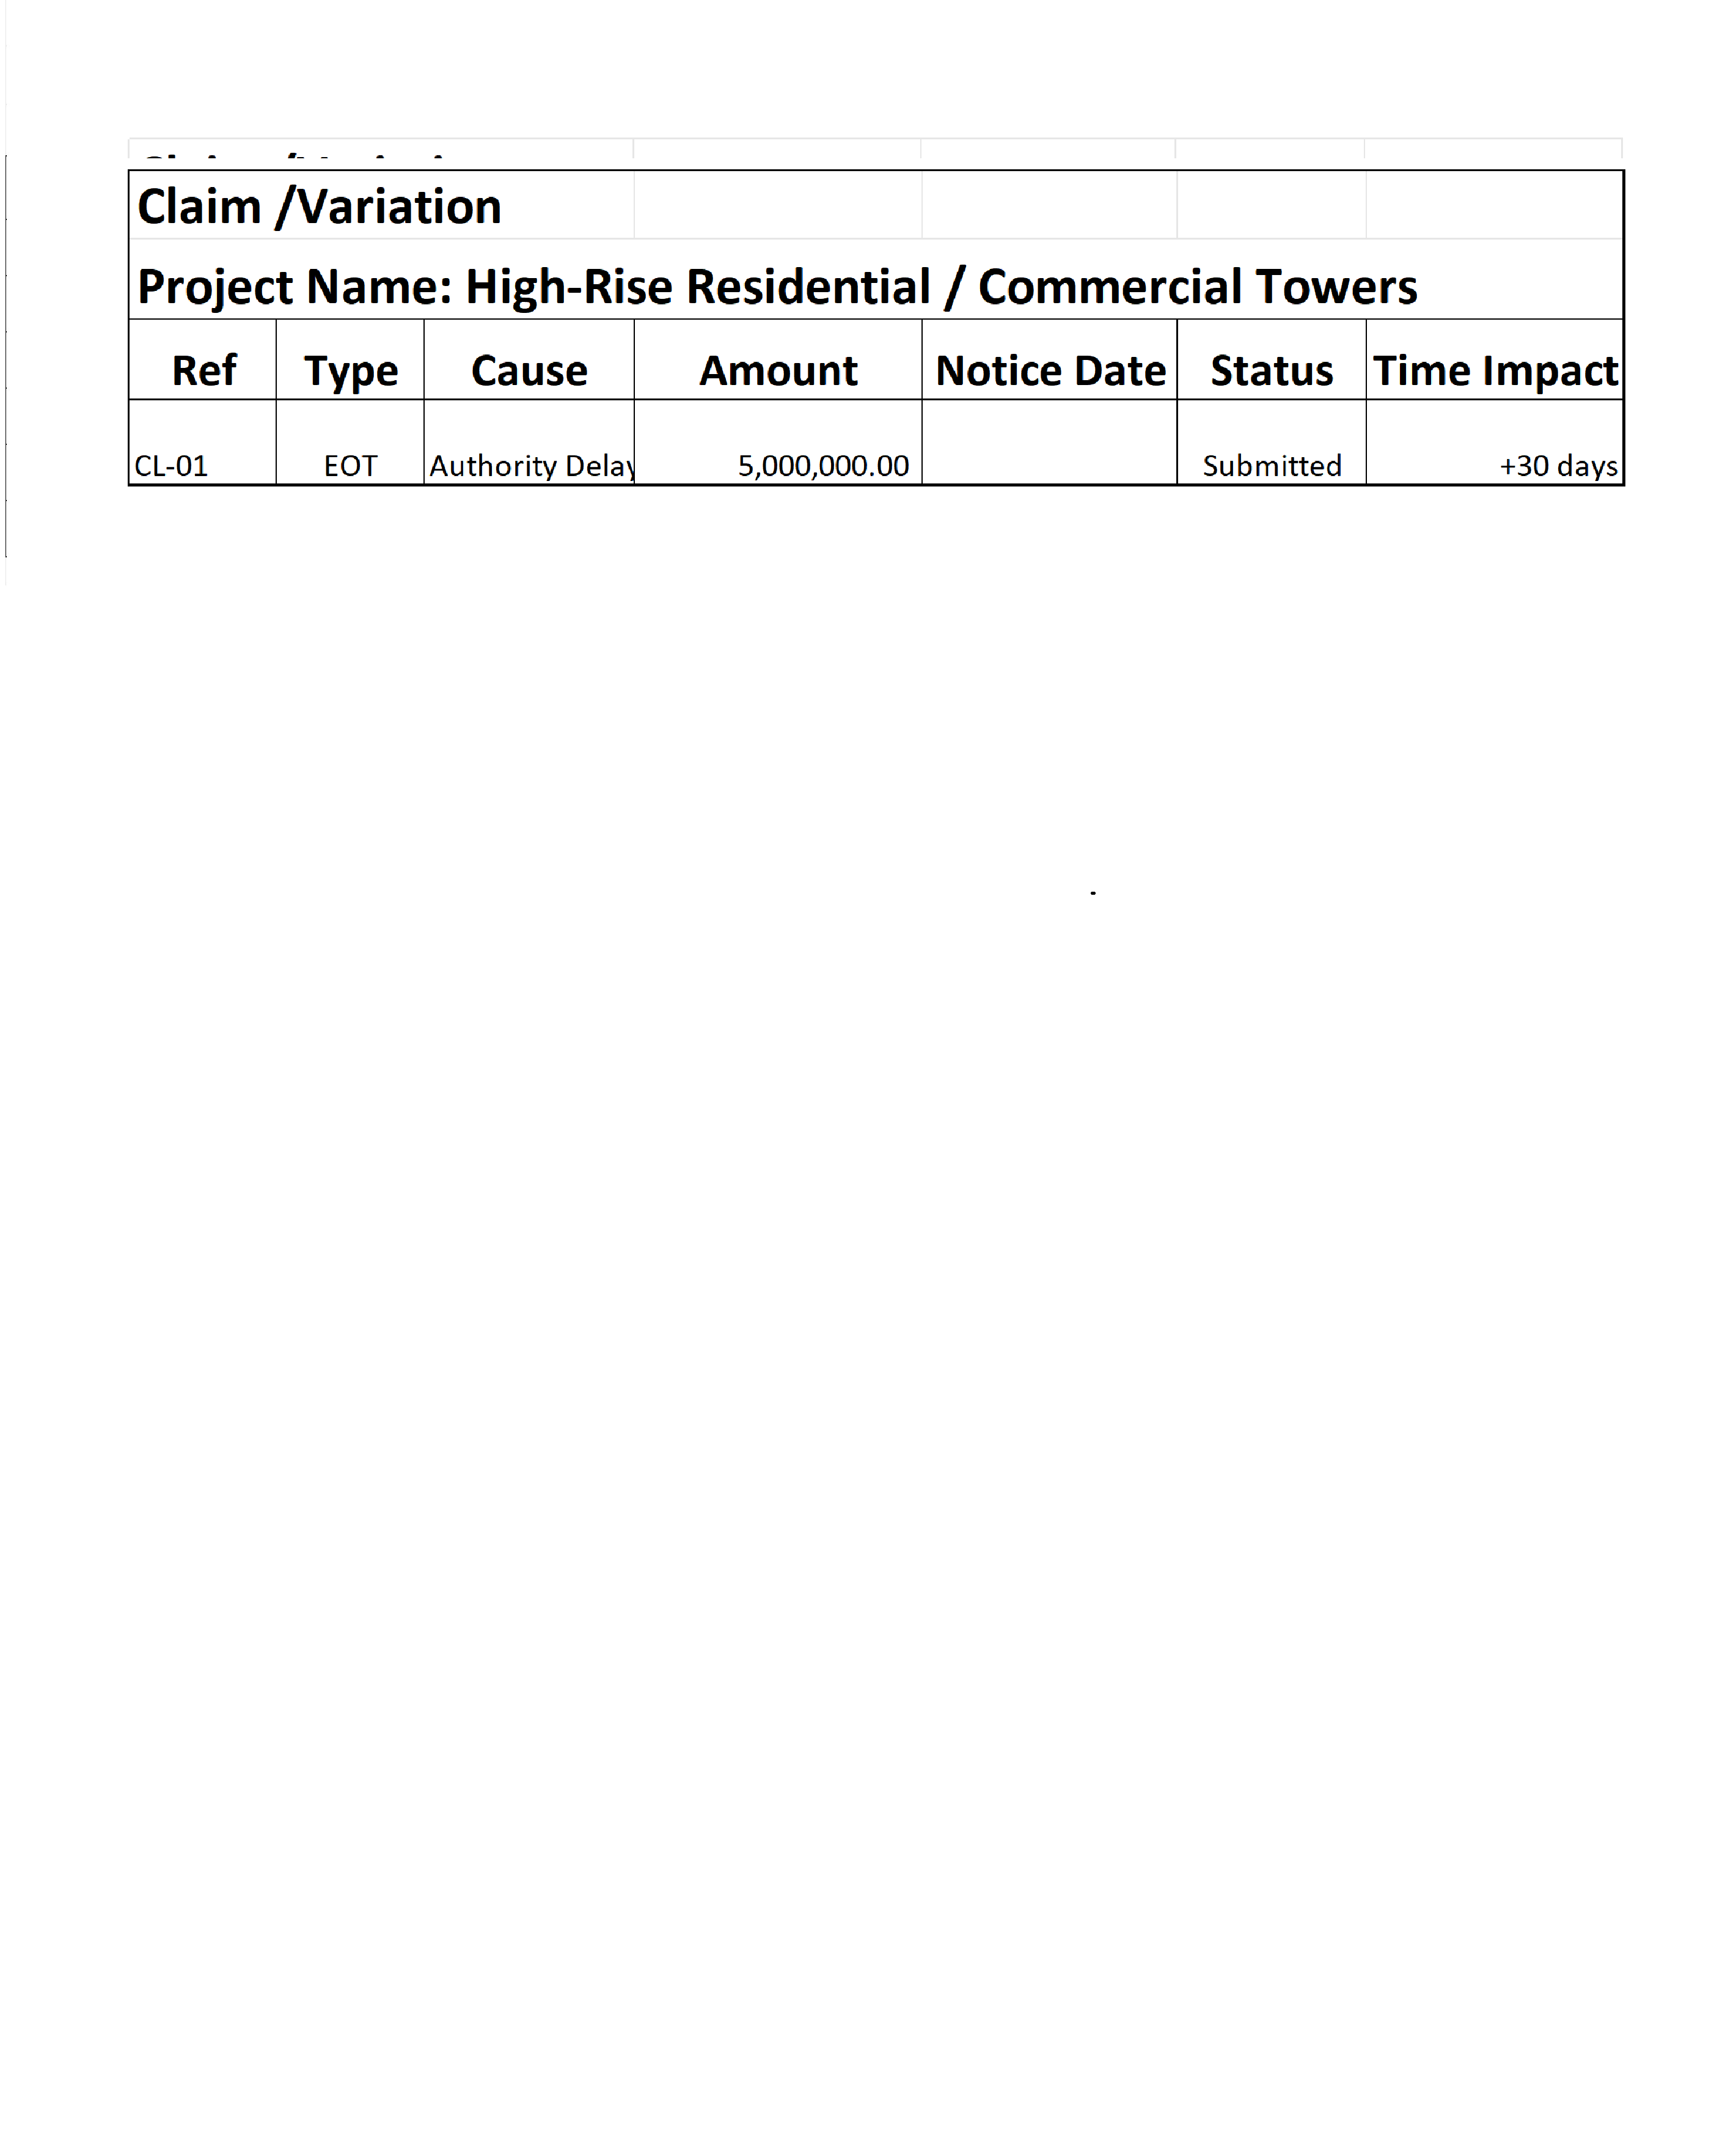
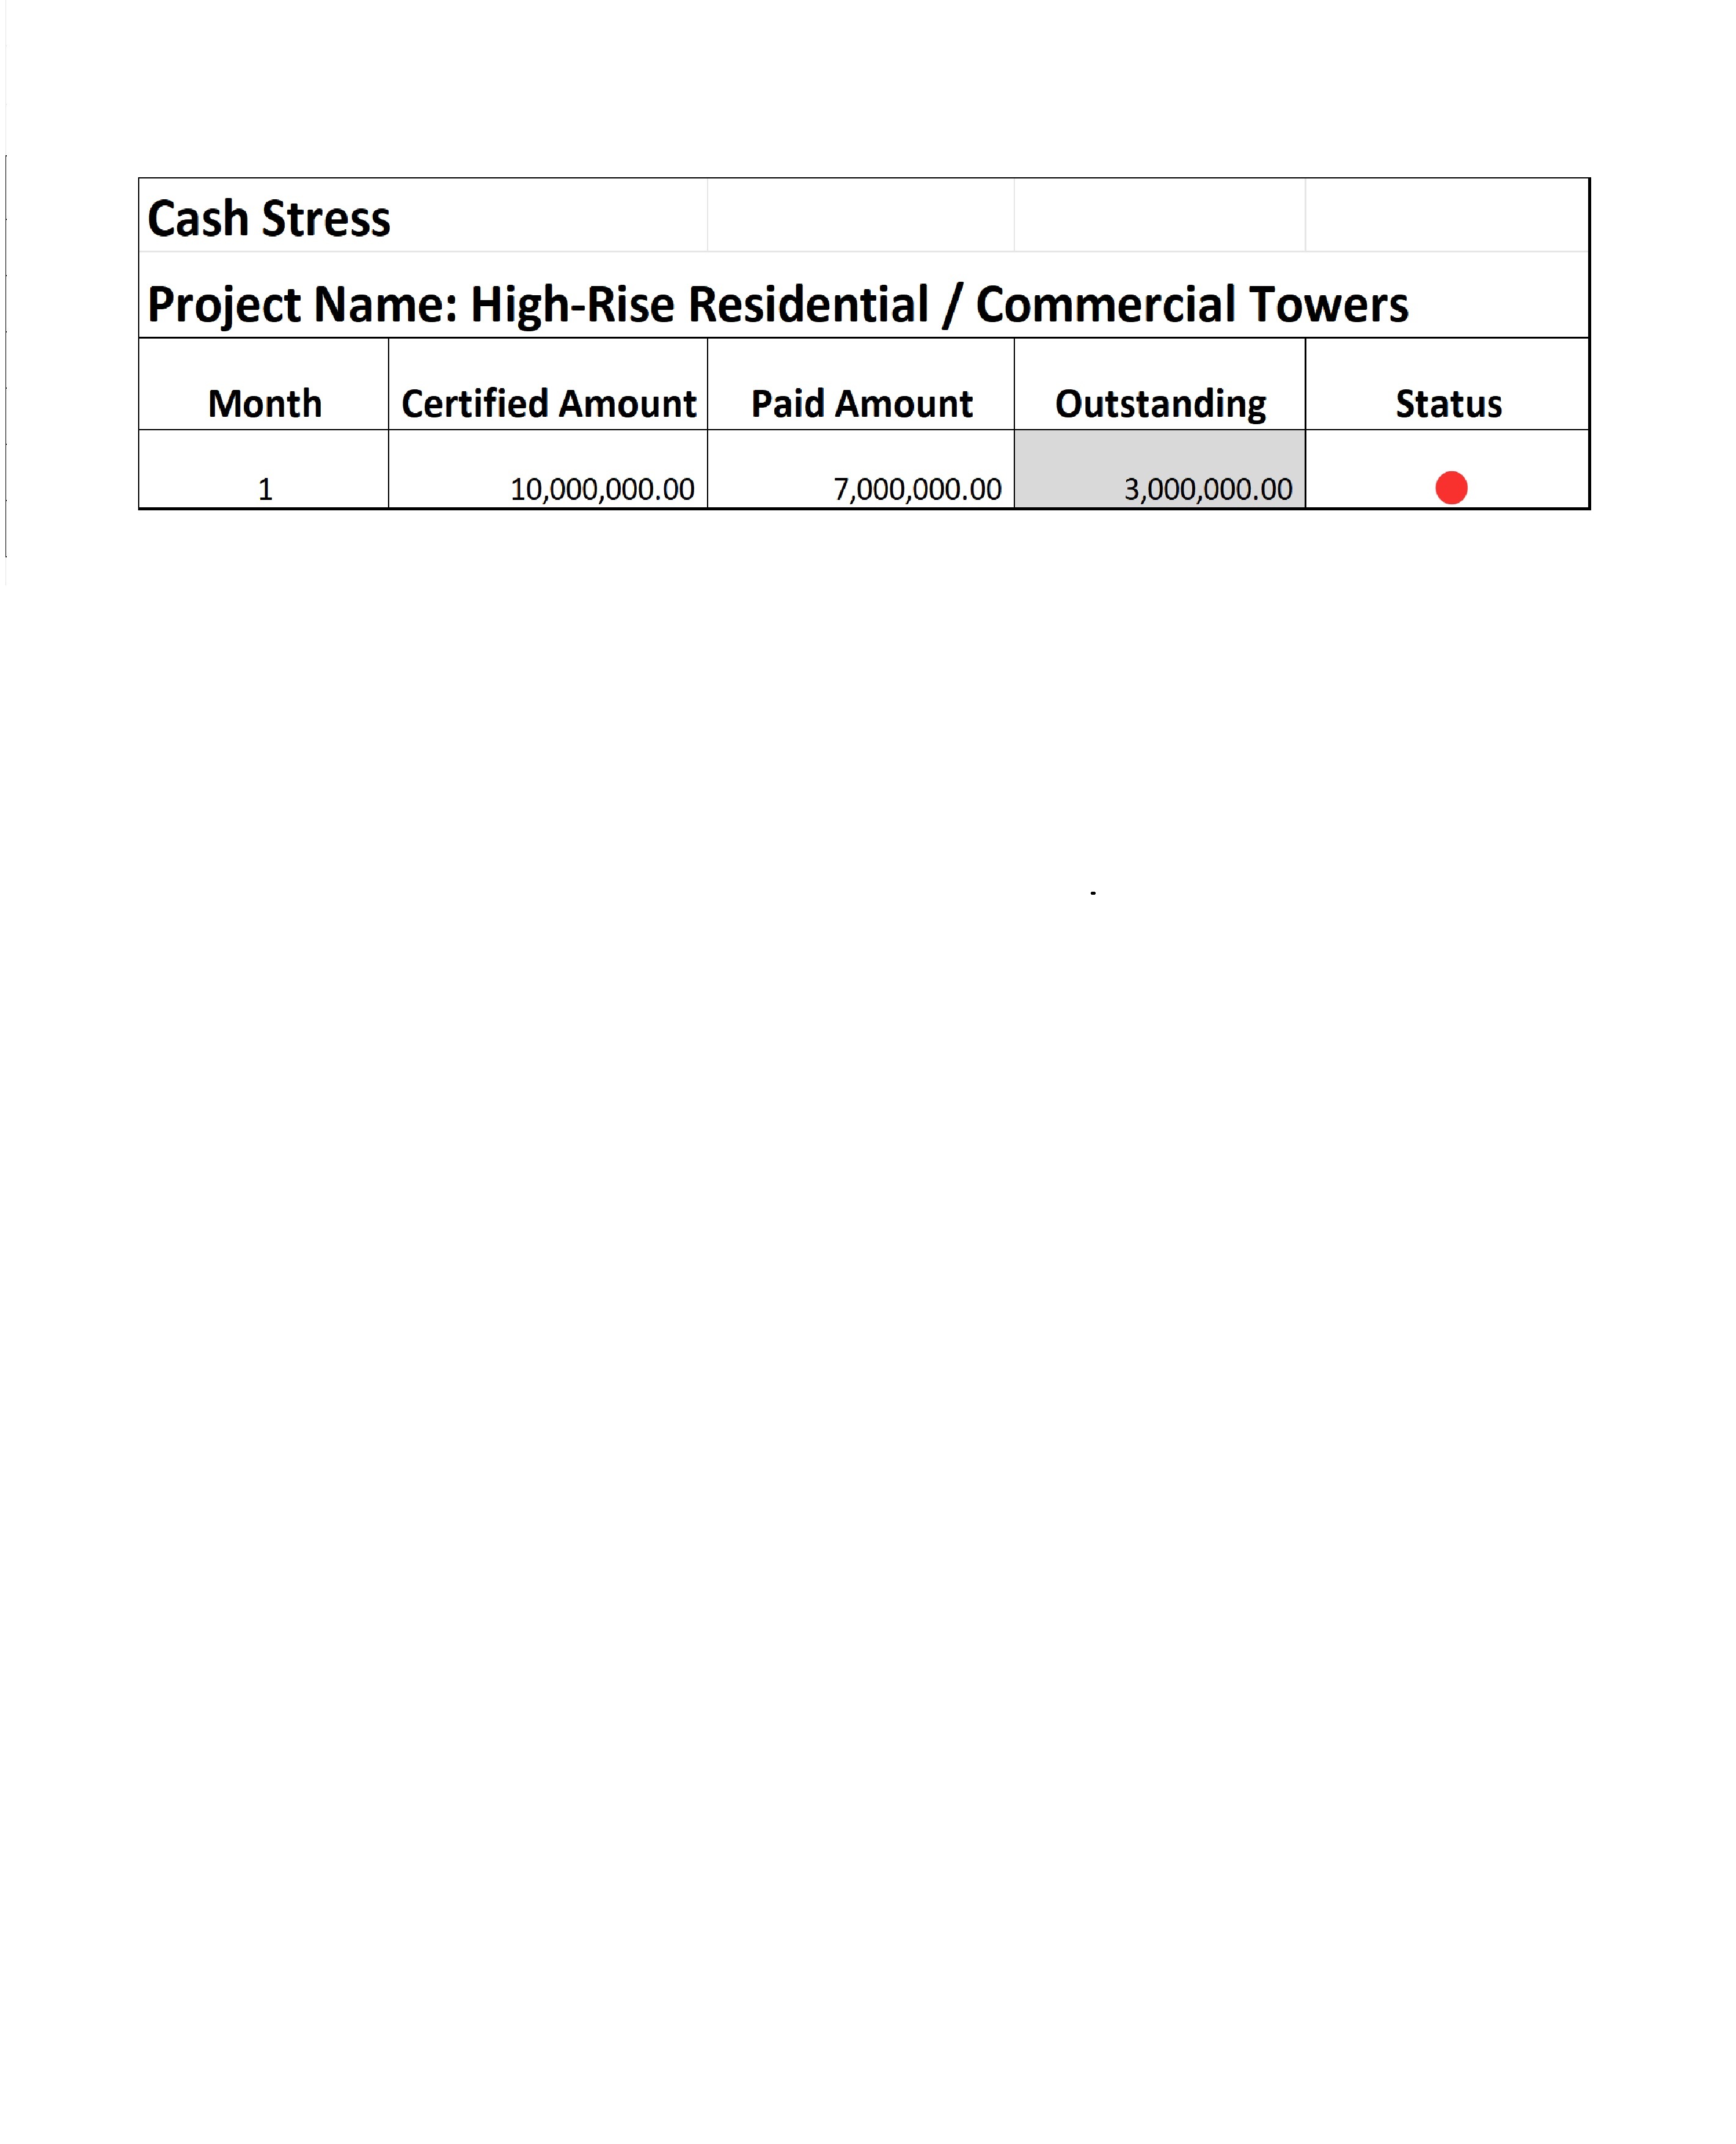
Track key metrics like schedule, cost, risk, and quality
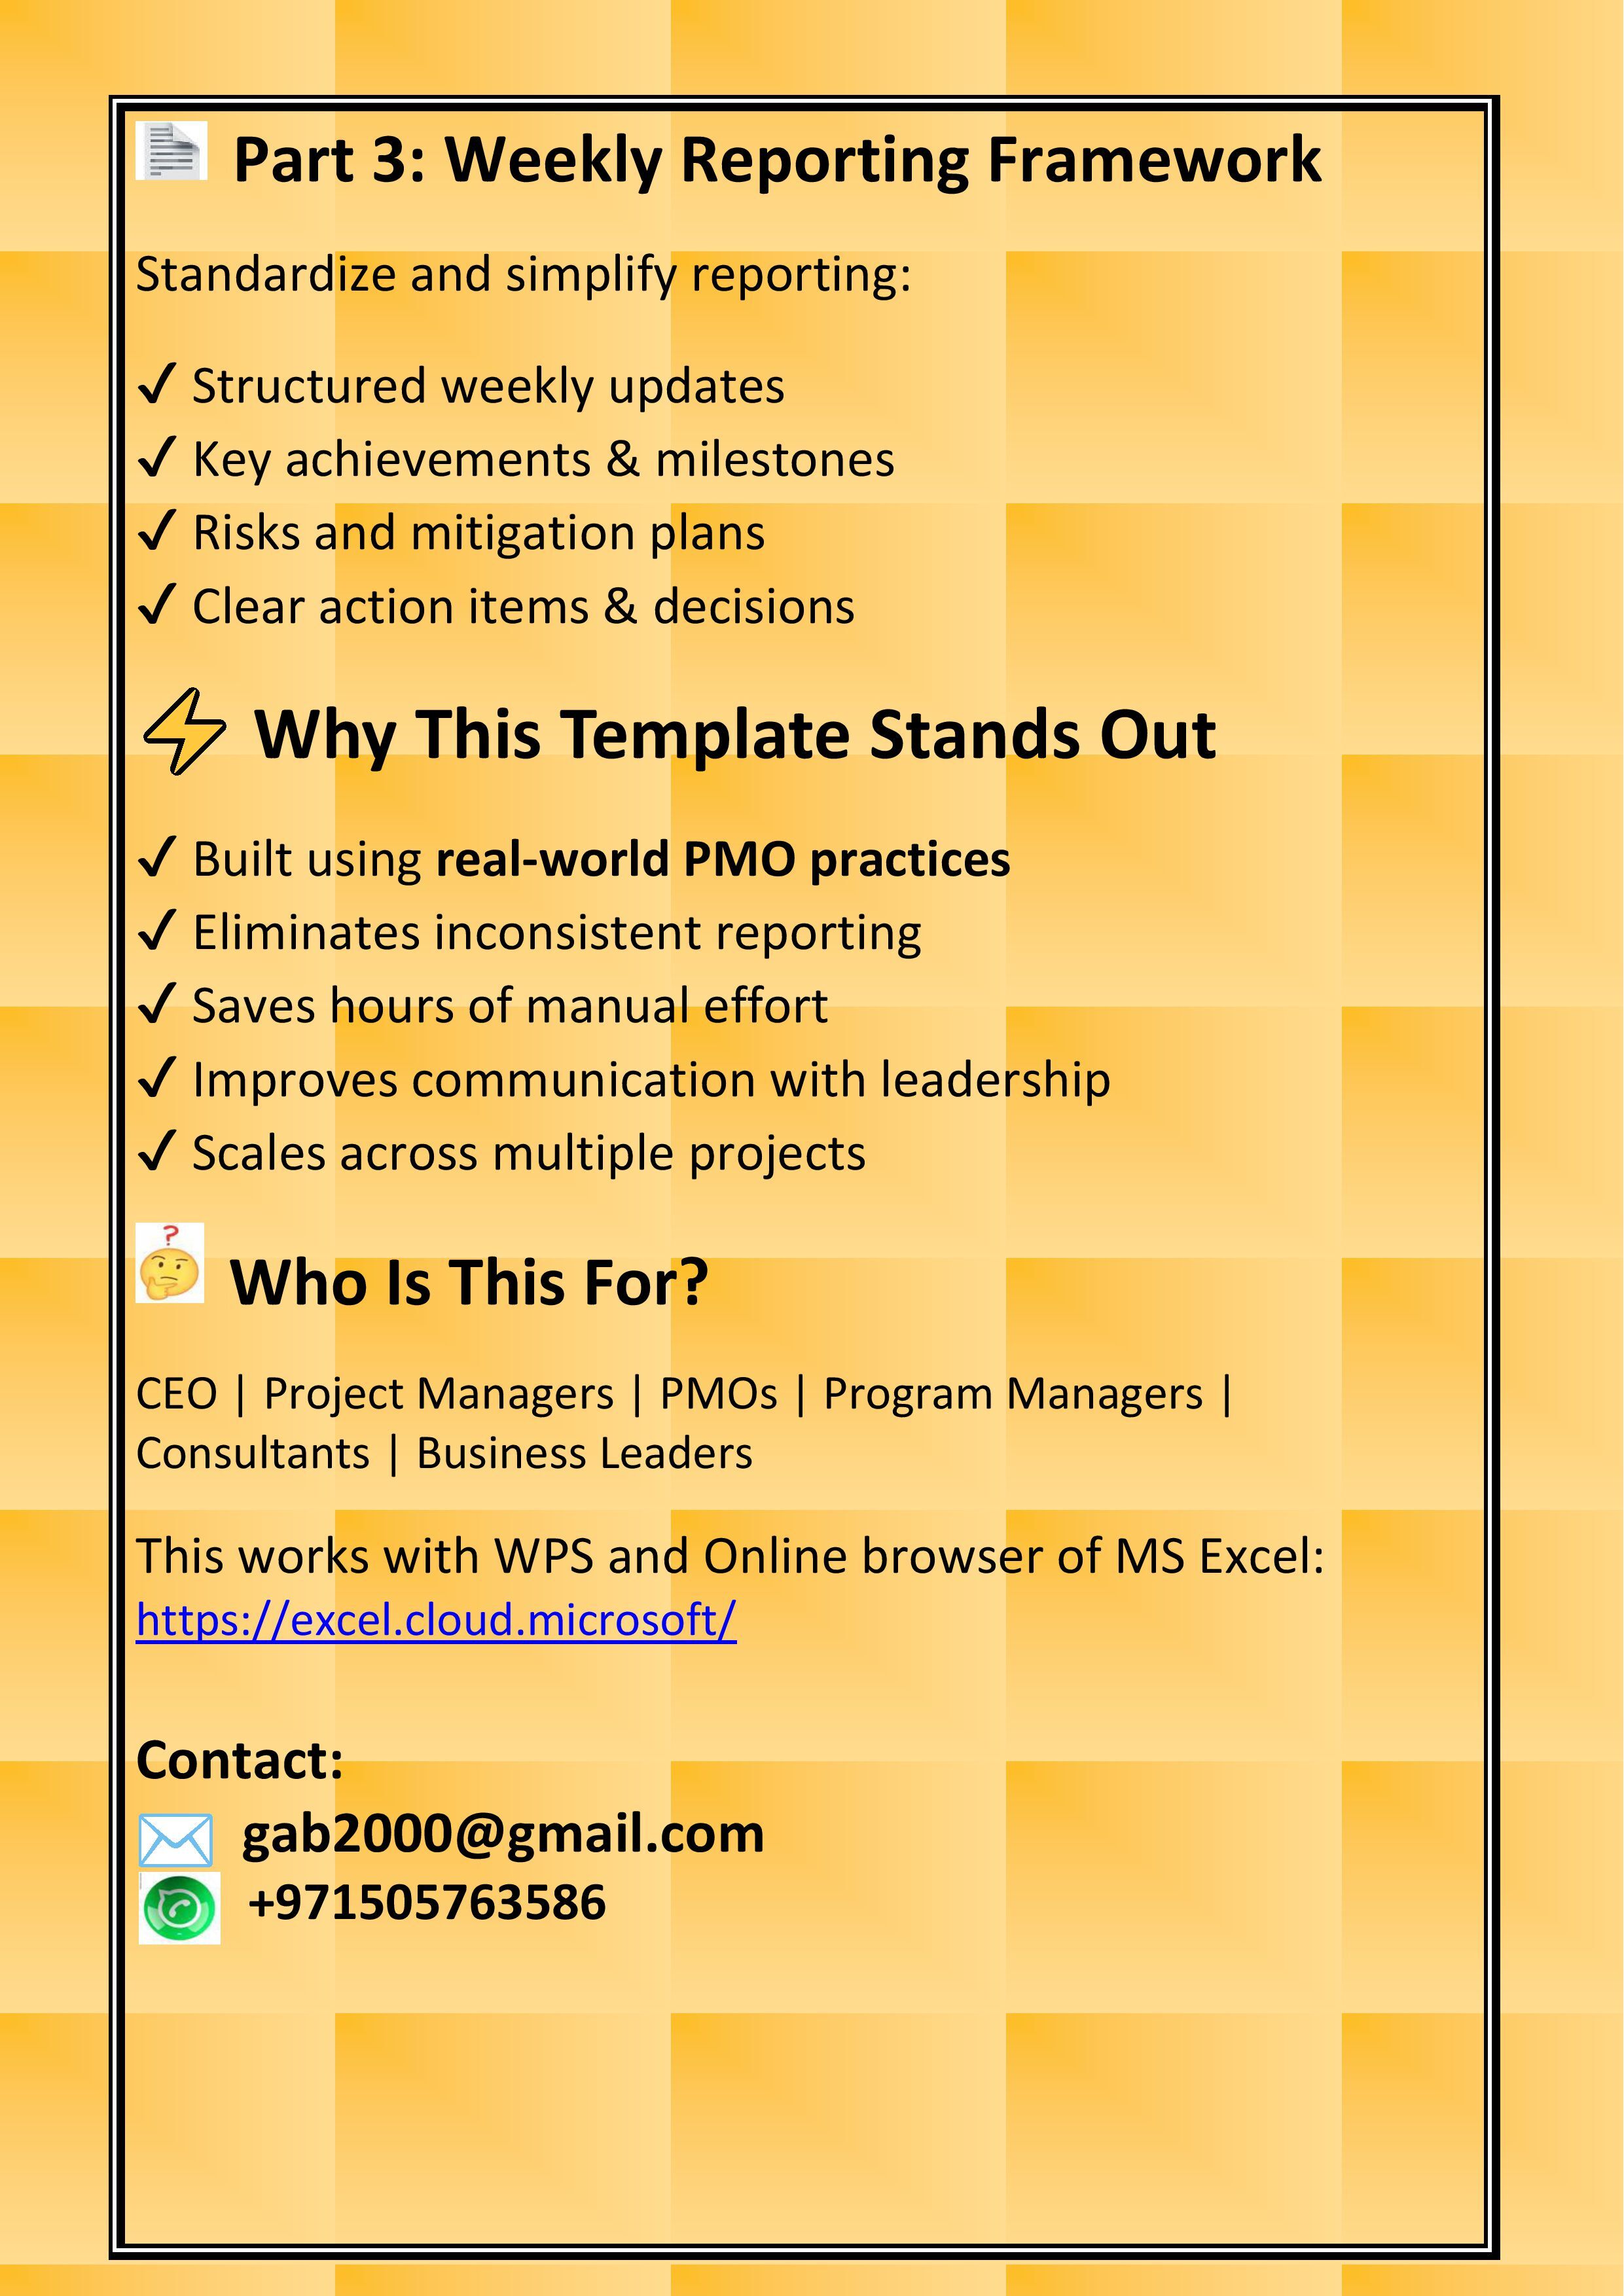
Standardize project governance and reporting practices
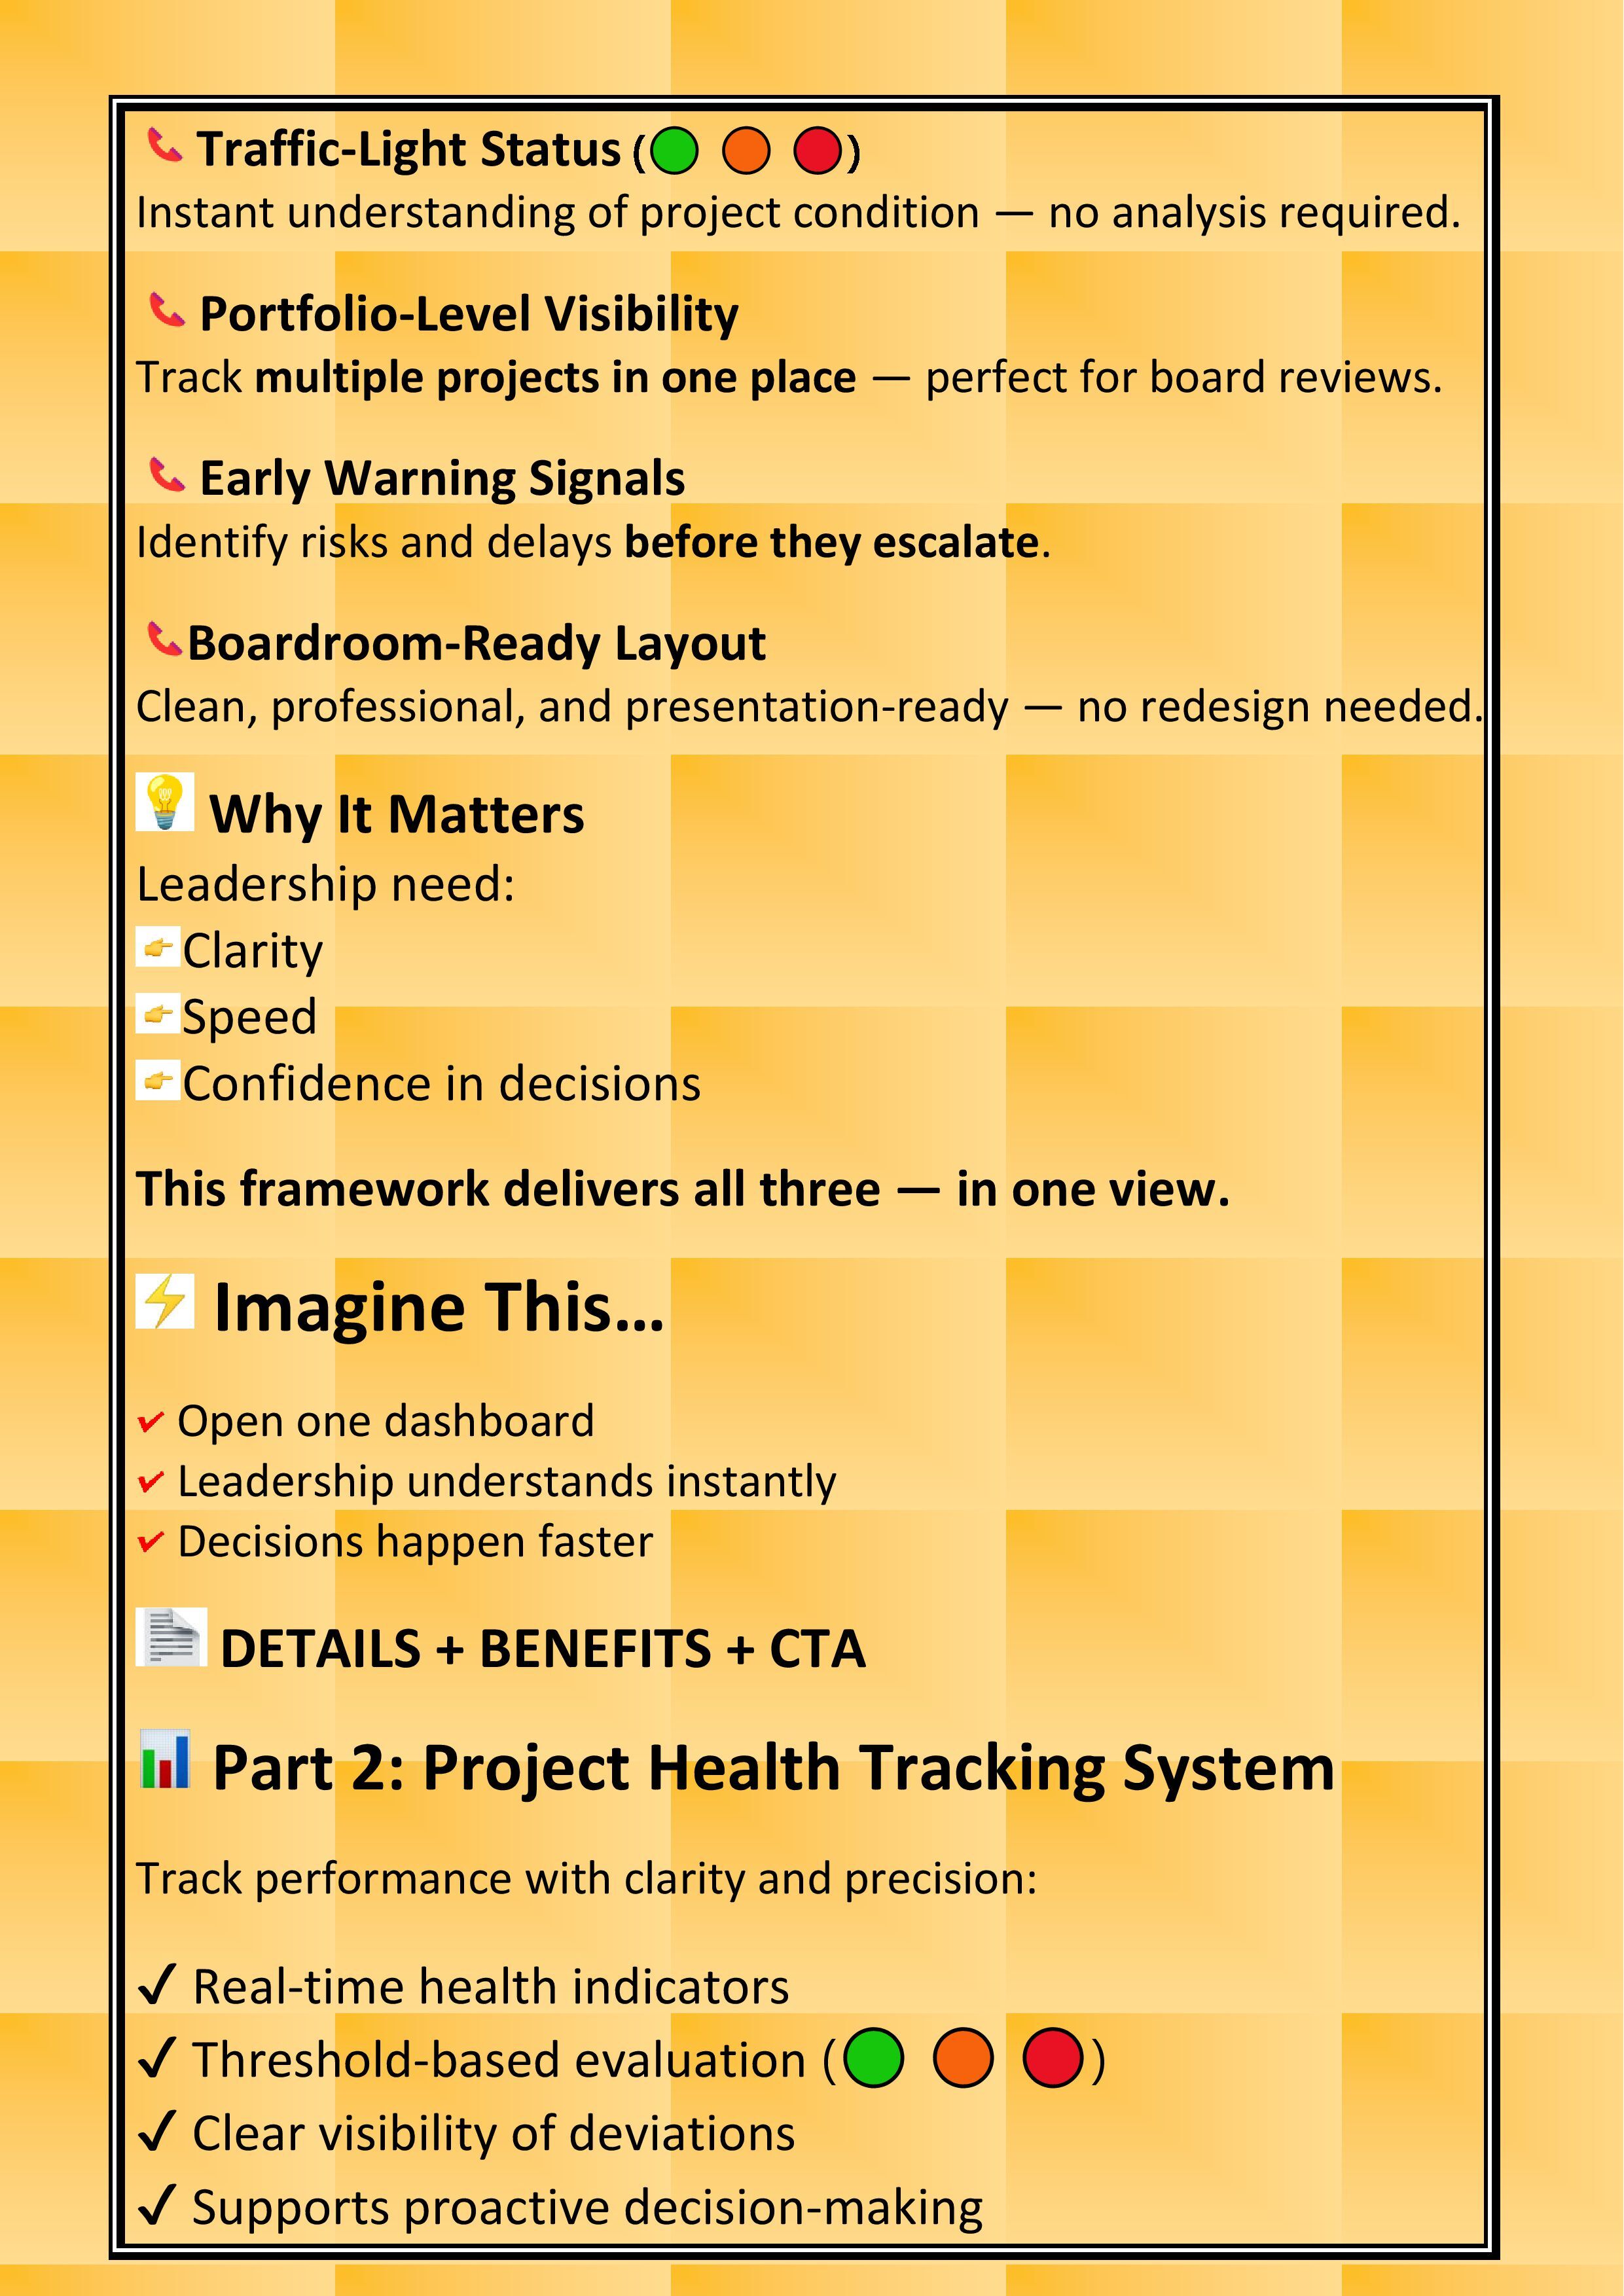
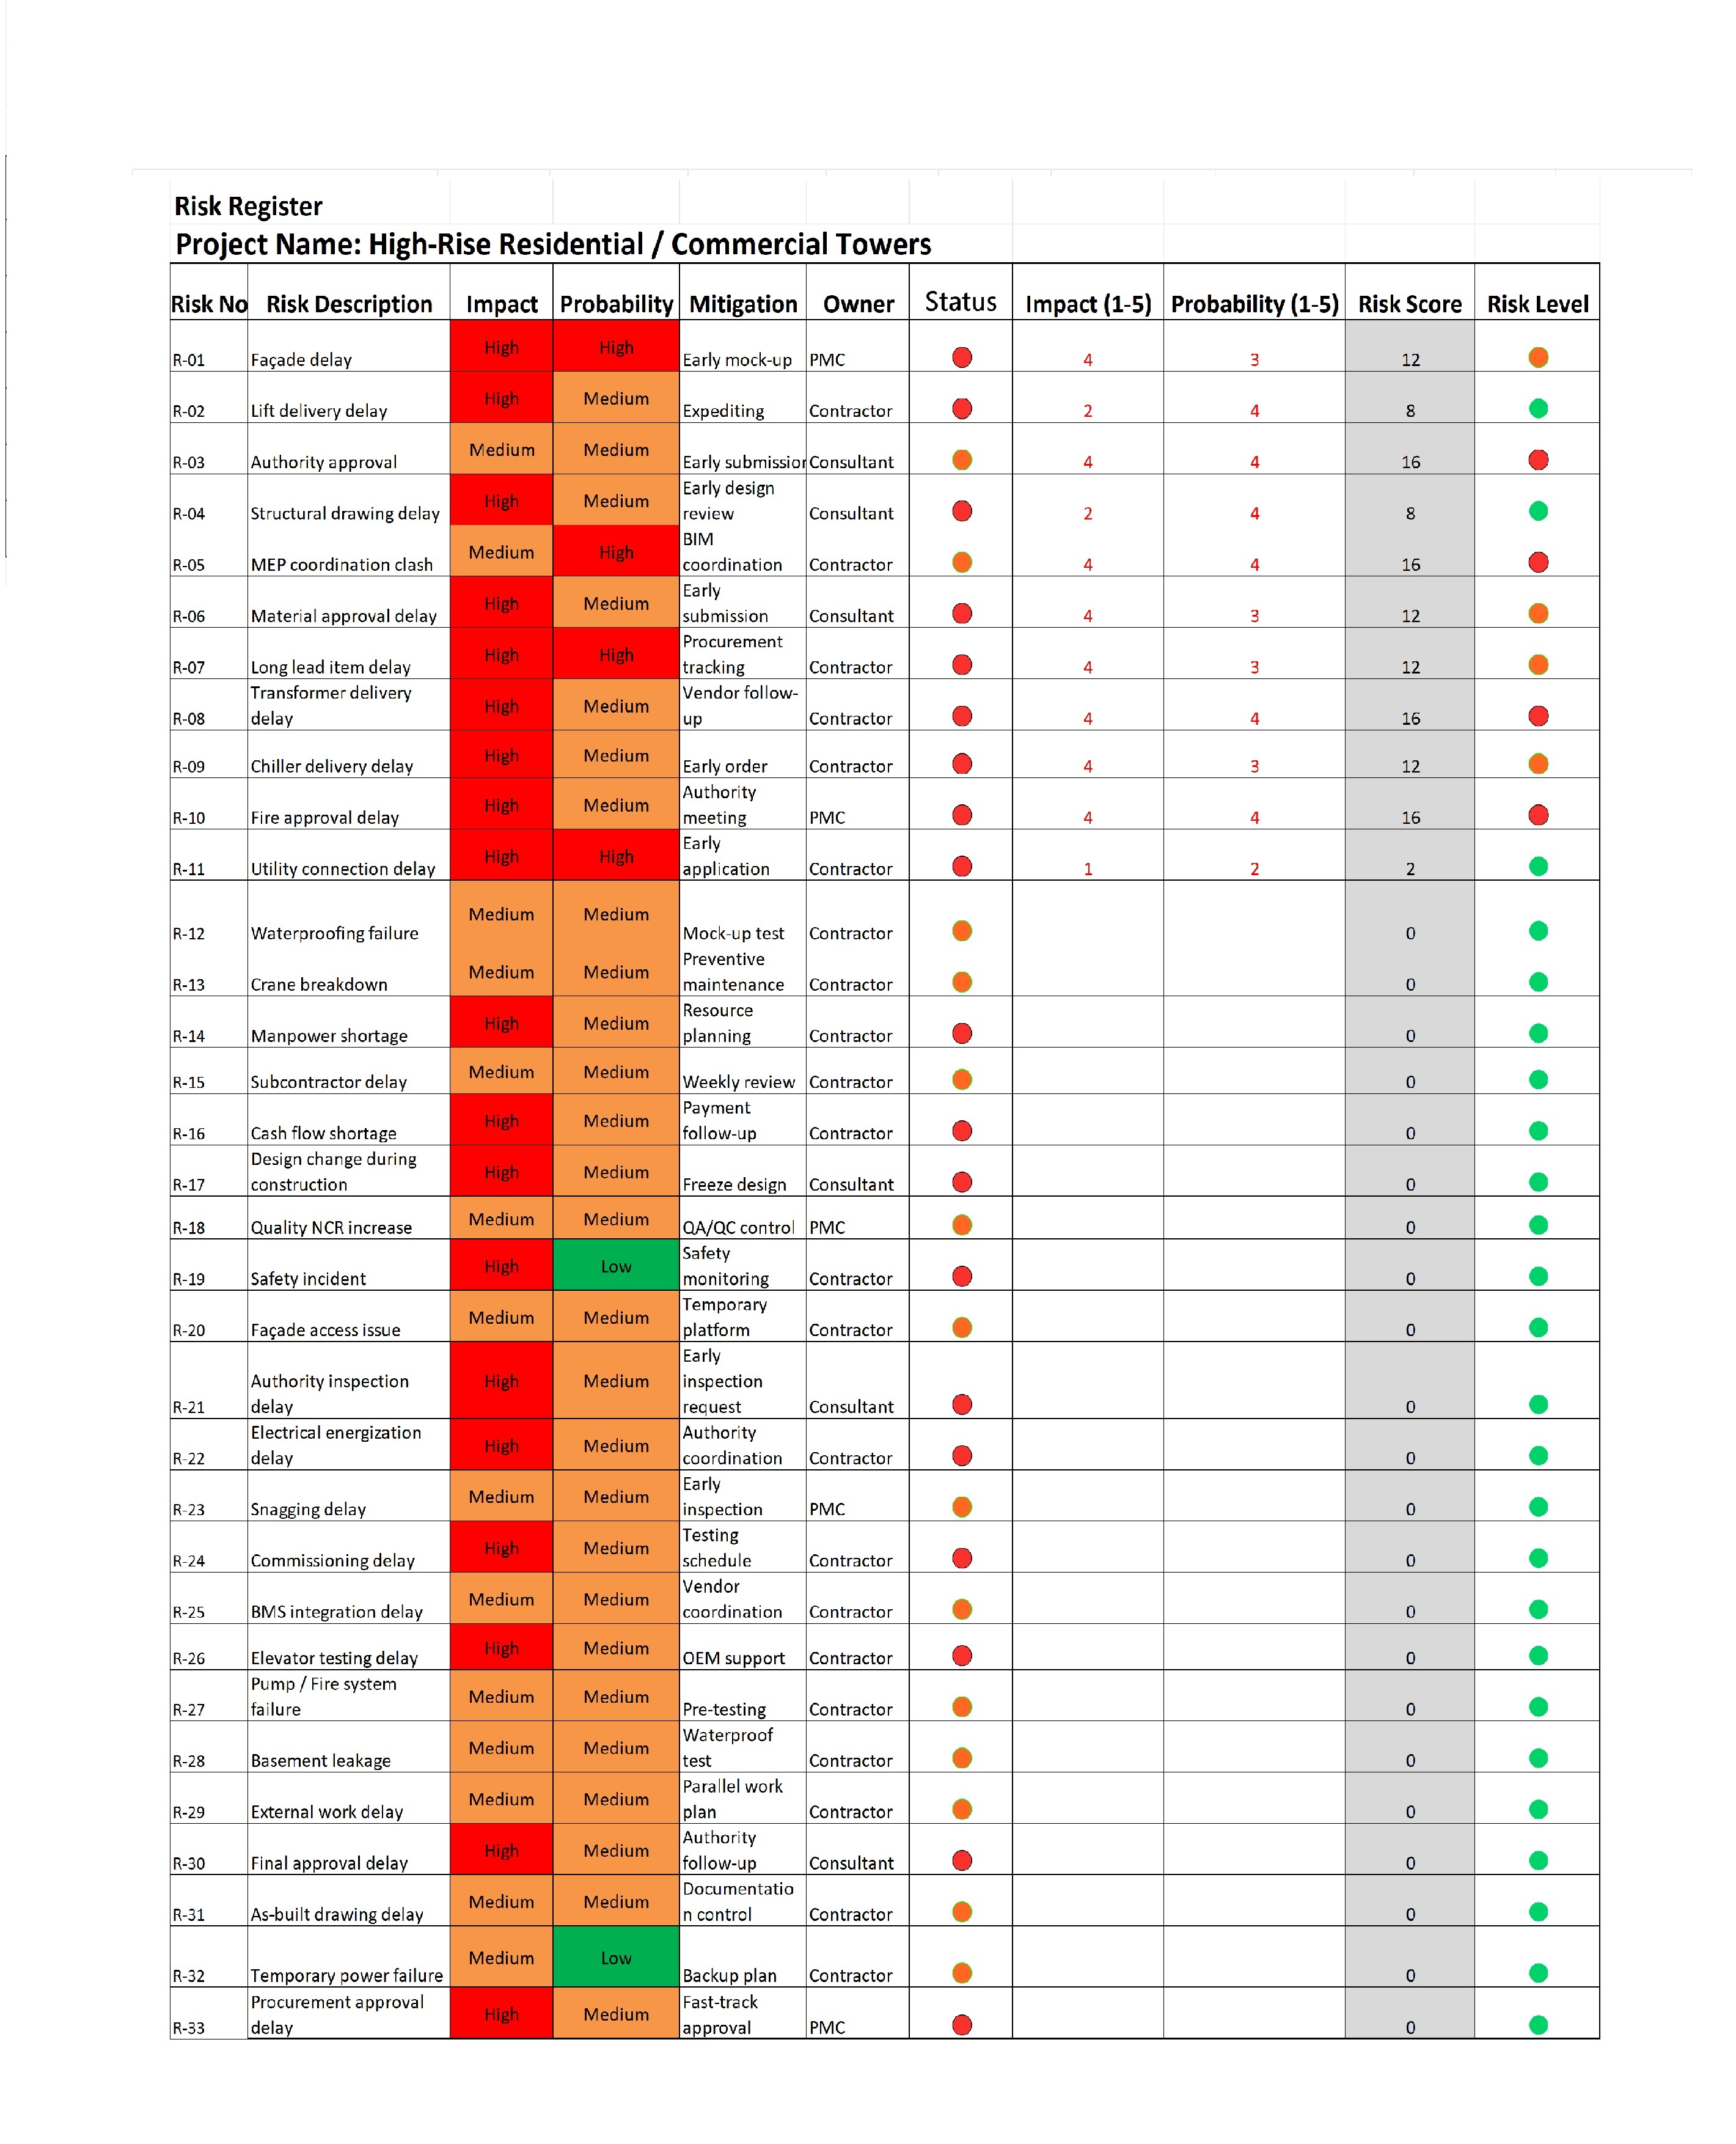
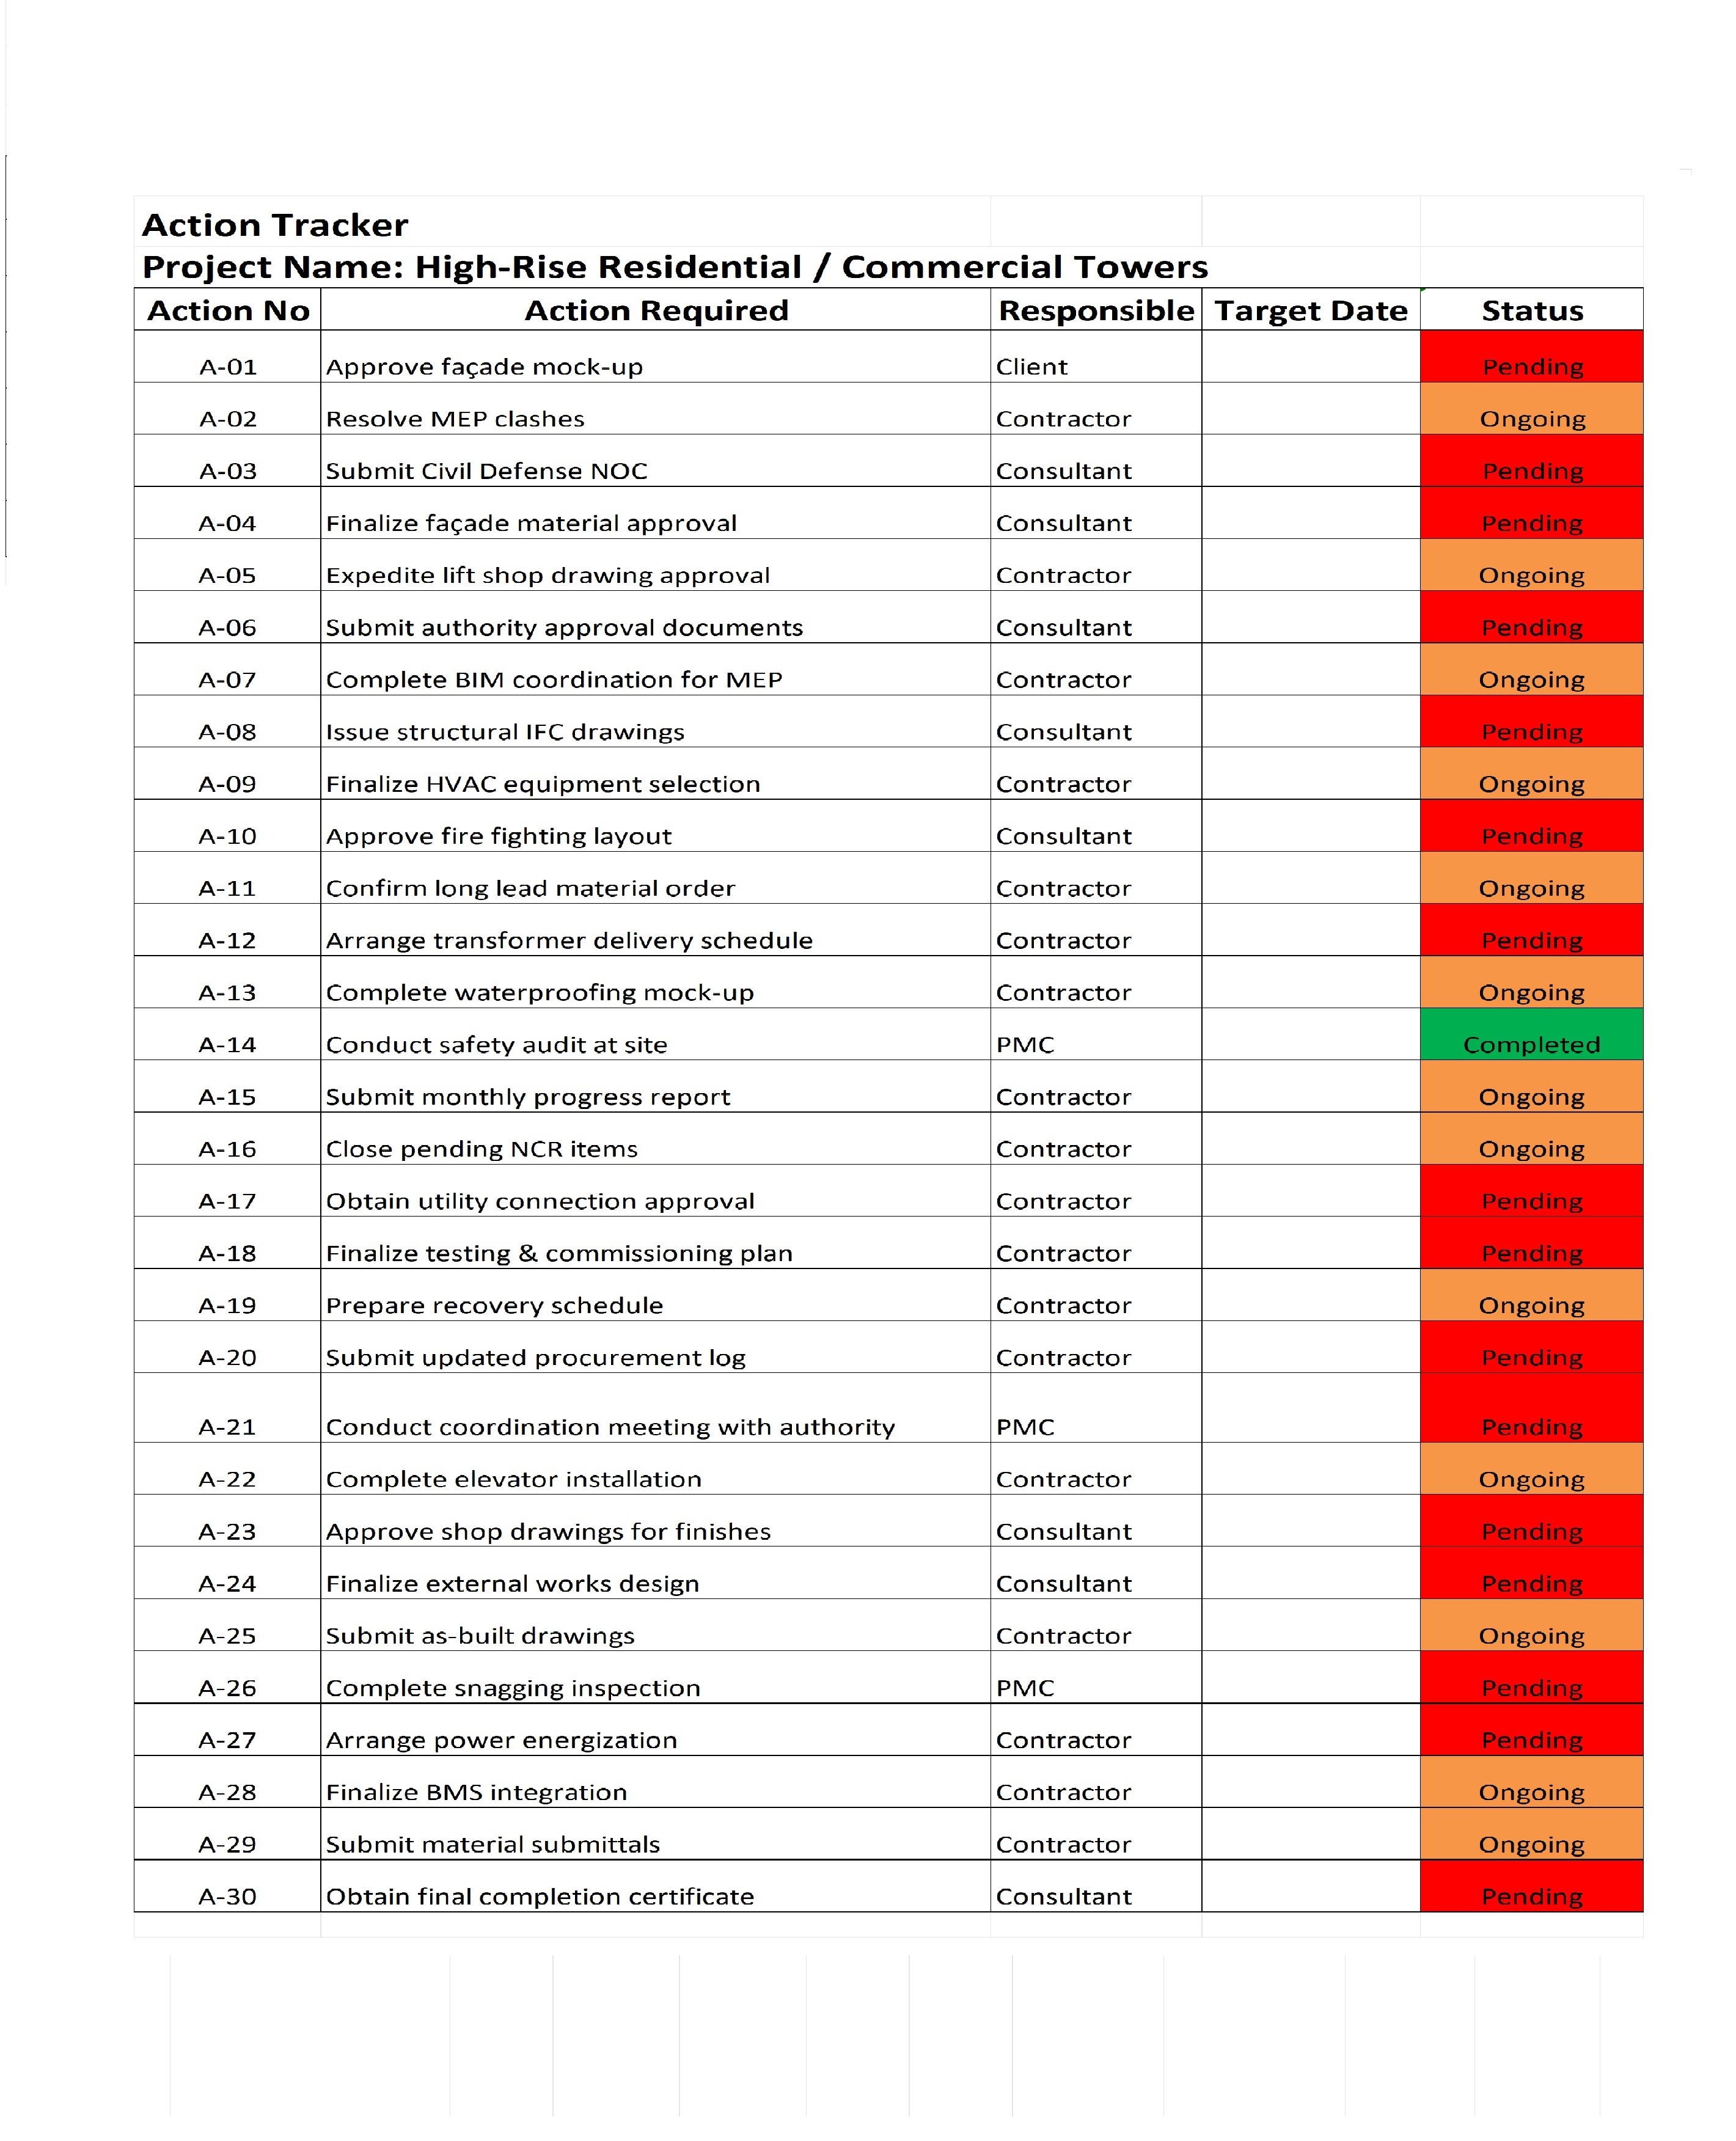
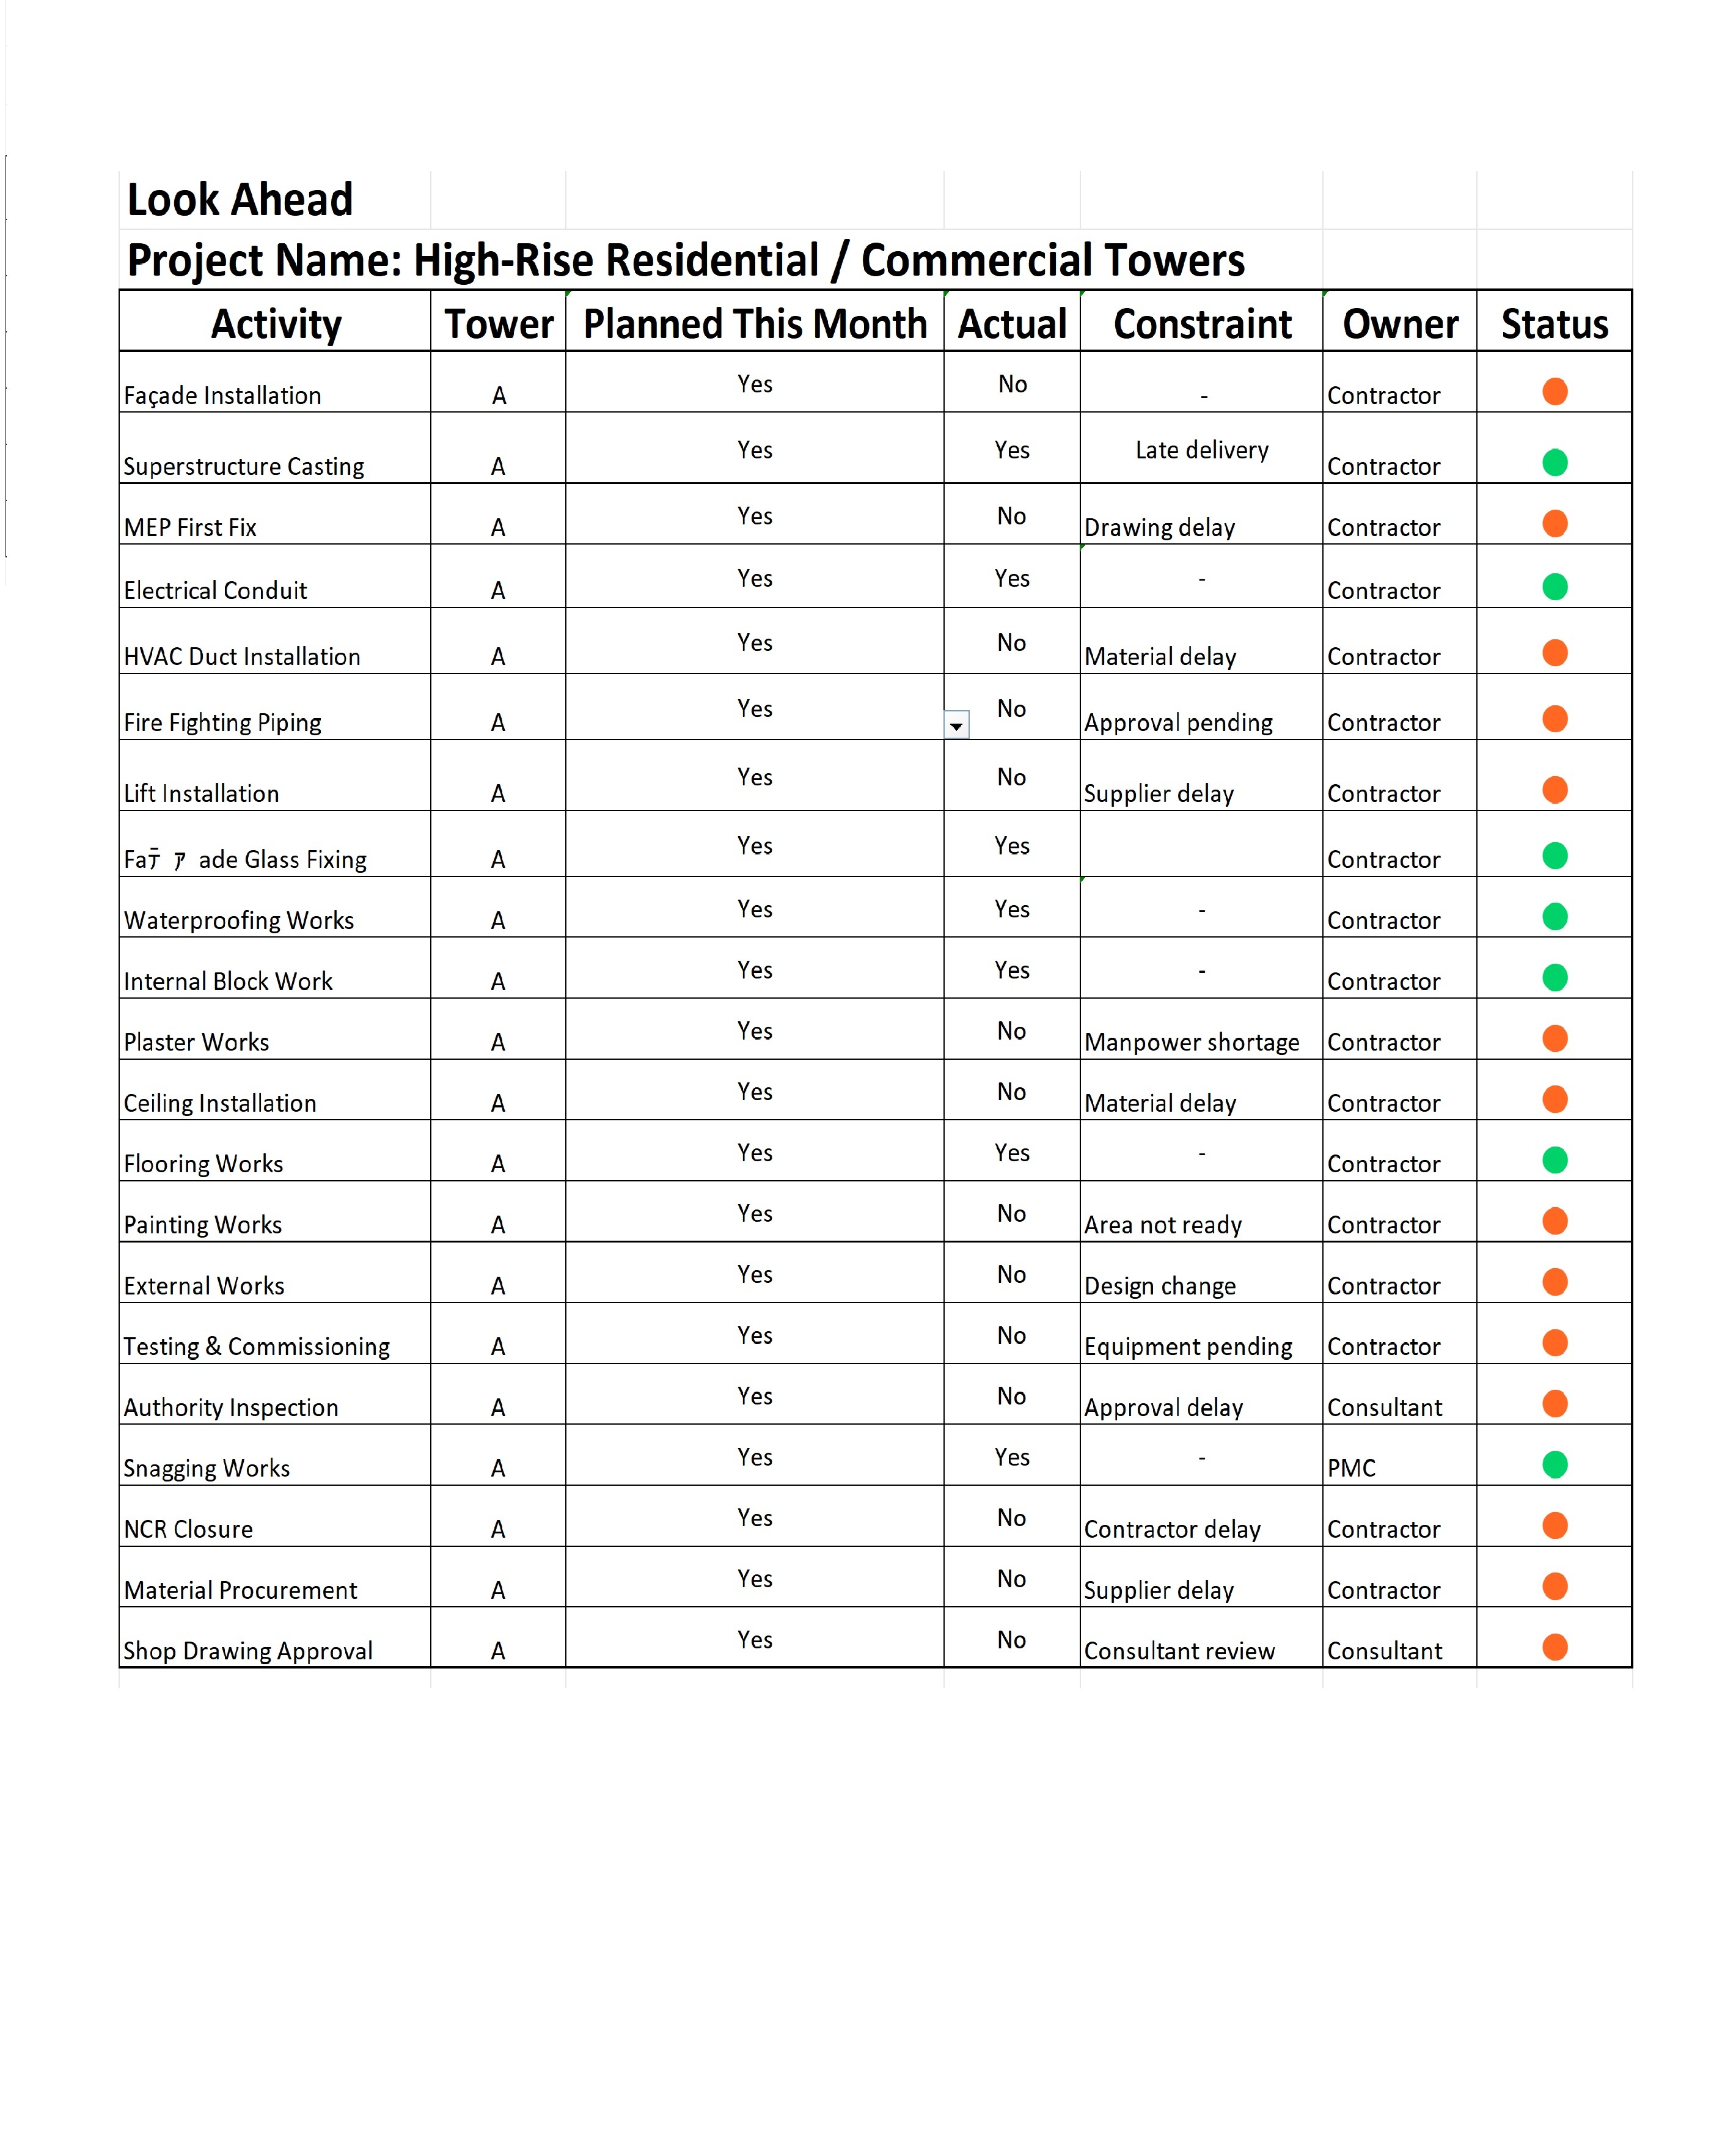
Identify risks, delays, and deviations early for proactive action
Improve transparency and accountability across stakeholders
Simplify complex data into clear, visual insights (RAG status)
Enhance communication between project teams and leadership
Support portfolio-level monitoring across multiple projects
Reduce manual effort with automated tracking and status indicators
Projects requiring board-level visibility and executive reporting
Organizations managing multiple projects or portfolios simultaneously
Environments where quick decision-making is critical
Projects with defined KPIs, thresholds, and performance metrics
Teams needing standardized governance and reporting frameworks
Situations with frequent status reviews (weekly/monthly governance meetings)
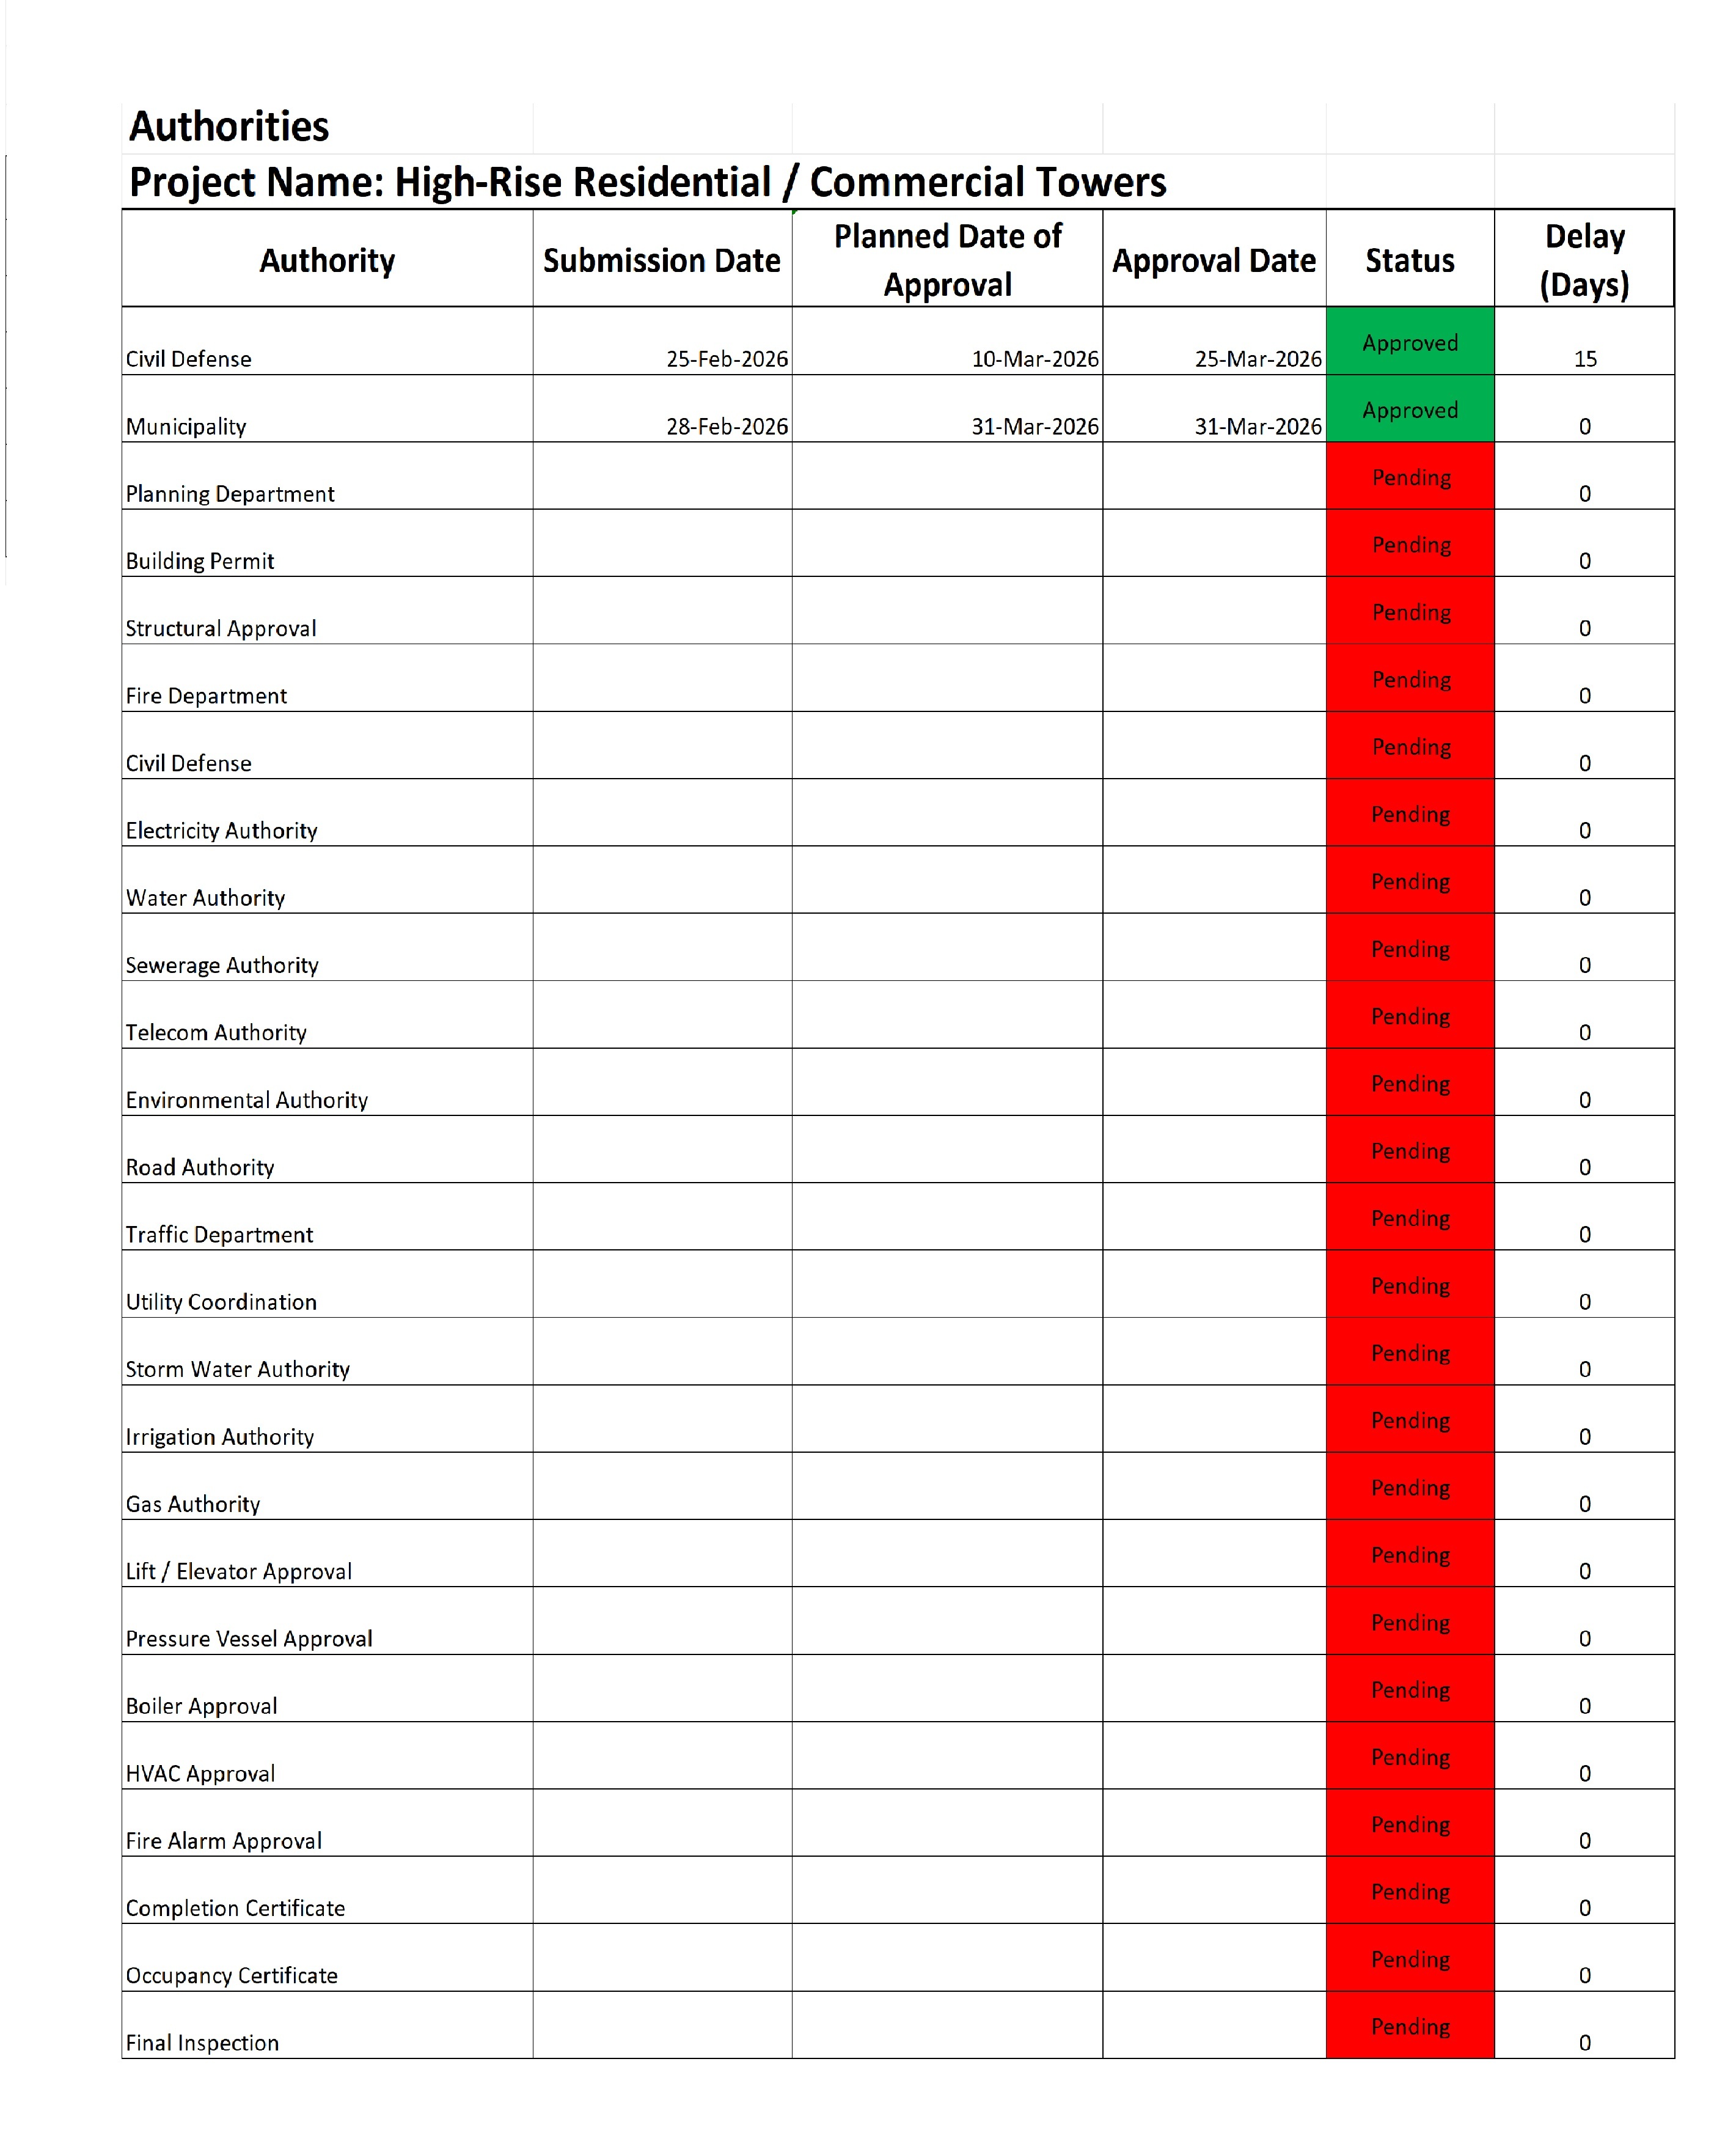
Projects involving multiple stakeholders (clients, contractors, consultants)
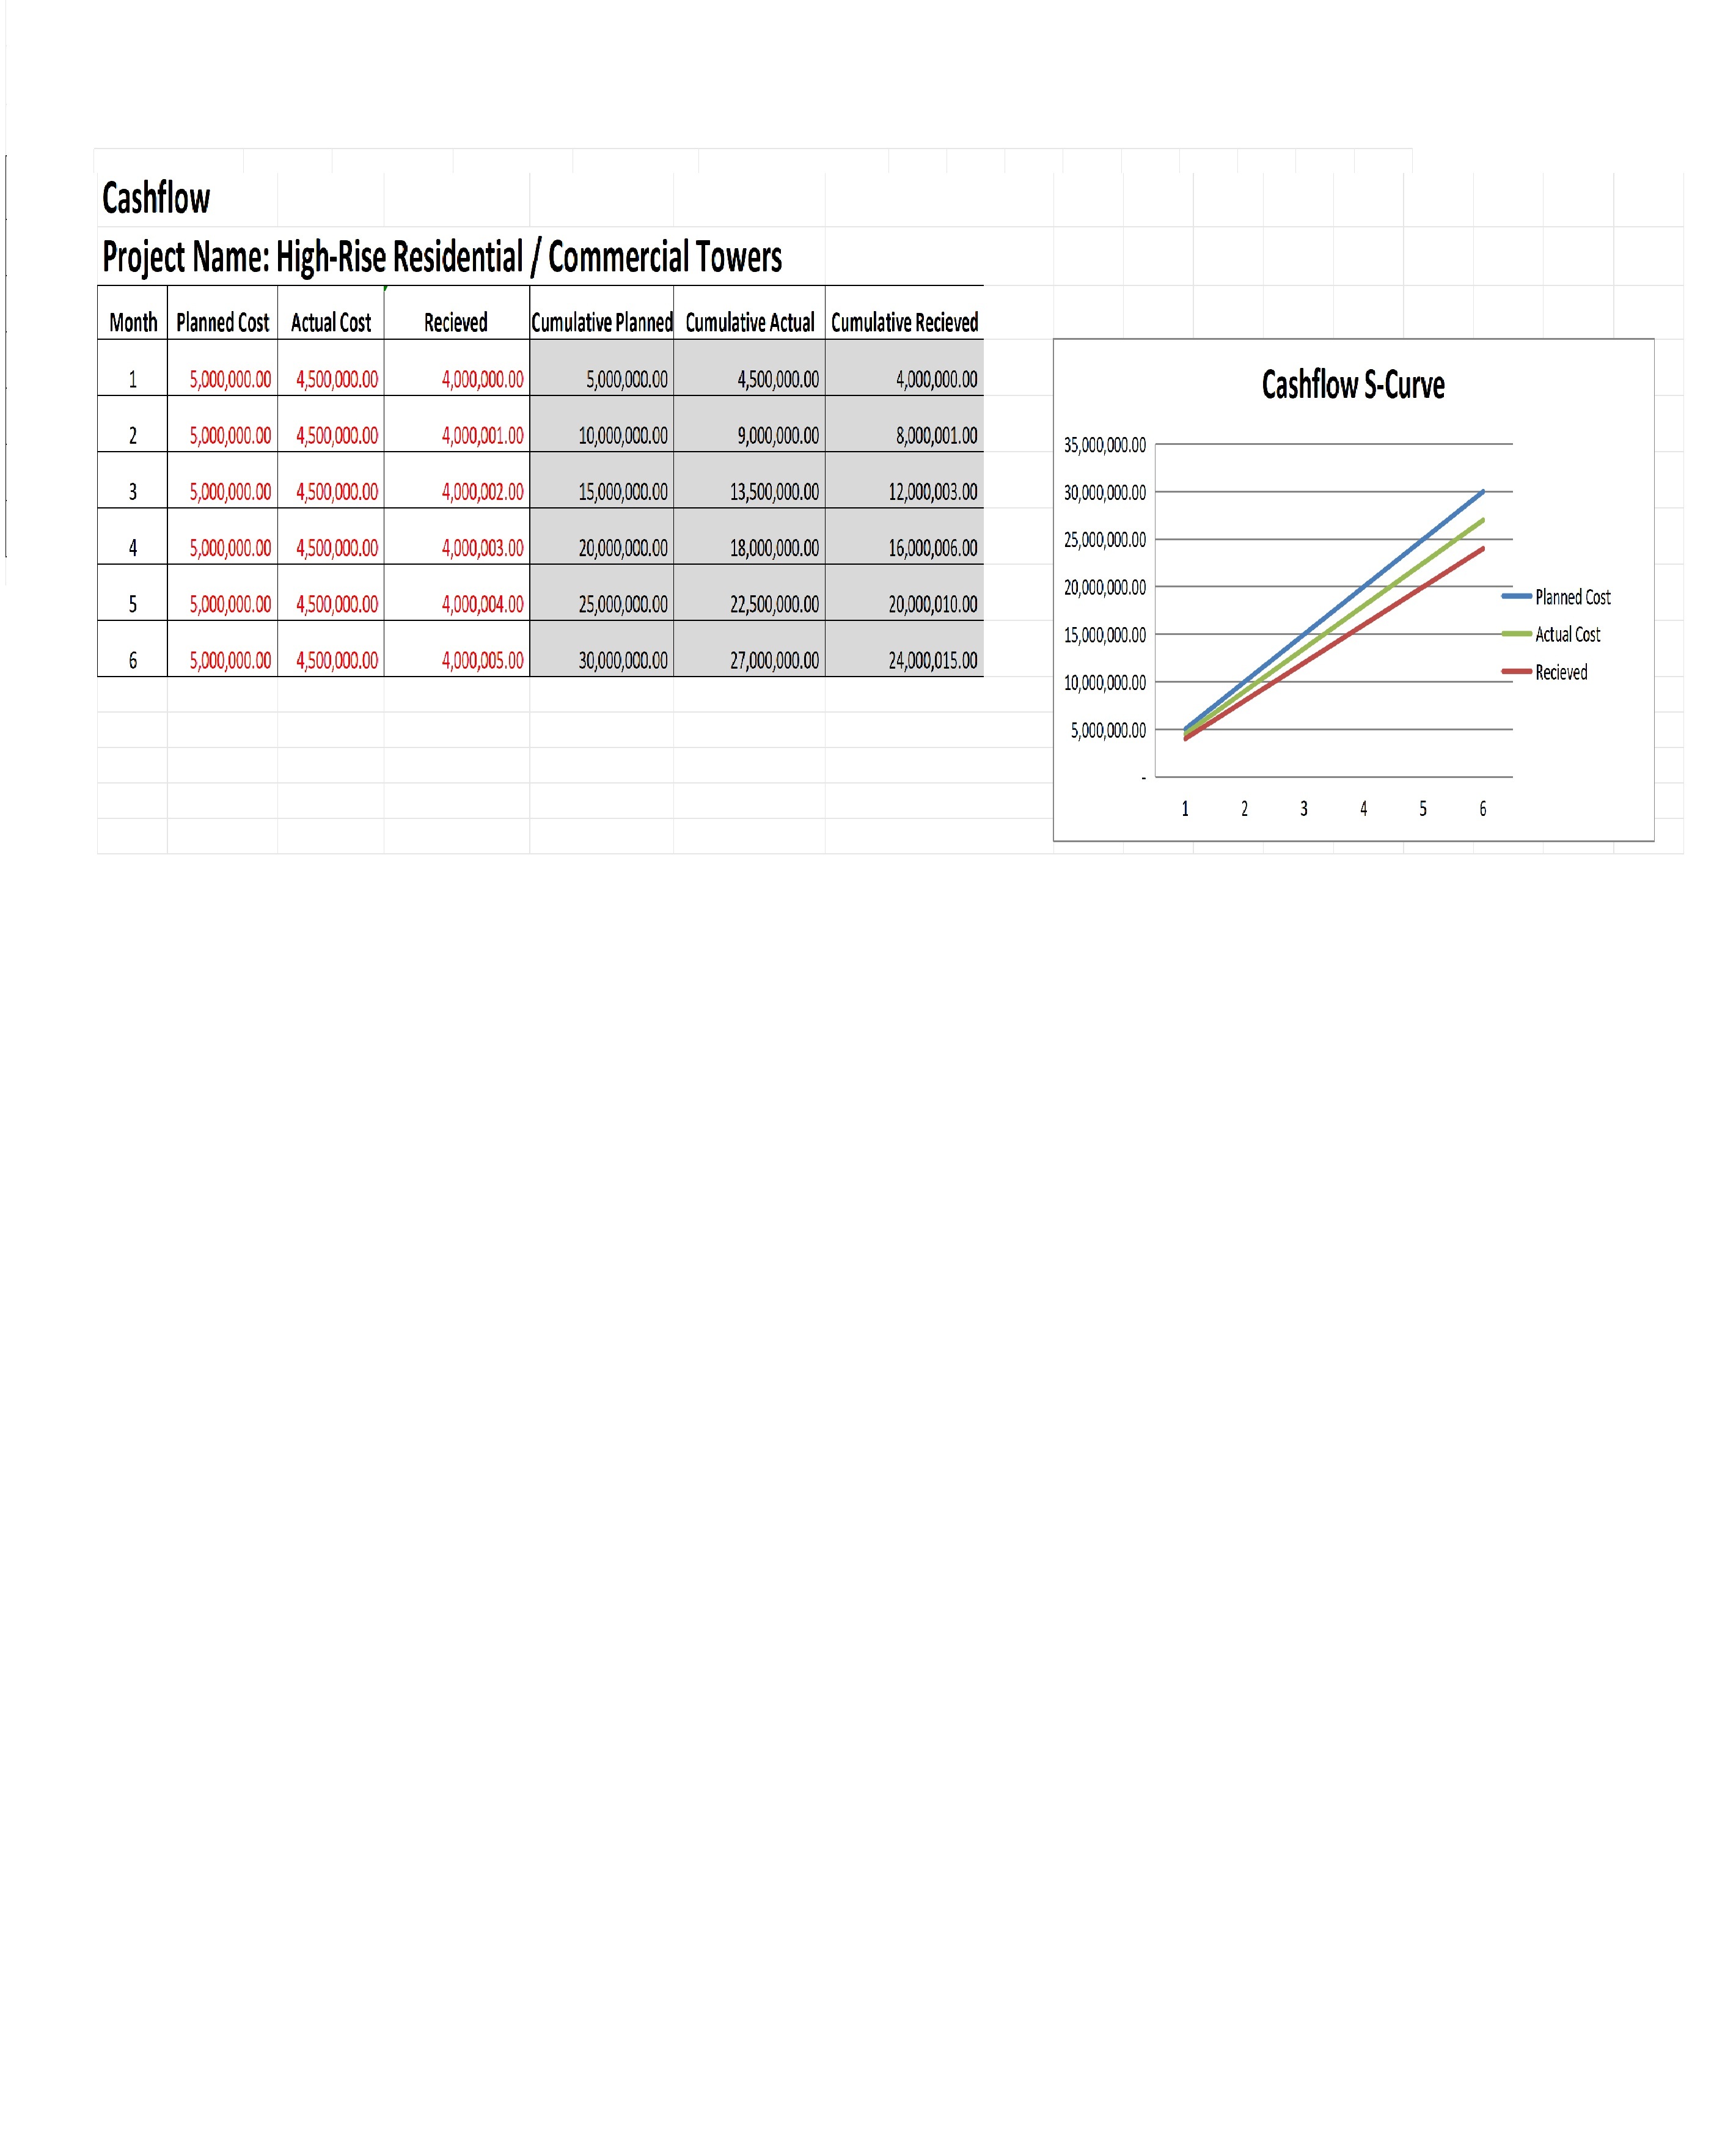
When there is a need to track risks, delays, and financial performance
Organizations aiming to improve transparency and accountability
When using Excel-based tools for project monitoring and reporting
Very small or simple projects with minimal tracking requirements
Environments without defined KPIs, thresholds, or governance structure
Teams that do not maintain regular or reliable data updates
Projects requiring real-time system integrations (e.g., ERP, Primavera, Power BI)
Organizations relying on fully automated or enterprise-level tools
Situations needing highly customized or industry-specific reporting formats
Teams unfamiliar with basic Excel usage or data handling
Projects with unstructured or ad-hoc management approaches
When detailed, task-level or operational tracking is the primary focus
Environments lacking management involvement or decision-making processes
