BESS Ultimate Model — Multi-Country Battery Storage Investment Model · 8 Markets · 20-Year DCF
Originally published: 13/05/2026 13:31
Last version published: 13/05/2026 13:51
Publication number: ELQ-71376-2
View all versions & Certificate
certified

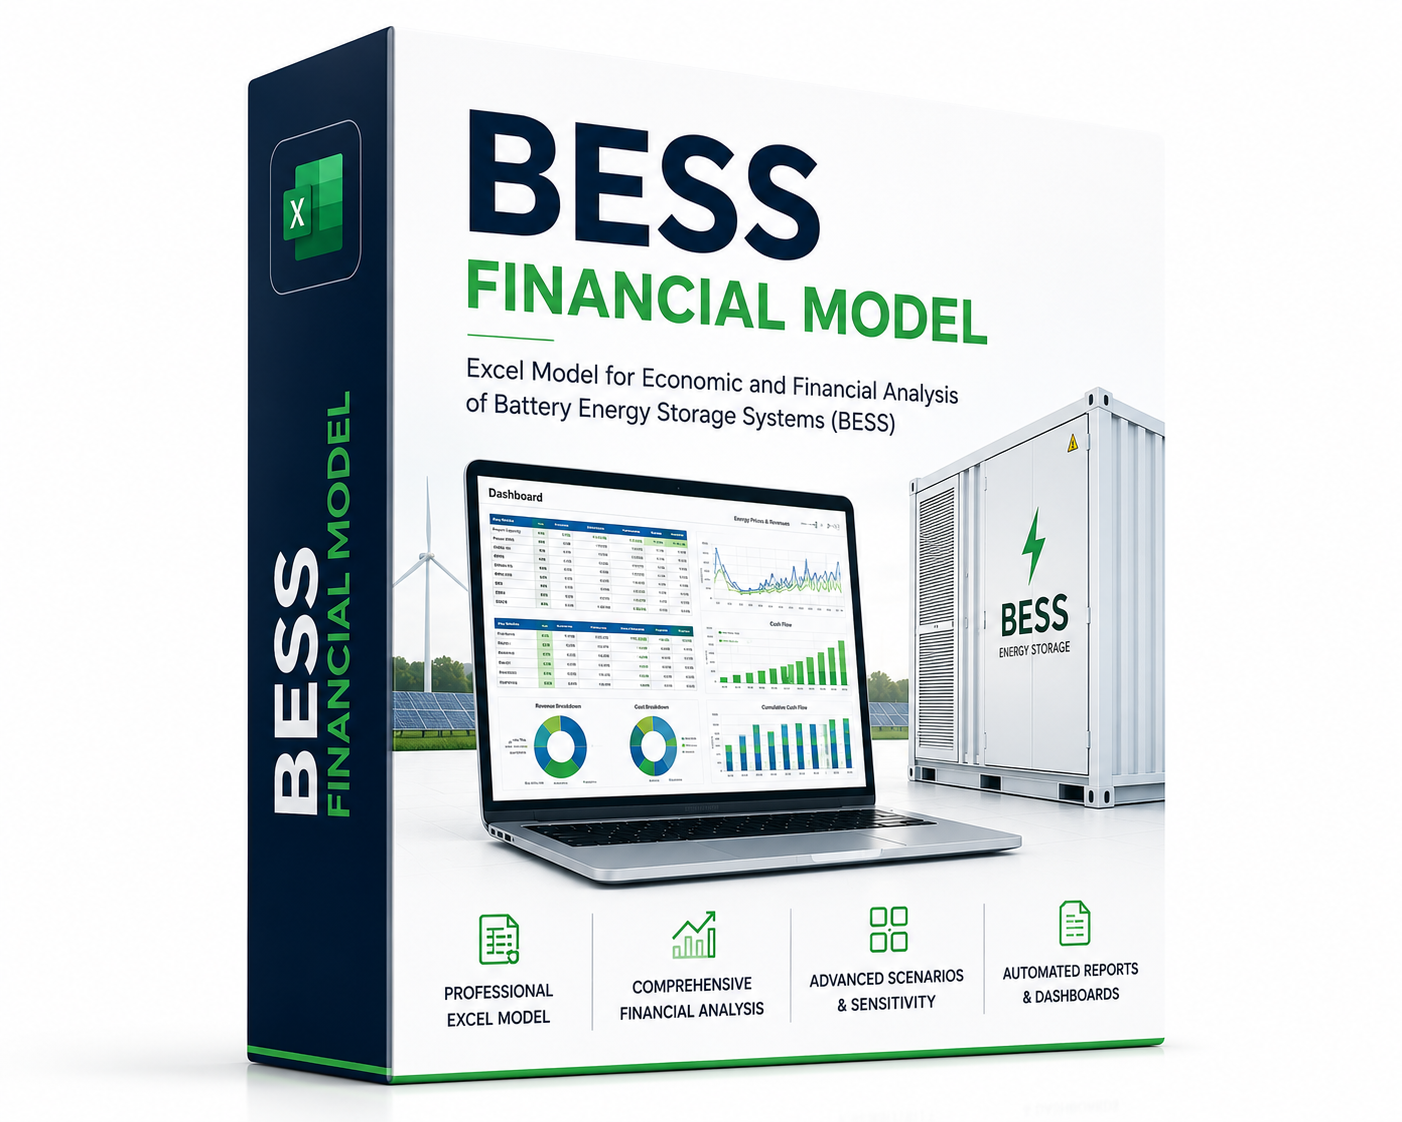
BESS Ultimate Model — Multi-Country Battery Storage Investment Model · 8 Markets · 20-Year DCF

A professional-grade financial model to evaluate standalone BESS investments across 8 countries (Italy, Spain, UK, Germany, USA, France, Australia, Nordic)

Description
Battery storage economics are complex and move fast. Arbitrage spreads, ancillary service rates, capacity market payments — they differ by country, change by quarter, and if your model isn't calibrated to the right market, your IRR means nothing to a lender or investor.
This model solves that problem.

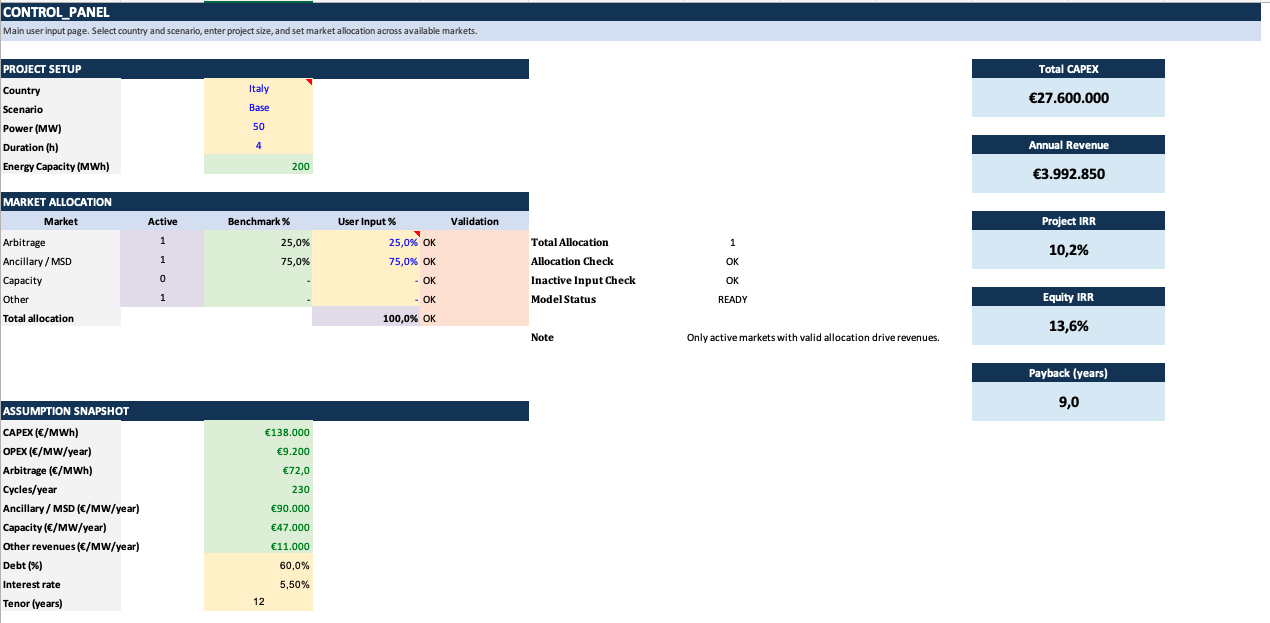
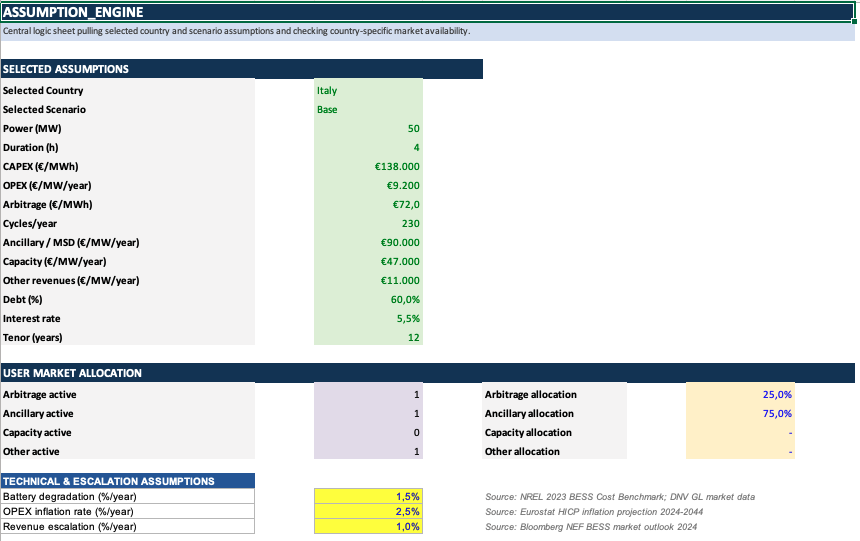
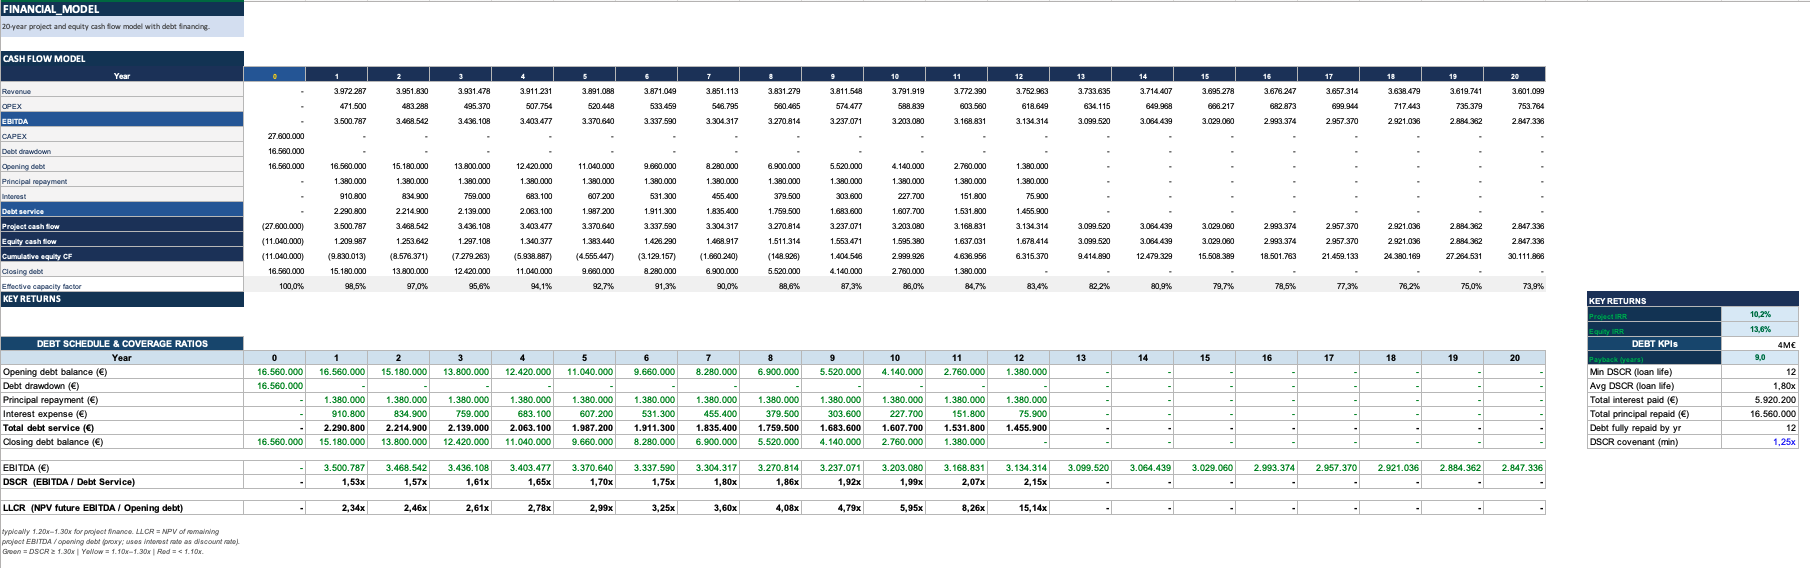
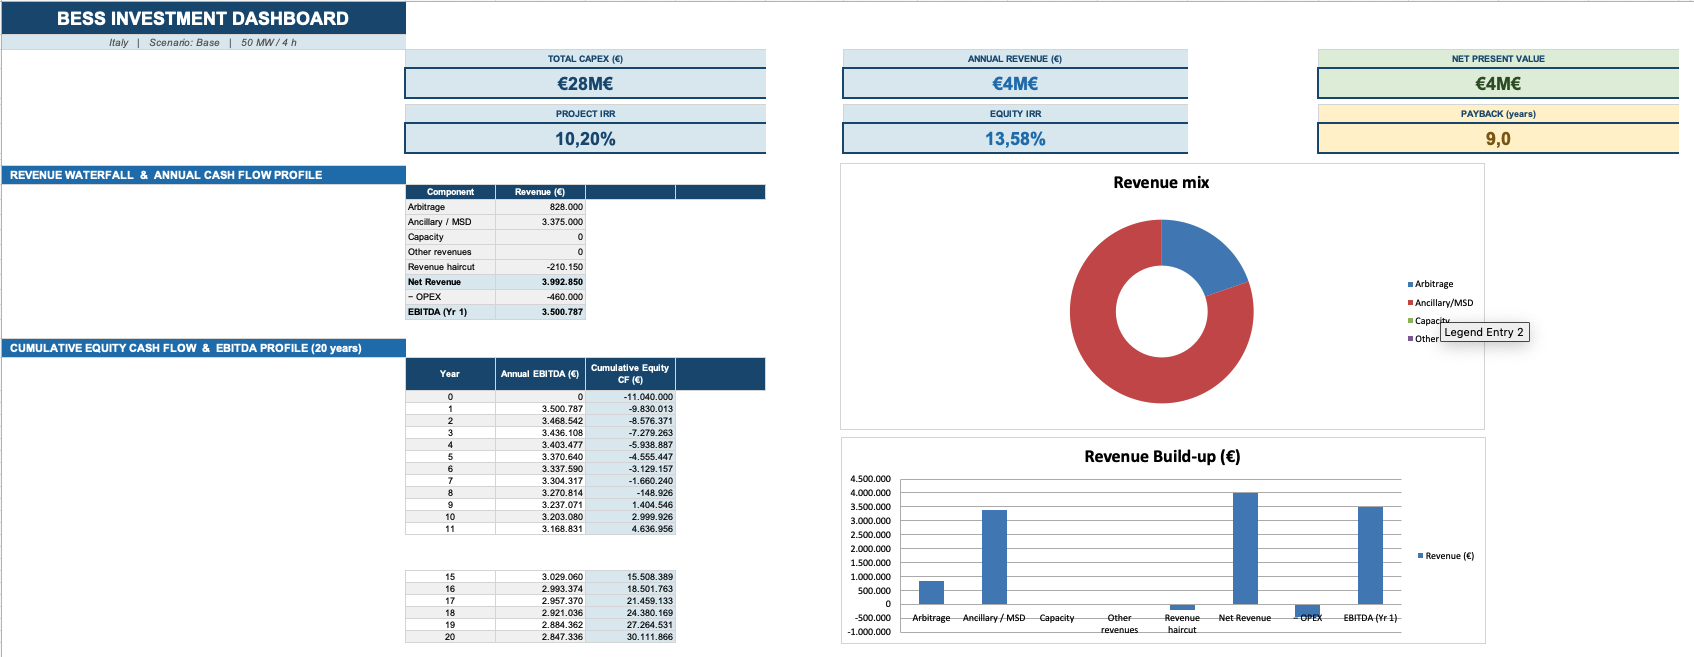
Select your country and scenario, enter your system size and revenue allocation — and every output updates automatically. Project IRR, Equity IRR, NPV, payback. A full 20-year cash flow with battery degradation, OPEX escalation and a complete debt schedule. Ready to present, ready to share, ready to defend.

What makes it different from a generic DCF template

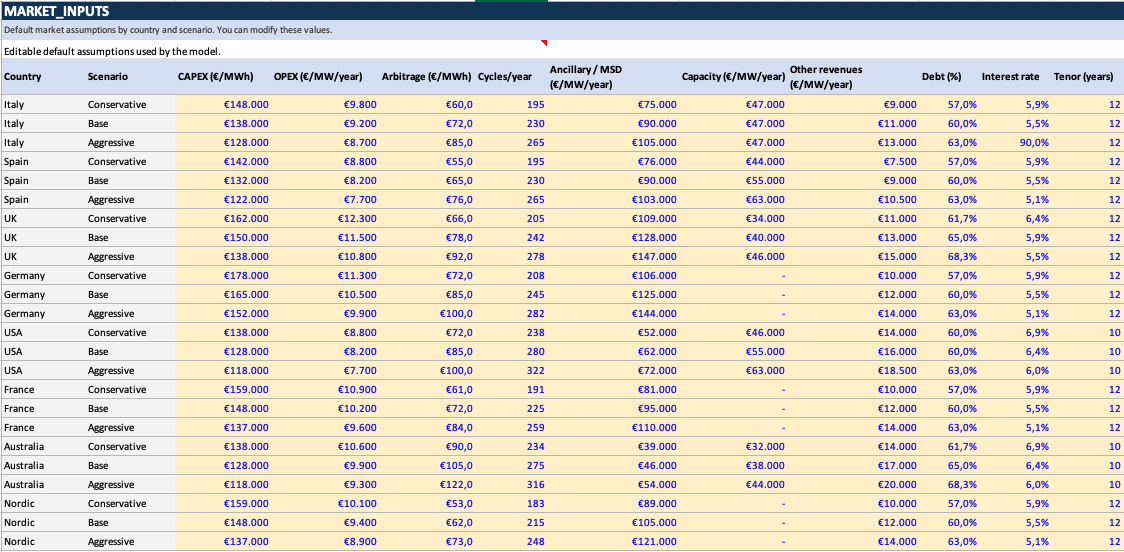
The assumptions are already calibrated for your market — and recently updated. 8 countries across Italy, Spain, UK, Germany, USA, France, Australia and Nordic, each with Conservative, Base and Aggressive scenarios built from Modo Energy Q1 2026, Capstone DC, BESS Index, enspired, Rystad and highjoule. CAPEX reflects the current cost curve — not 2022 numbers. Arbitrage spreads account for 15-minute market granularity post the EU October 2024 reform. The UK ancillary rate reflects the £108k/MW market level tracked by highjoule in 2026.
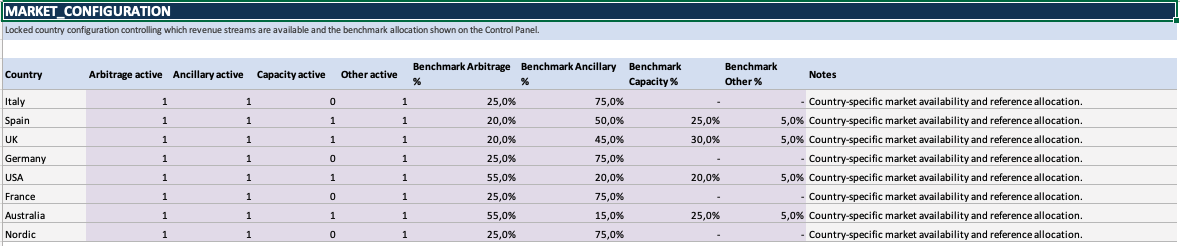
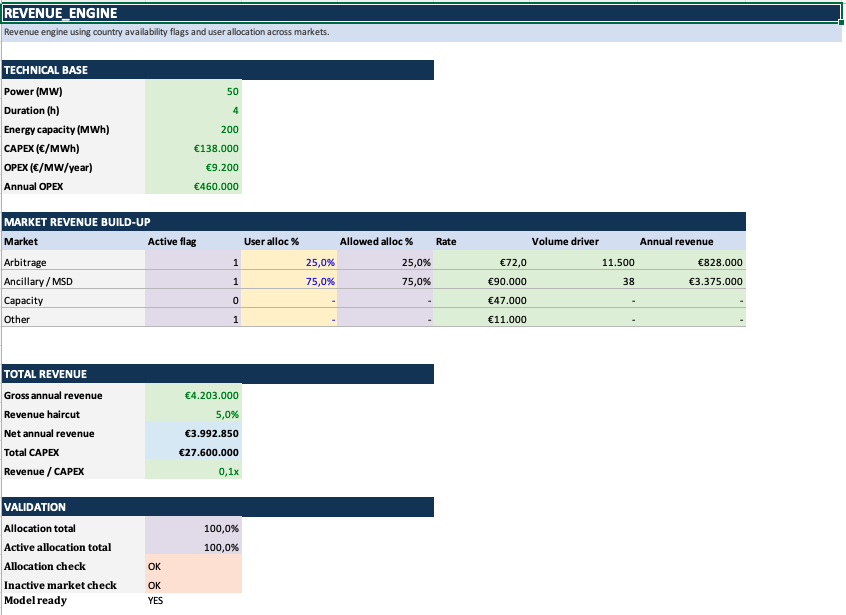
The revenue engine reflects how BESS projects actually get financed. Four configurable streams — Arbitrage, Ancillary/MSD, Capacity Market and Other — with country-specific market activation and benchmark allocations pre-loaded. Not every market has a capacity market. Not every market has the same ancillary structure. The model knows the difference and activates only what is real in each country.
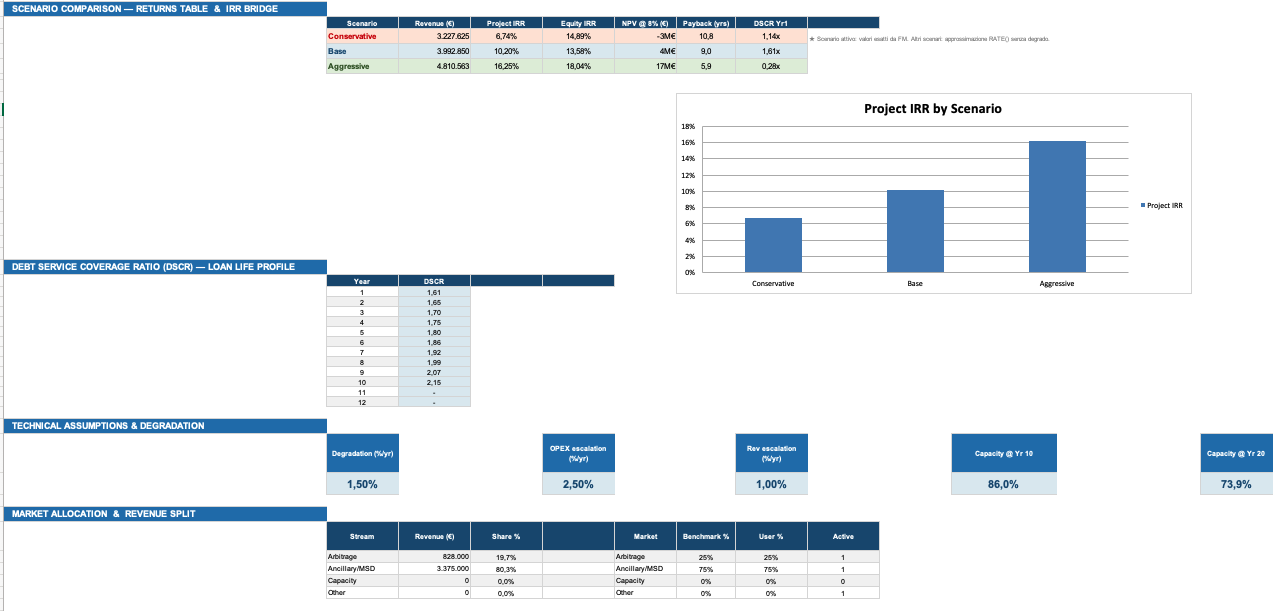
Battery degradation is modelled explicitly — not assumed away. A 1.5%/yr default degradation curve is applied annually across the 20-year cash flow, alongside OPEX escalation at 2.5%/yr and revenue price escalation at 1.0%/yr. The DASHBOARD includes a scenario IRR/NPV comparison table across Conservative, Base and Aggressive, and a technical degradation summary block so you can show your lender exactly how capacity fades over time.

Who this is for

Developers and IPPs evaluating standalone BESS projects in new markets. Financial advisors structuring storage financing or preparing investment memoranda. Utilities and corporates assessing battery assets for grid services, capacity or arbitrage. Anyone who needs a credible, market-calibrated BESS number without spending weeks building it.

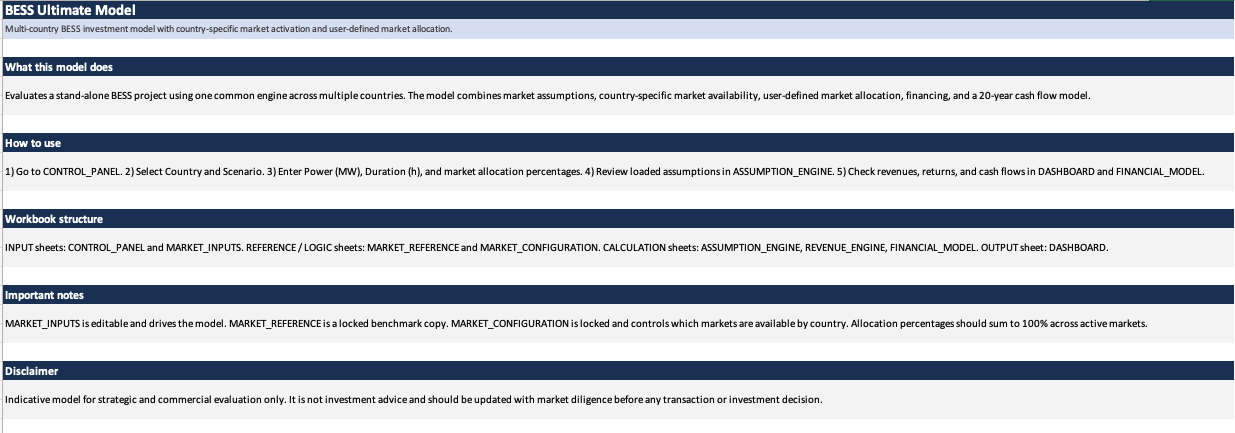
Workbook: CONTROL_PANEL · MARKET_INPUTS · MARKET_REFERENCE · MARKET_CONFIGURATION · ASSUMPTION_ENGINE · REVENUE_ENGINE · FINANCIAL_MODEL · DASHBOARD.

For custom versions, country extensions or specific requests, contact us at [email protected]

This Best Practice includes
1 Excel model, 1 PDF document

Acquire business license for $161.00

Add to cart

Add to bookmarks

Discuss

Further information

This model enables developers, advisors and investors to evaluate the financial viability of a standalone BESS project across 8 international markets without building a model from scratch. It supports scenario comparison across Conservative, Base and Aggressive assumptions with a single selector, produces Project IRR, Equity IRR, NPV and payback from a fully integrated 20-year cash flow with explicit battery degradation, and enables precise control over the revenue stack — activating only the streams that are real in each country and allowing full user override of benchmark allocations. The DASHBOARD scenario comparison table makes it immediately presentation-ready for lenders and investors.

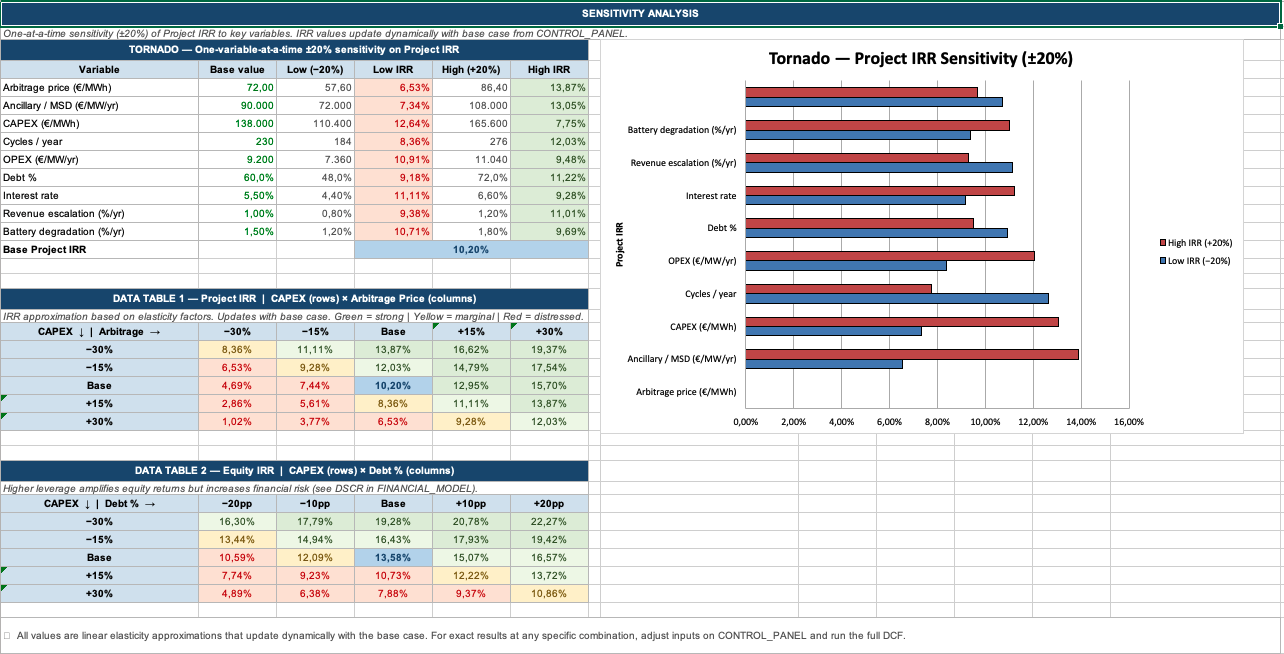
This model is best suited to utility-scale standalone BESS projects in the 10–500 MW range at early-stage feasibility or commercial evaluation, prior to full technical due diligence. It is calibrated for Italy, Spain, UK, Germany, USA, France, Australia and Nordic markets, and works particularly well when the user needs to quickly compare how the same system size performs across multiple countries or revenue stack configurations. It is also well suited to financing preparation contexts where a lender needs to see explicit degradation modelling, DSCR and scenario sensitivity alongside the base case returns.

This model is designed for standalone BESS projects and does not model co-located storage paired with a solar or wind asset — for that use case, the Solar PV Ultimate Model or Wind Ultimate Model include an integrated BESS module. It is not suited to markets outside the 8 pre-loaded countries without manual customization of the assumption sets. It should not be used as the sole basis for a final investment decision — revenue assumptions, particularly ancillary and capacity market rates, are highly market-specific and volatile, and must be validated with current market data and professional advice before any transaction or investment decision.


5.0 / 5 (1 votes)

please wait...