Compound Interest Calculator — 40-Year Growth Table & Scenario Comparison | Excel
Originally published: 03/04/2026 08:29
Publication number: ELQ-84750-1
View all versions & Certificate
certified

Compound Interest Calculator — 40-Year Growth Table & Scenario Comparison | Excel

Excel compound interest calculator: 6 inputs, instant growth projections, 40-year breakdown, and scenario comparisons. Bilingual, error-free, Excel/Sheets.

Description

Visualize the most powerful force in personal finance — compound interest — and see exactly how your money grows over time.

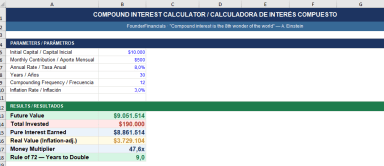
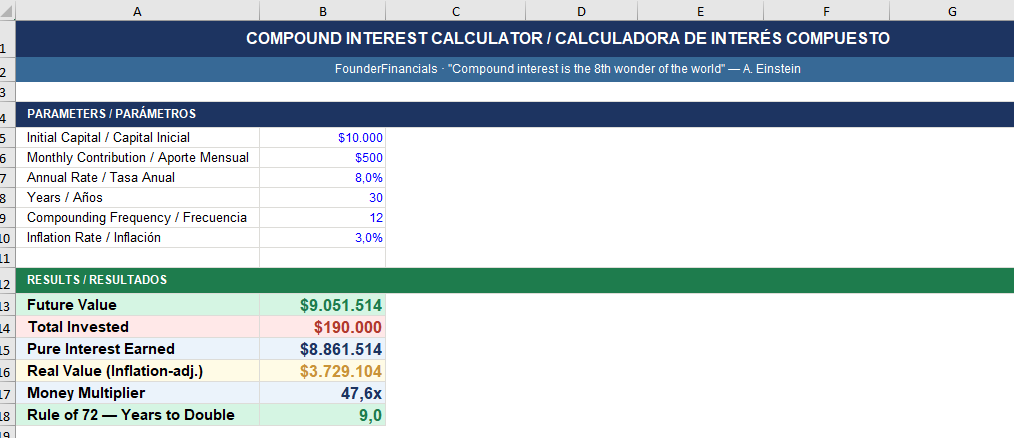
This Excel calculator gives you instant results from just 6 inputs:

  • initial capital

  • monthly contribution

  • annual return rate

  • years

  • compounding frequency

  • inflation rate

Change any input and every result updates automatically.

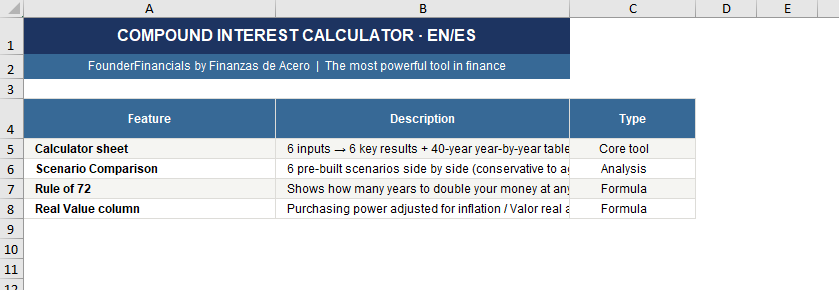
What's included (3 sheets):

  • Calculator — 6 key results including:

    • future value

    • total invested

    • pure interest earned

    • inflation-adjusted real value

    • money multiplier

    • Rule of 72

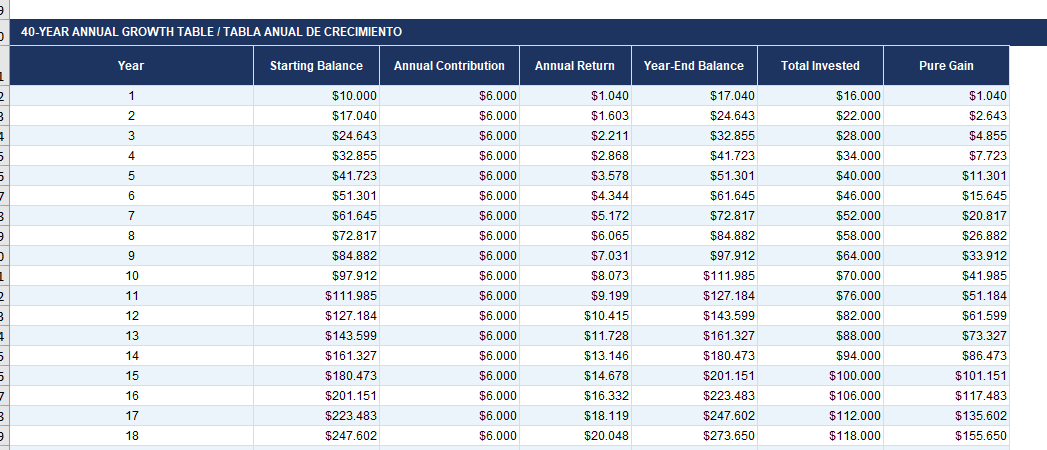
  • 40-Year Annual Growth Table — year-by-year breakdown showing:

    • starting balance

    • annual contribution

    • annual return

    • year-end balance

    • total invested

    • pure gain for every single year

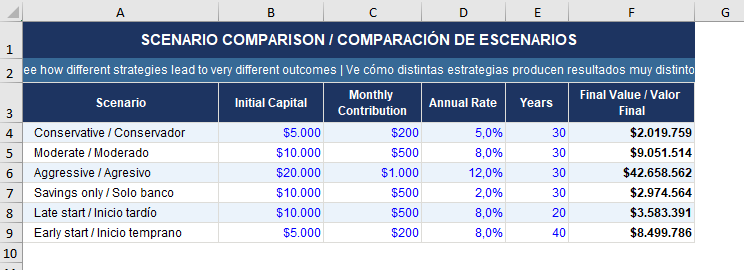
  • Scenario Comparison — 6 pre-built scenarios side by side:

    • Conservative

    • Moderate

    • Aggressive

    • Savings only

    • Late start

    • Early start

Key outputs you get instantly:
✔ Future value of your investment at any rate and timeframe
✔ Total interest earned vs. total amount invested
✔ Real purchasing power adjusted for inflation
✔ Money multiplier showing how many times your capital grows
✔ Rule of 72 — exact years to double your money at your current rate
✔ Side-by-side scenario comparison to see the cost of waiting

Built with industry-standard color coding.
Zero formula errors guaranteed.
Compatible with Excel 2016+ and Google Sheets.
Fully editable.
Bilingual English and Spanish.

Perfect for:

  • retail investors

  • financial educators

  • students

  • financial planners

  • anyone planning long-term wealth building or teaching the power of compound interest.

This Best Practice includes
1 Excel file (.xlsx), 3 sheets: Compound Interest Calculator, 40-Year Annual Growth Table, Scenario Comparison (6 strate

Acquire business license for $25.00

Add to cart

Add to bookmarks

Discuss

Further information

Calculate the future value of any investment with compound interest. Visualize 40 years of year-by-year growth in a single table. Compare six different investment strategies side by side to understand the real cost of starting late or investing conservatively. Understand the Rule of 72 and inflation-adjusted real returns. Make smarter long-term wealth-building decisions backed by real numbers.

Individual investors planning long-term savings or retirement. Financial educators and coaches teaching the power of compound interest. Students studying personal finance or investment fundamentals. Anyone comparing different contribution levels, rates, or timeframes before committing to an investment strategy. Works best with Excel 2016+ or Google Sheets.

Not designed for complex portfolio analysis with multiple asset classes. Does not account for variable return rates year over year. Not a substitute for professional investment advice. Does not include tax calculations on investment gains. Users looking for real-time market data will need a separate tool.


0.0 / 5 (0 votes)

please wait...