
Last version published: 13/07/2026 20:17
Publication number: ELQ-51438-2
View all versions & Certificate

Cohort Retention & Subscriber LTV Protocol — SaaS Heatmap Spreadsheet
Map month-over-month SaaS retention, identify early churn cliffs, and calculate true cohort LTV and CAC payback in Google Sheets.
Further information
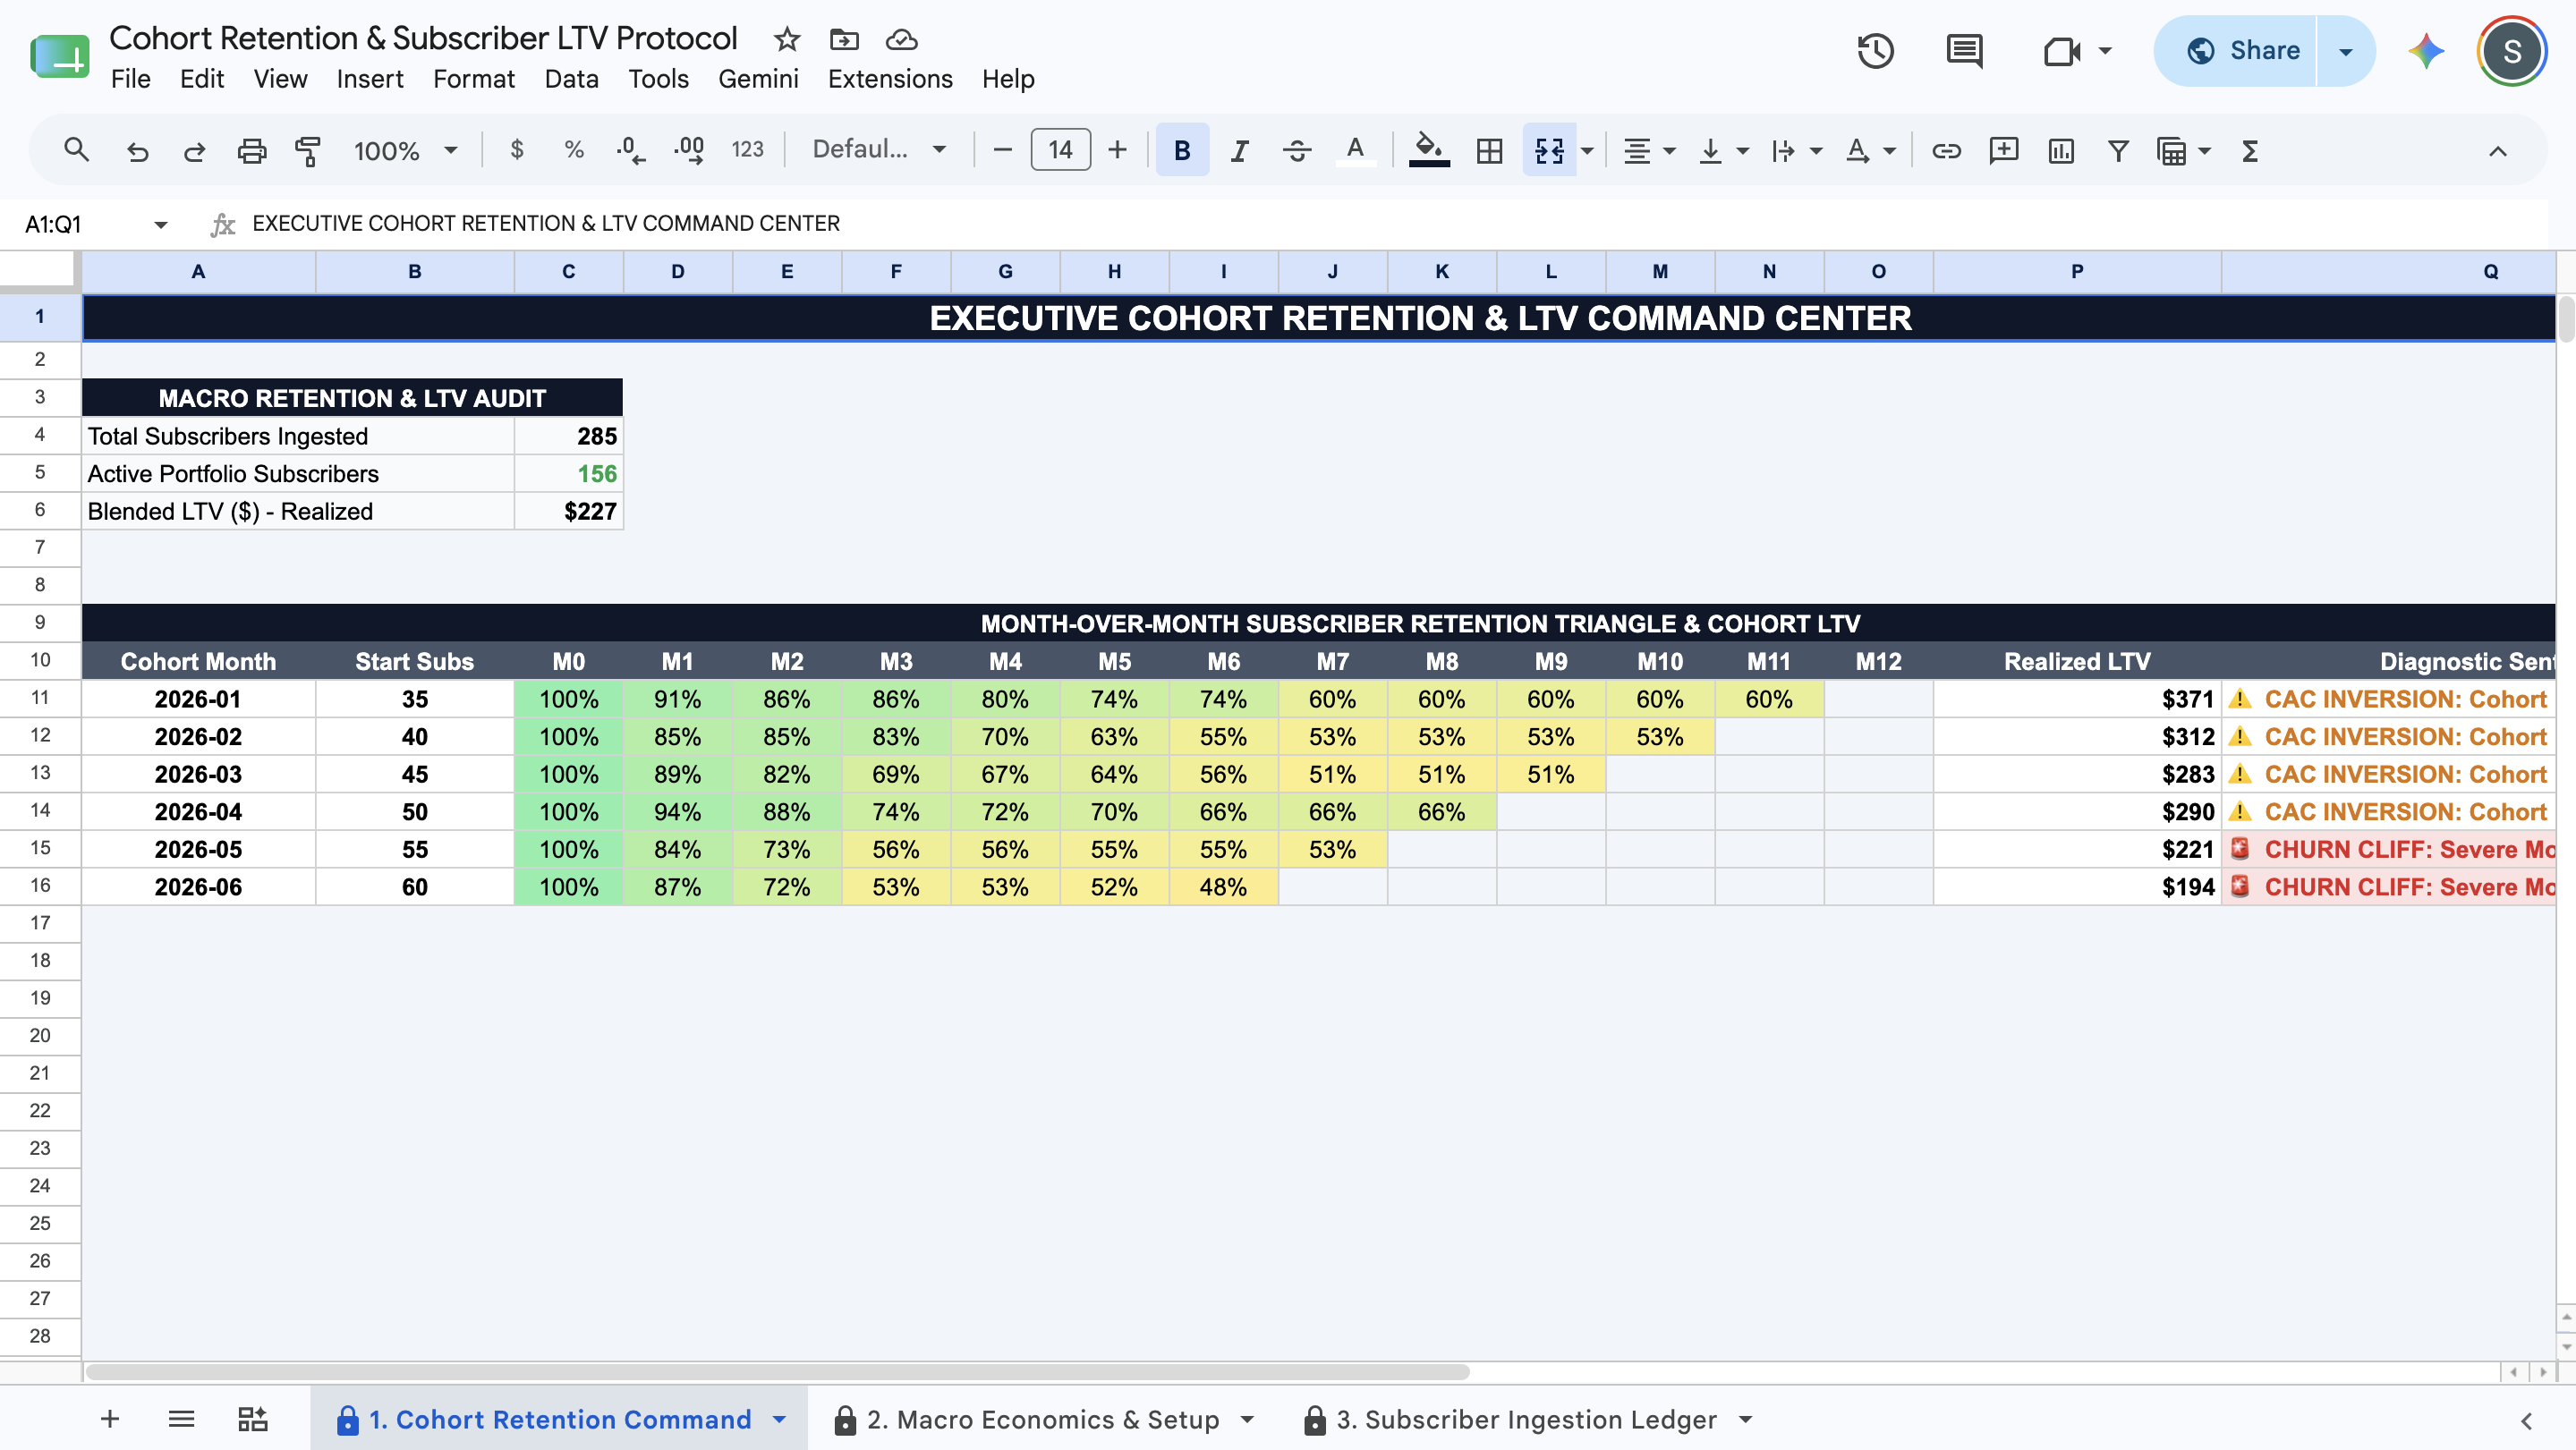
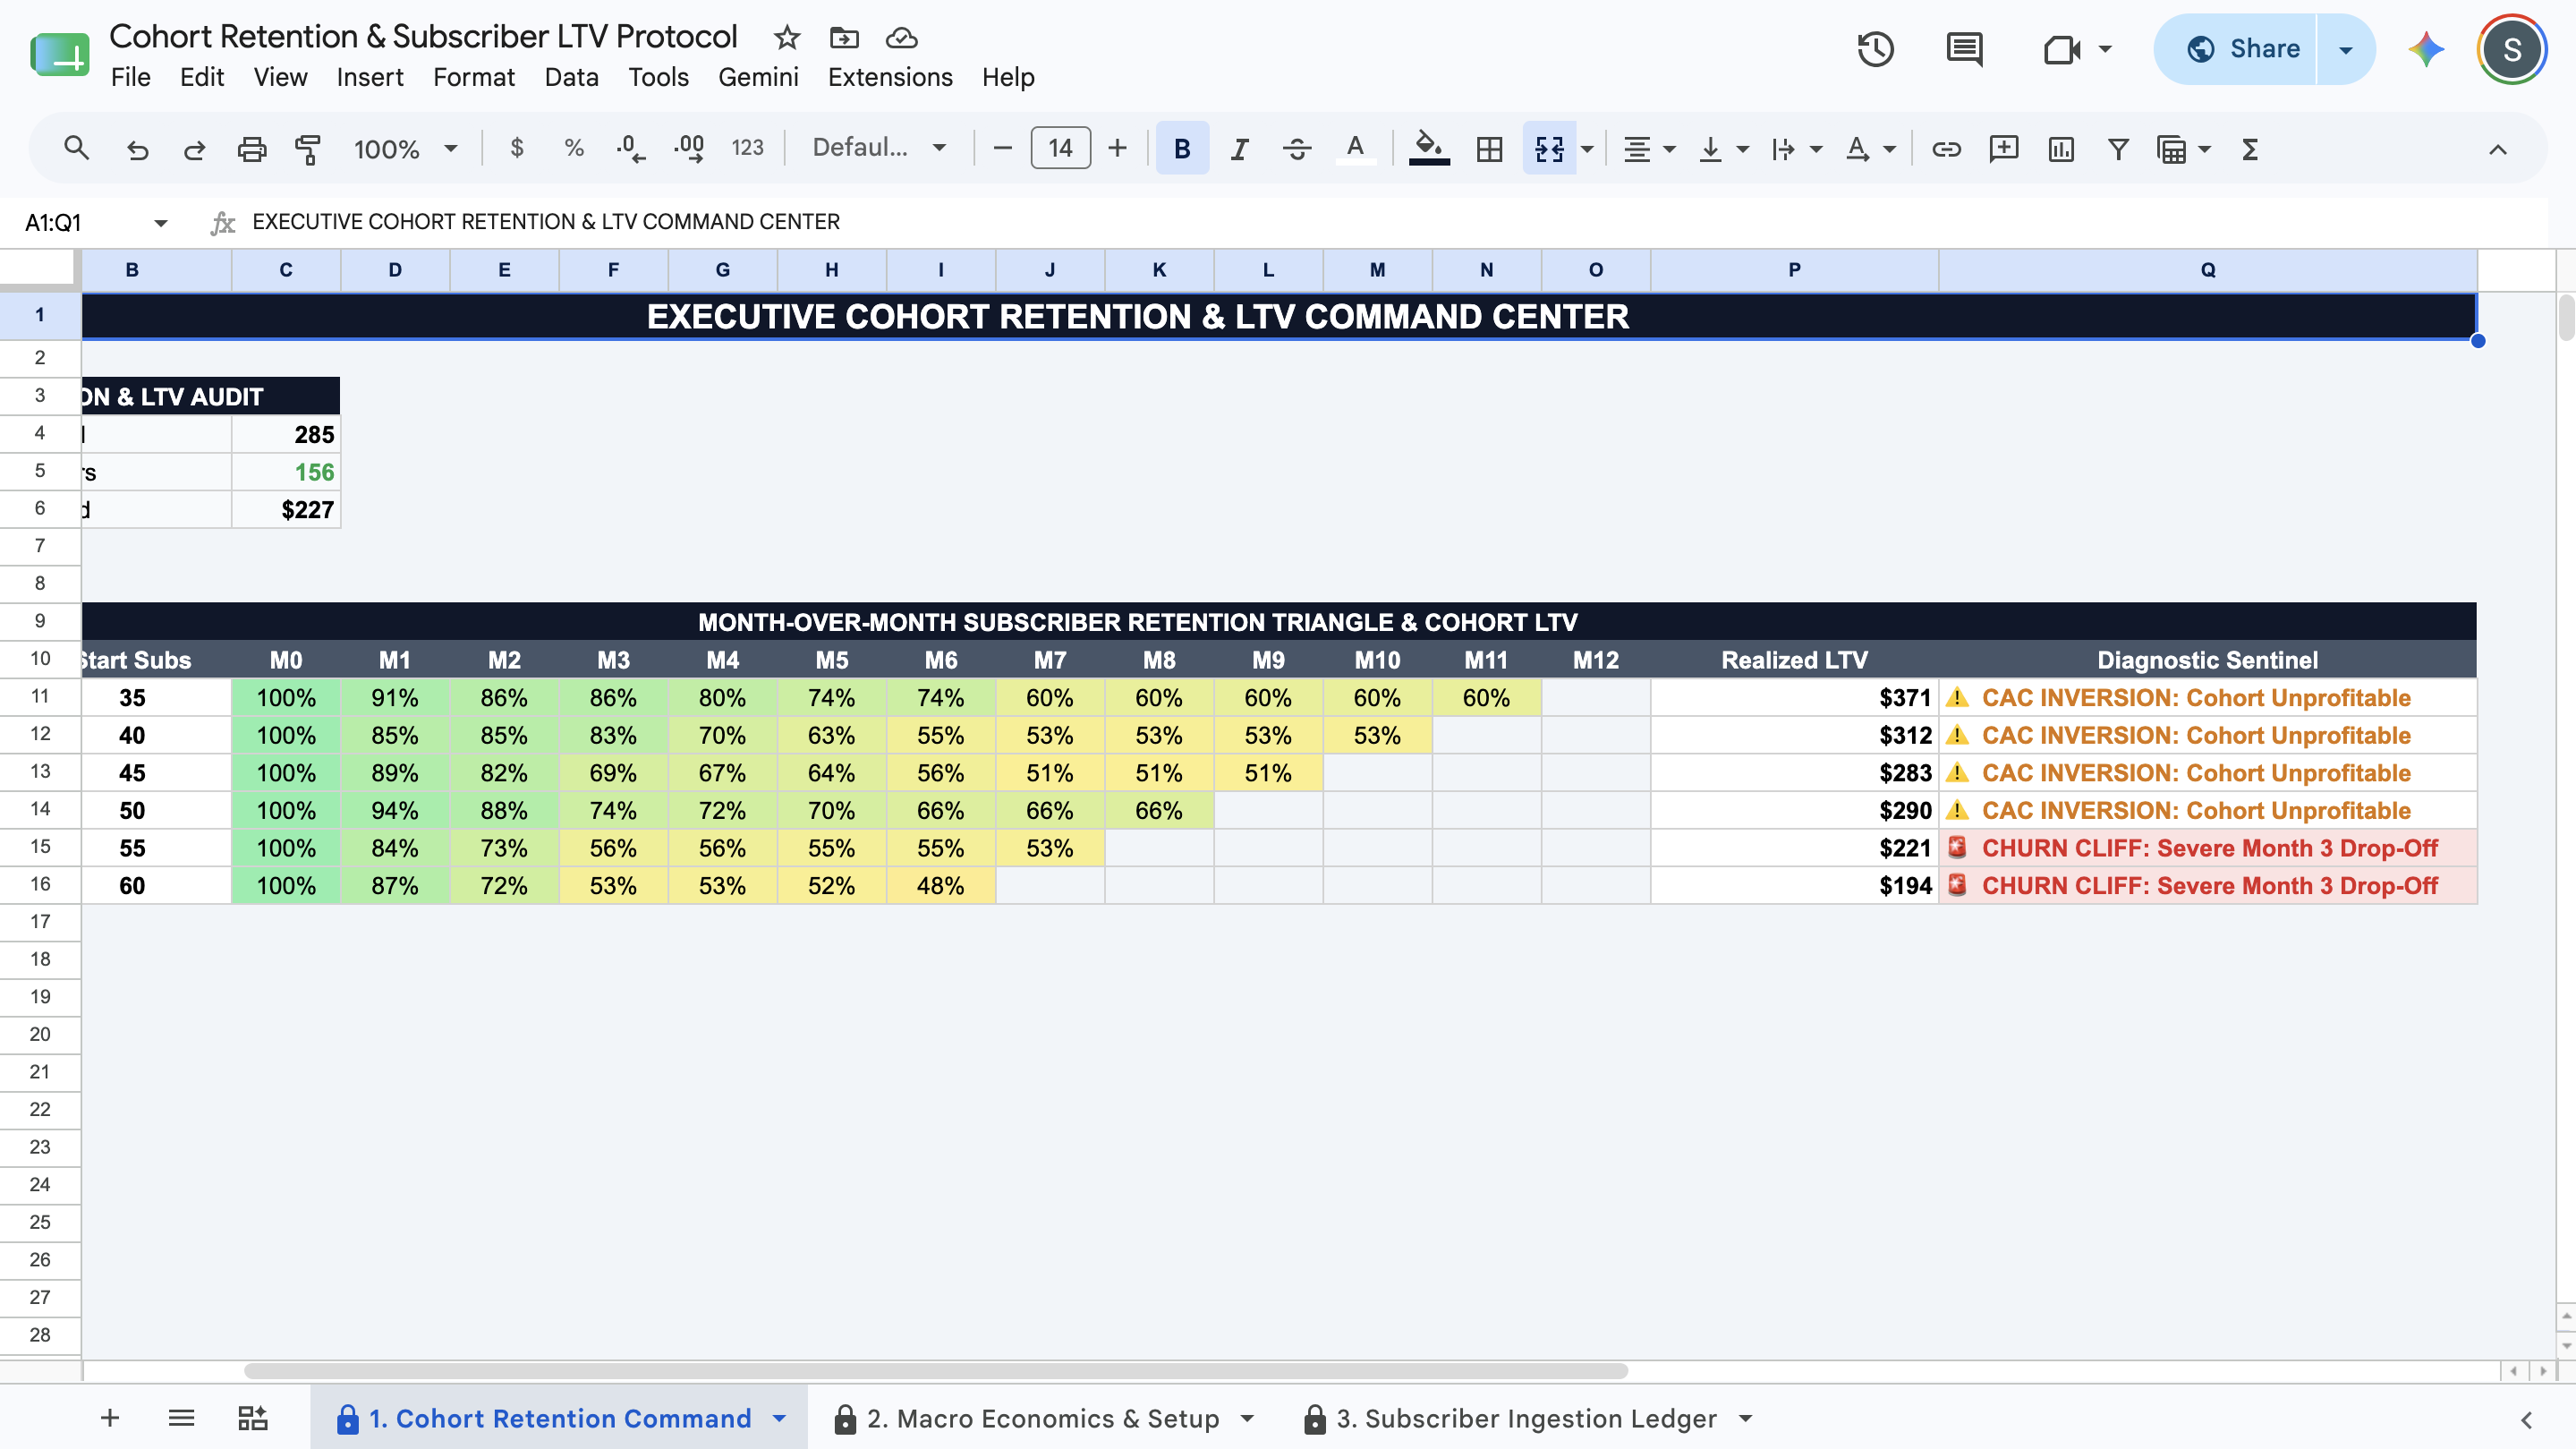
Map month-over-month subscriber survival rates across a classic 13-month triangle heatmap (M0 to M12)
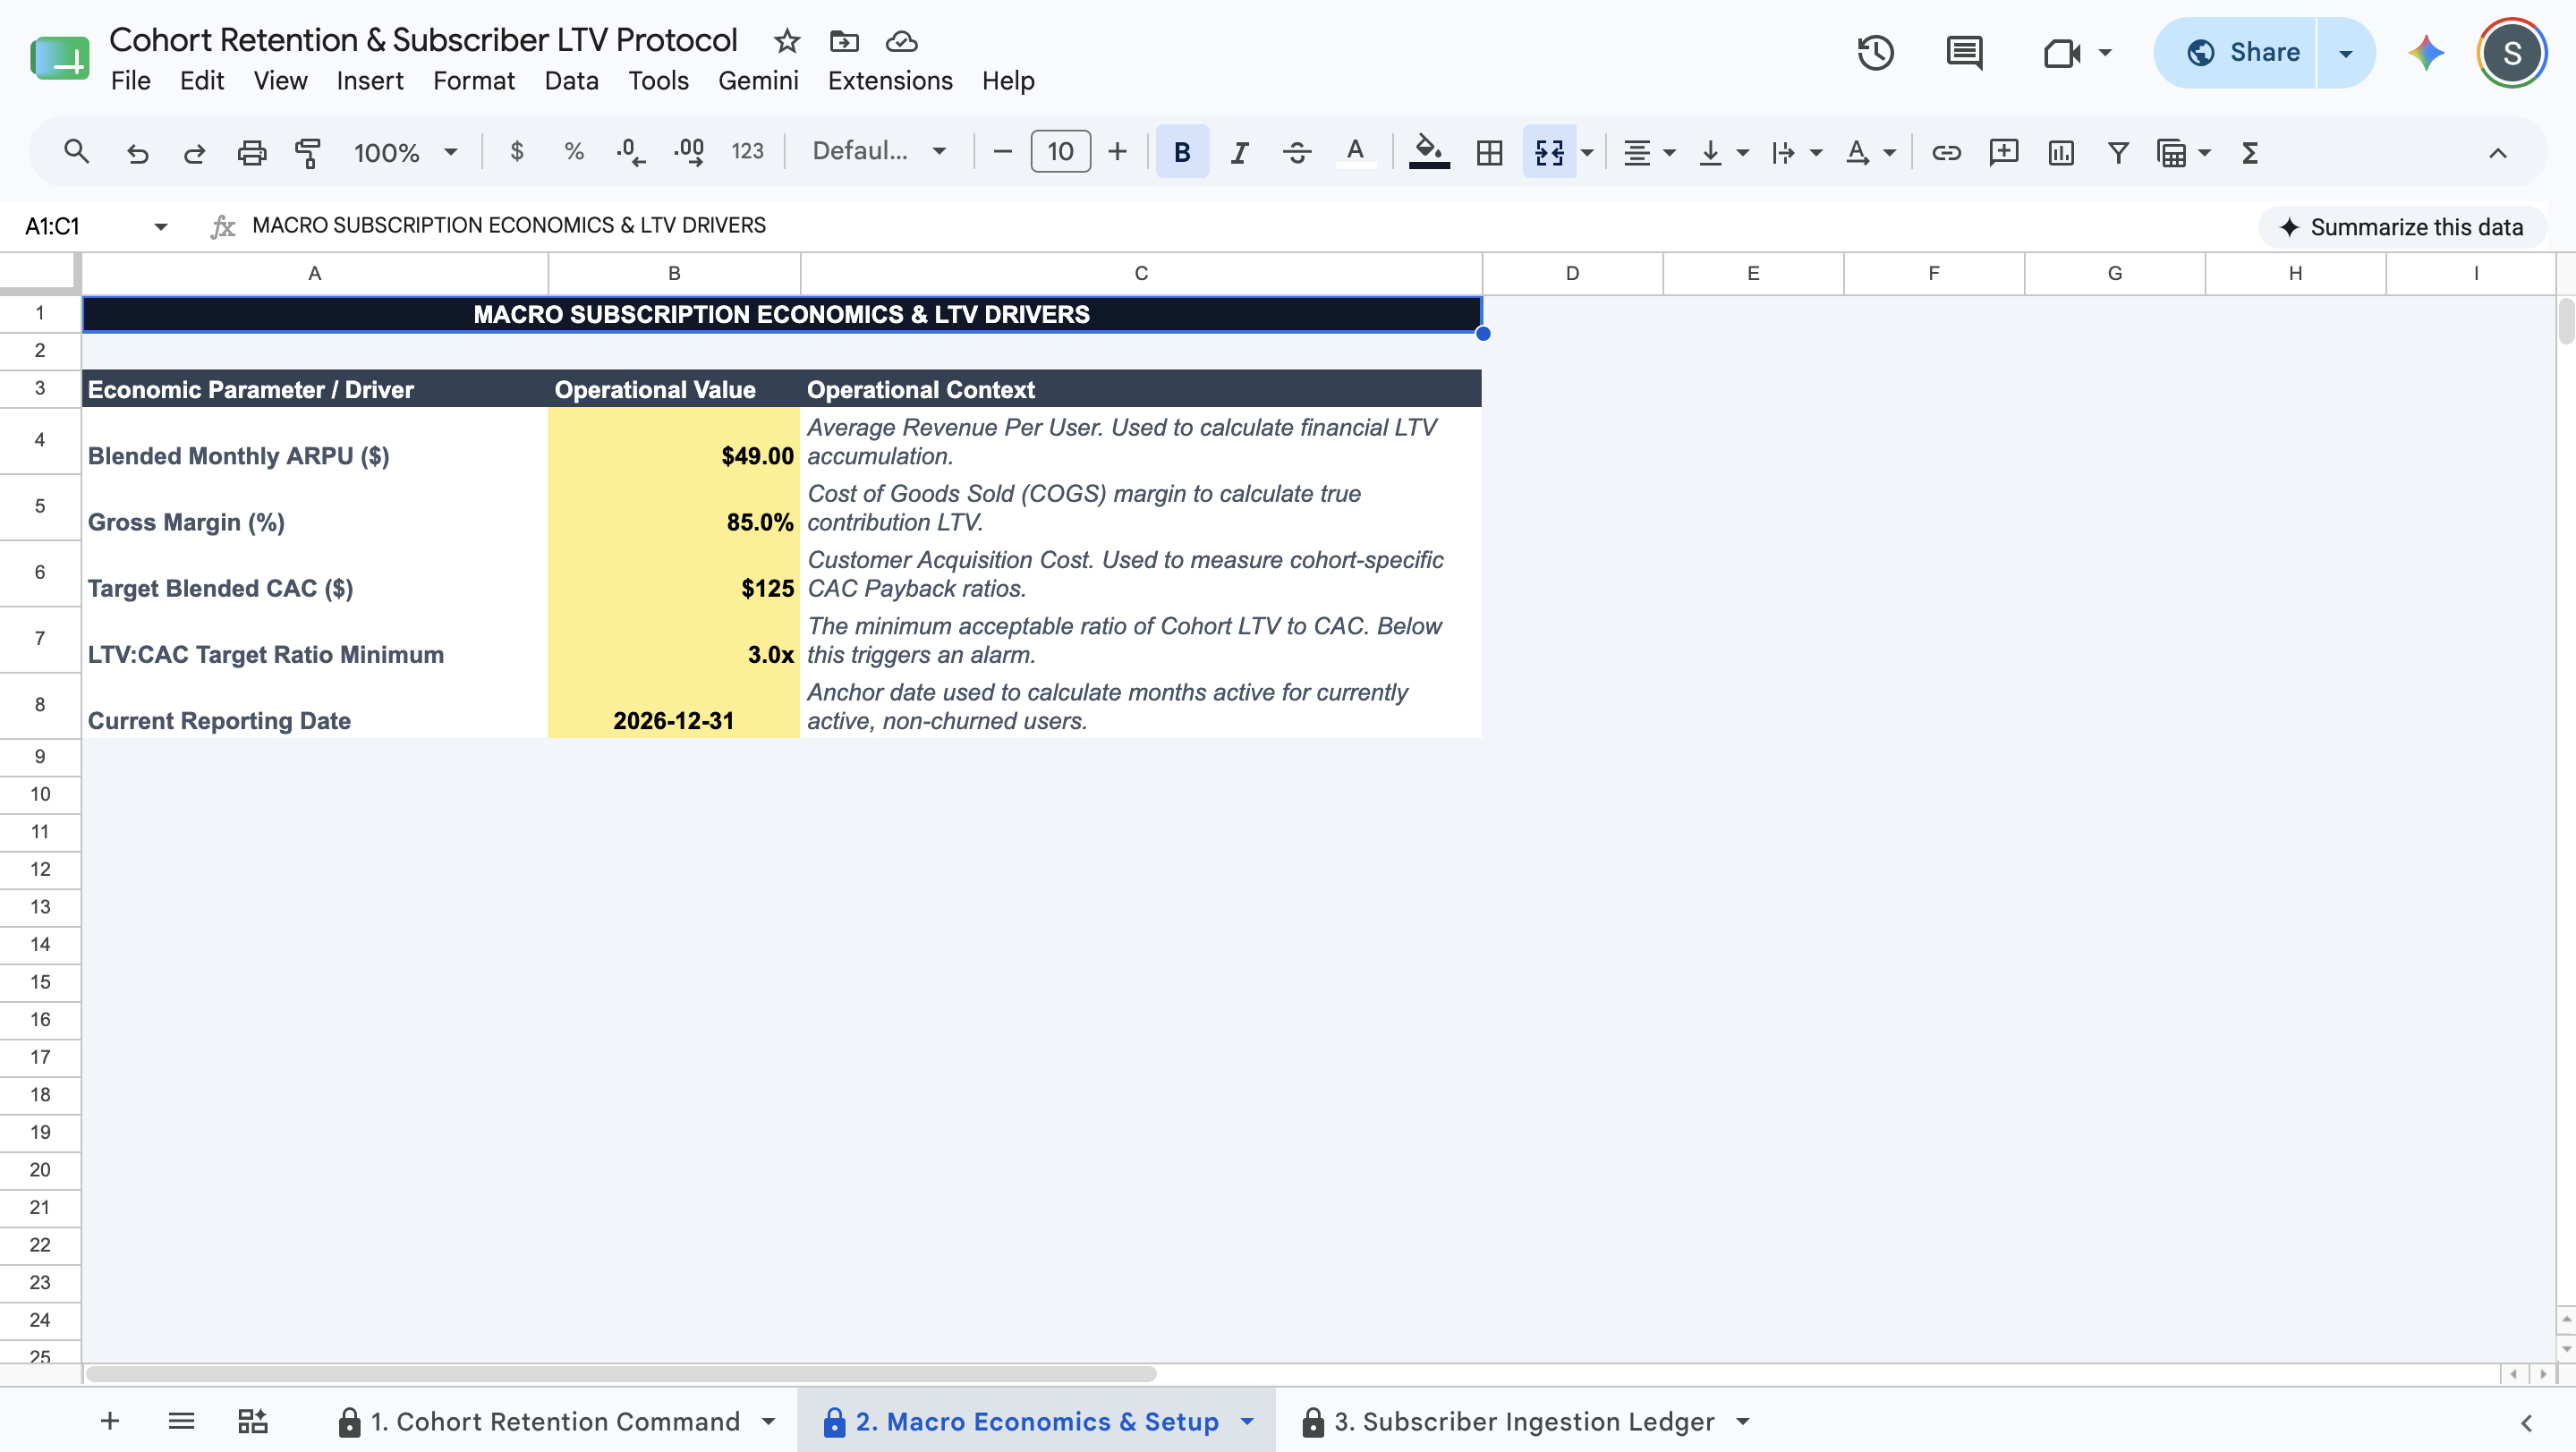
Automatically calculate Realized Cohort LTV ($) based on active user tenure, Blended ARPU, and Gross Margin (%)
Automate risk detection by triggering visual alarms for severe early defection (Month 3 Churn Cliffs)
Identify unprofitable acquisition classes by flagging cohorts that fail to clear target LTV:CAC payback ratios
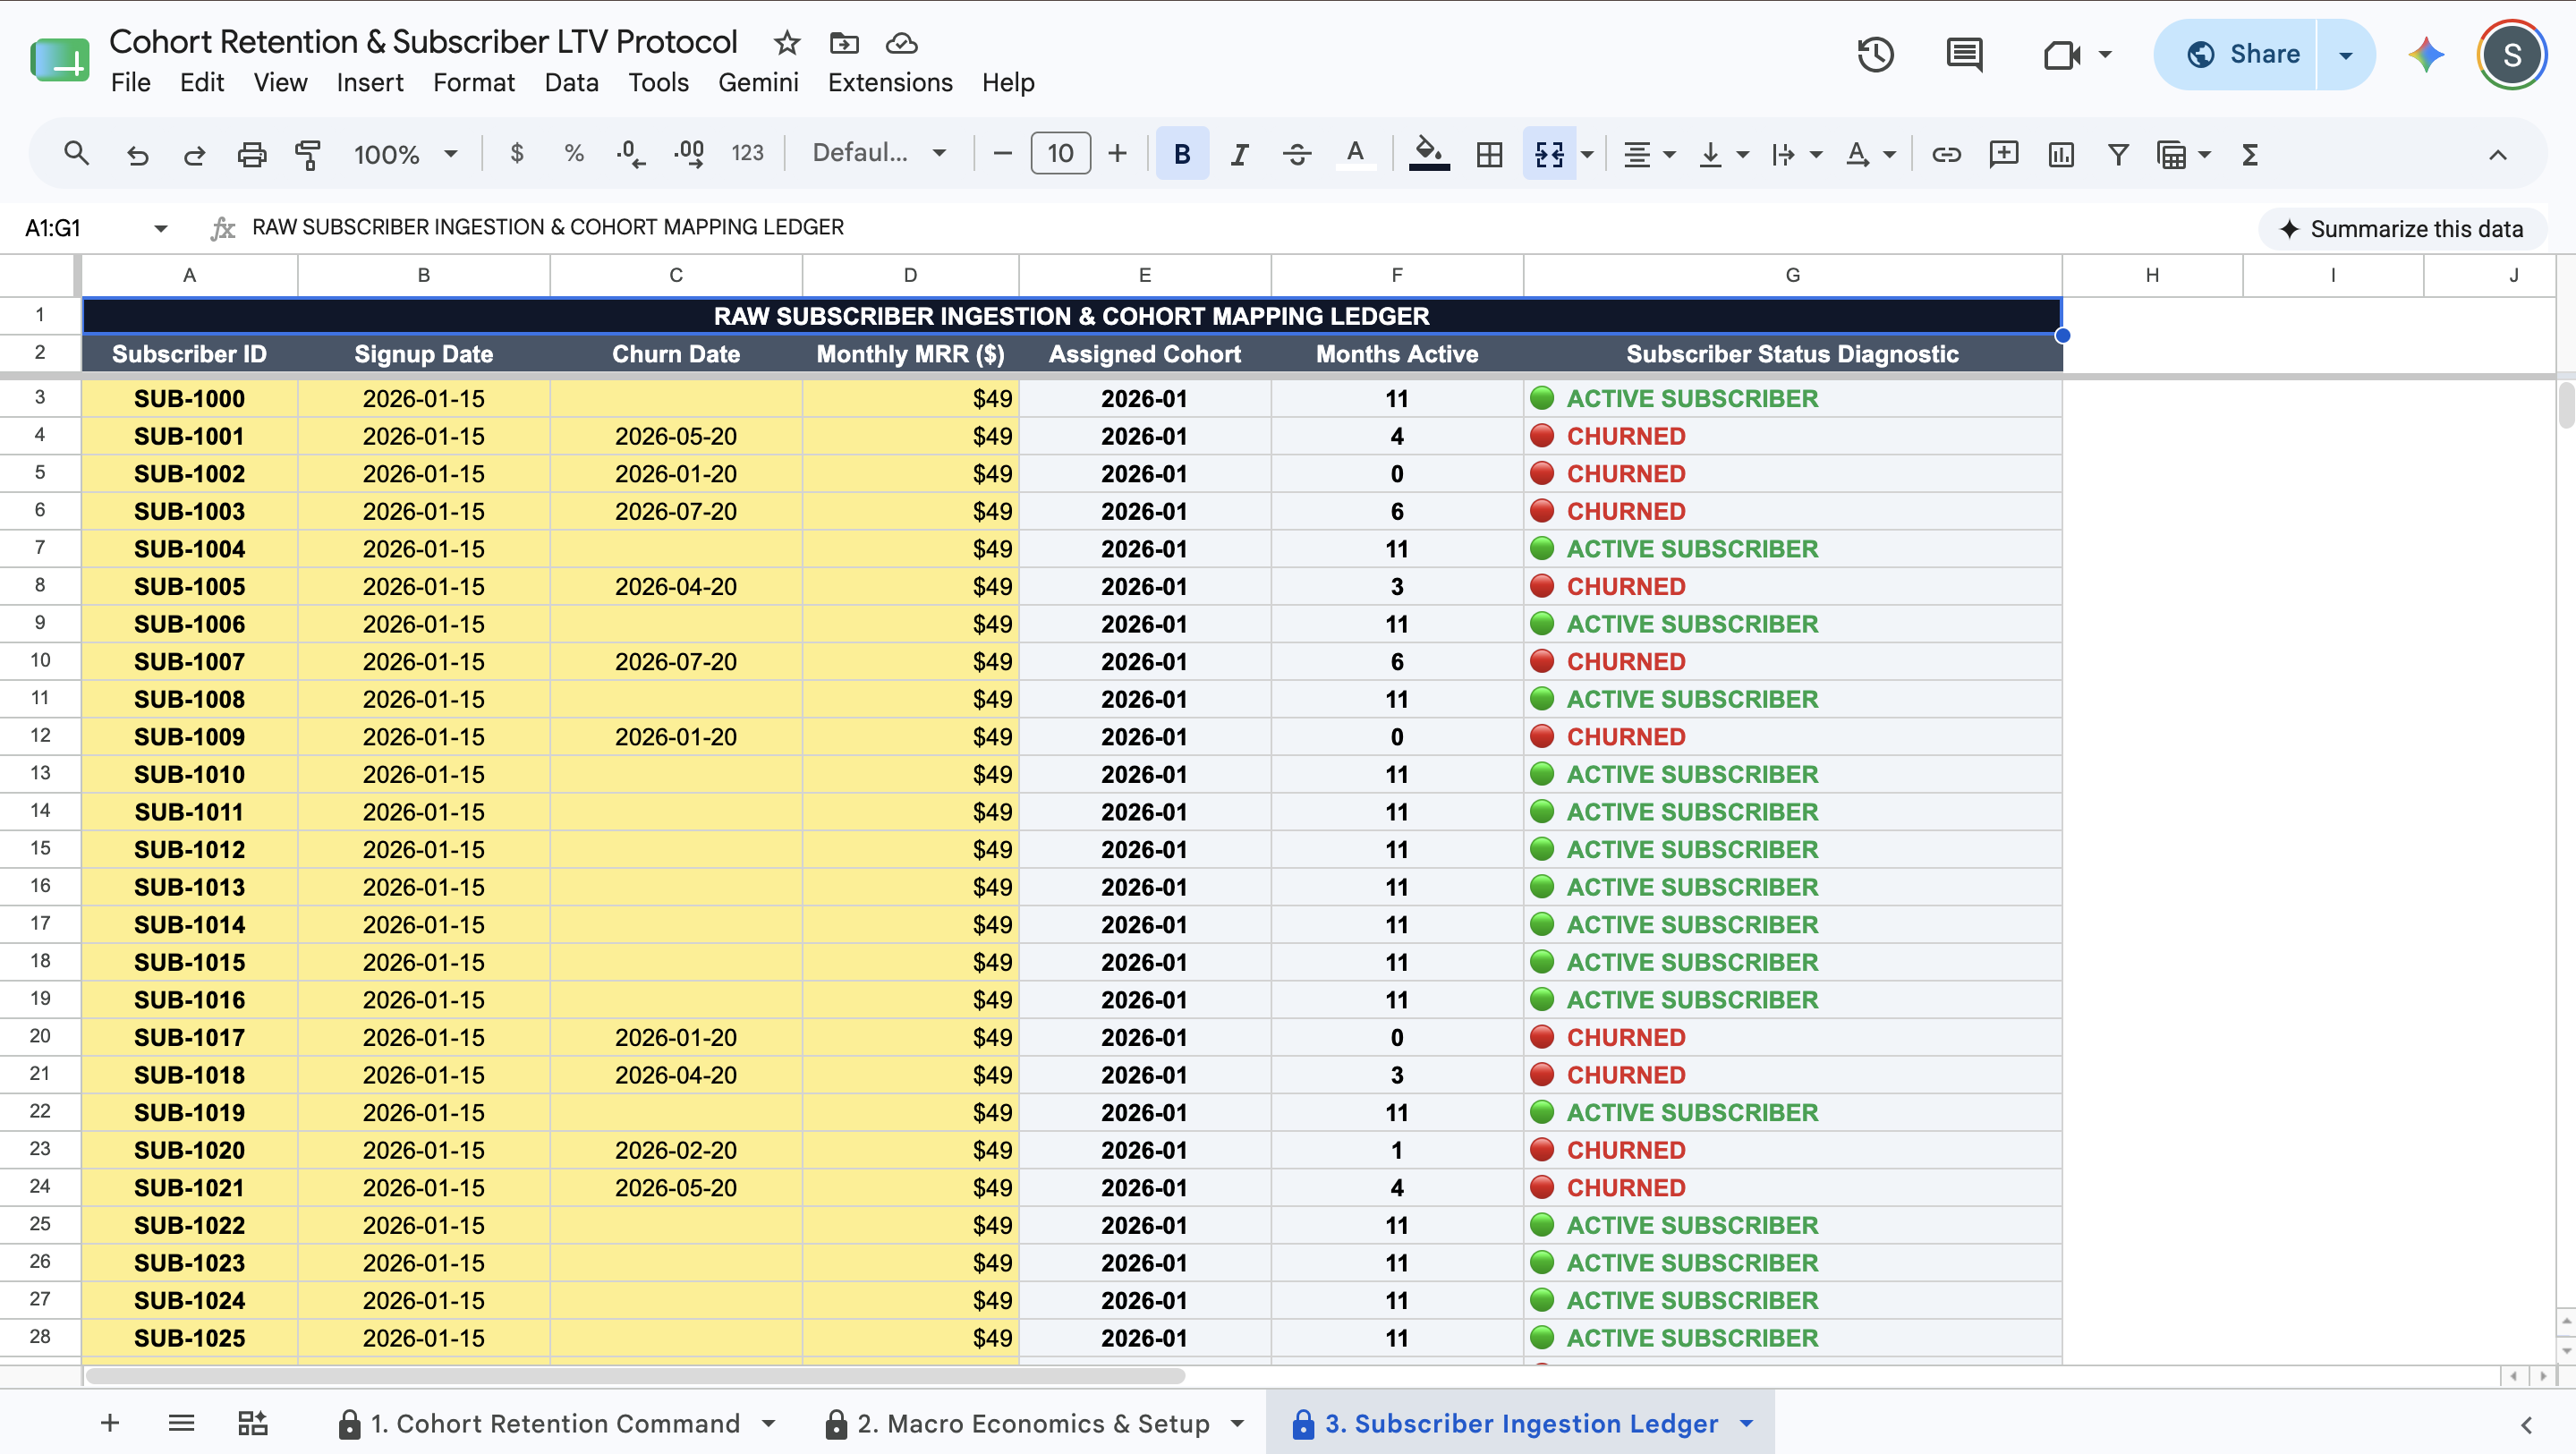
Eliminate manual spreadsheet pivot tables by dynamically converting raw subscriber signup/churn logs into cohort classes
Export an immutable, grid-free PDF retention memorandum to run growth syncs and board of director reviews
SaaS founders, growth leaders, and Chief Revenue Officers managing recurring subscription models
E-commerce and subscription box brands needing to evaluate the long-term quality of seasonal discount cohorts (e.g., Black Friday signups)
CFOs, venture capitalists, and private equity analysts conducting unit economics and retention due diligence on target companies
Scaling consumer subscription businesses looking to replace expensive, bloated analytics platforms with an institutional cloud spreadsheet
Traditional one-time transactional e-commerce businesses without recurring billing or repeat purchase tracking
Enterprise data science teams requiring real-time, bidirectional SQL warehouse pipelines (e.g., Snowflake, BigQuery)
Users looking for a standard Microsoft Excel (.xlsx) file workbook (This asset is built natively and exclusively for Google Sheets)
