Originally published: 30/04/2020 12:23
Publication number: ELQ-11992-1
View all versions & Certificate
Publication number: ELQ-11992-1
View all versions & Certificate

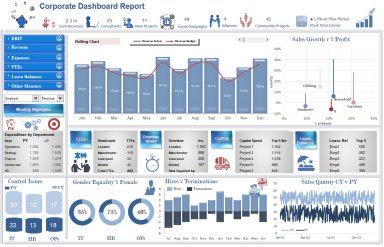
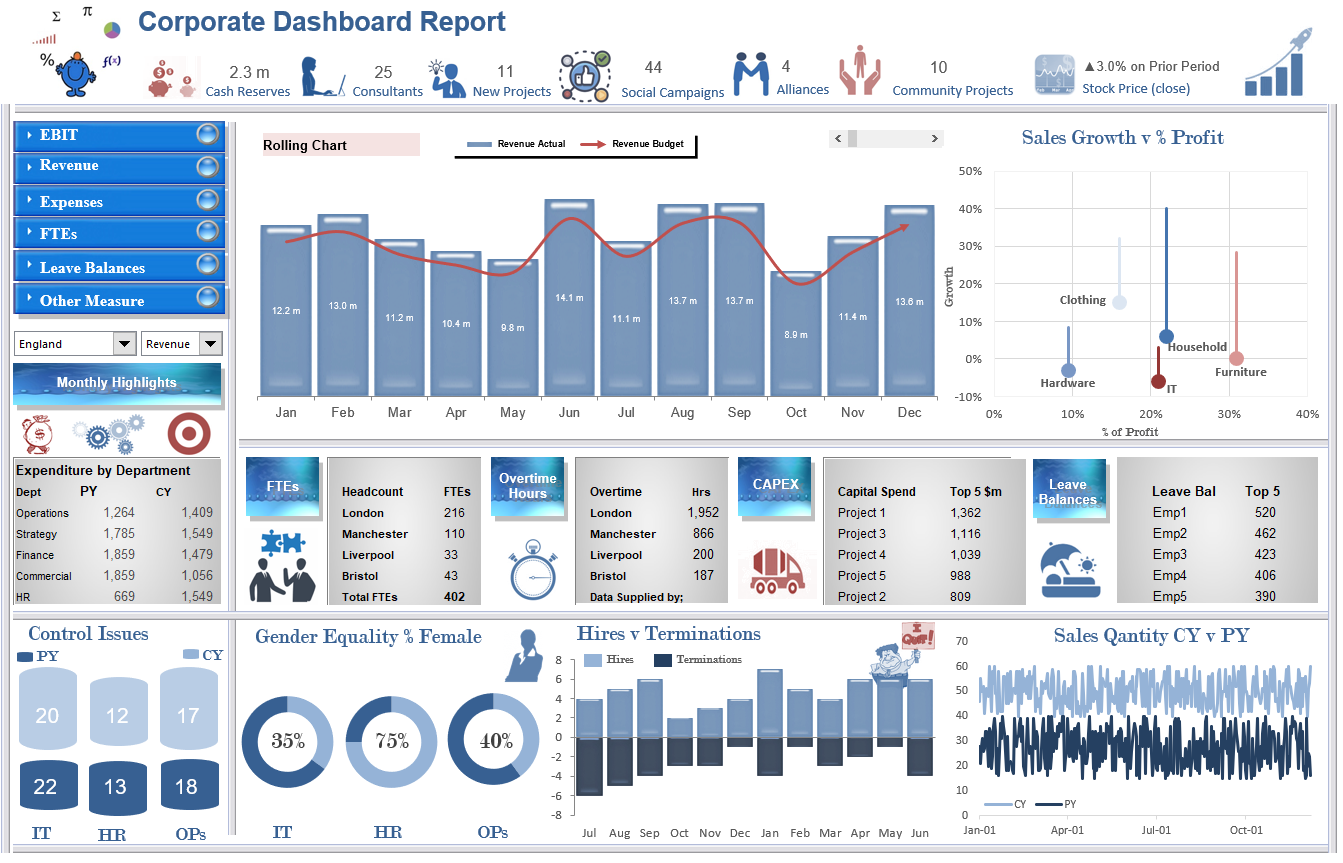
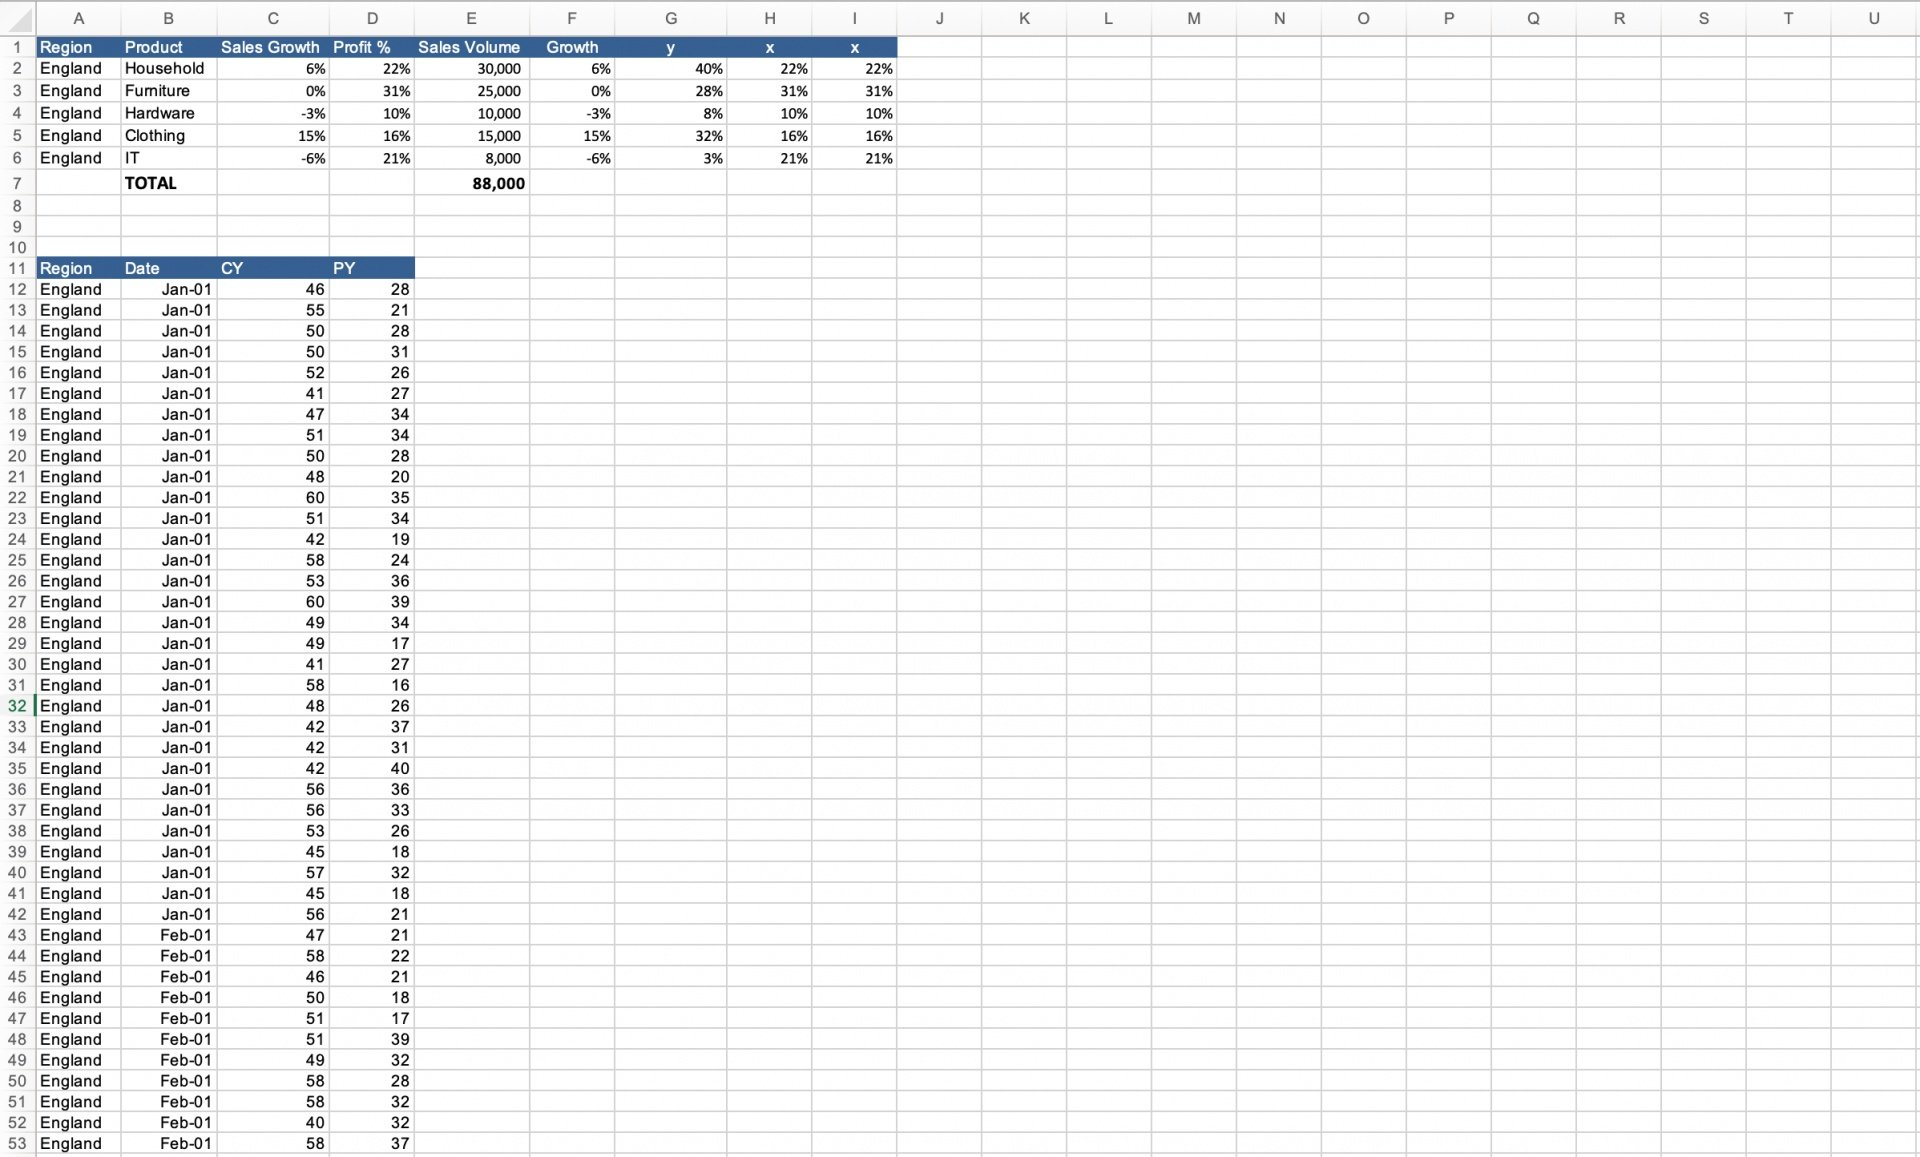
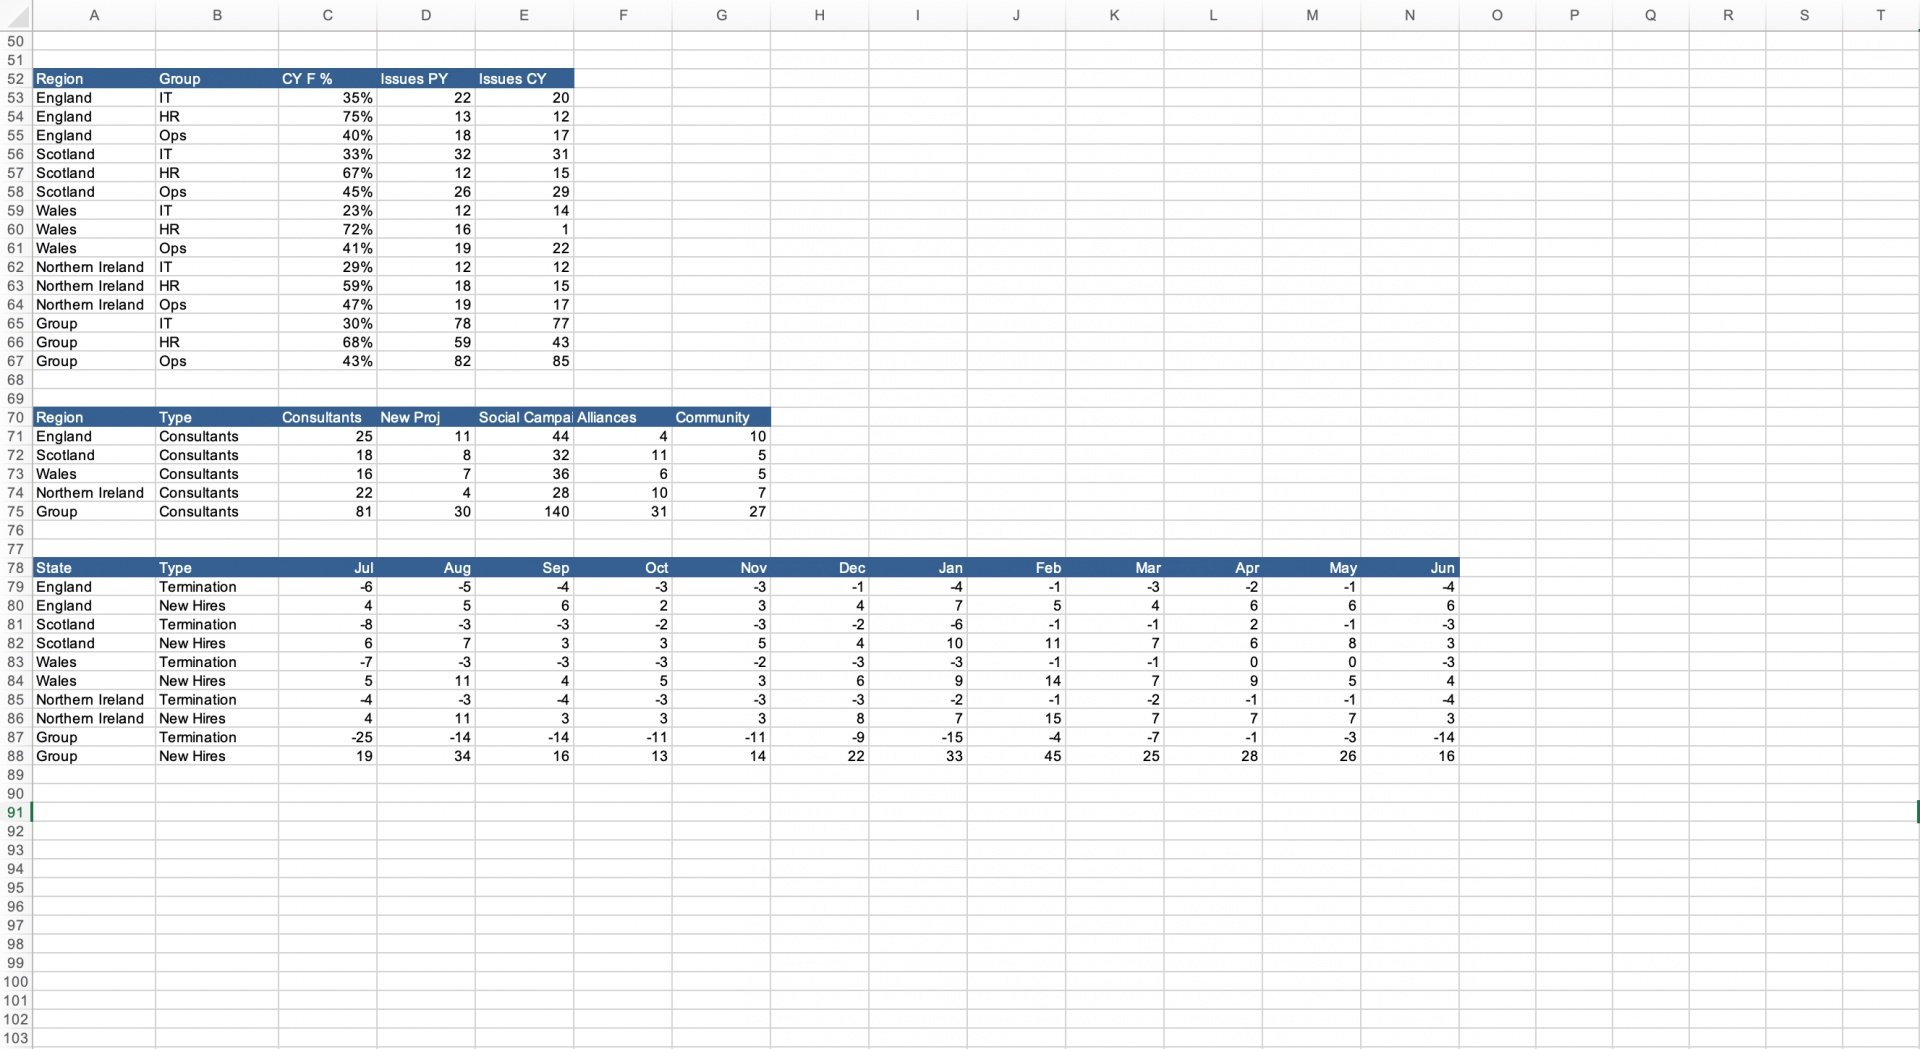
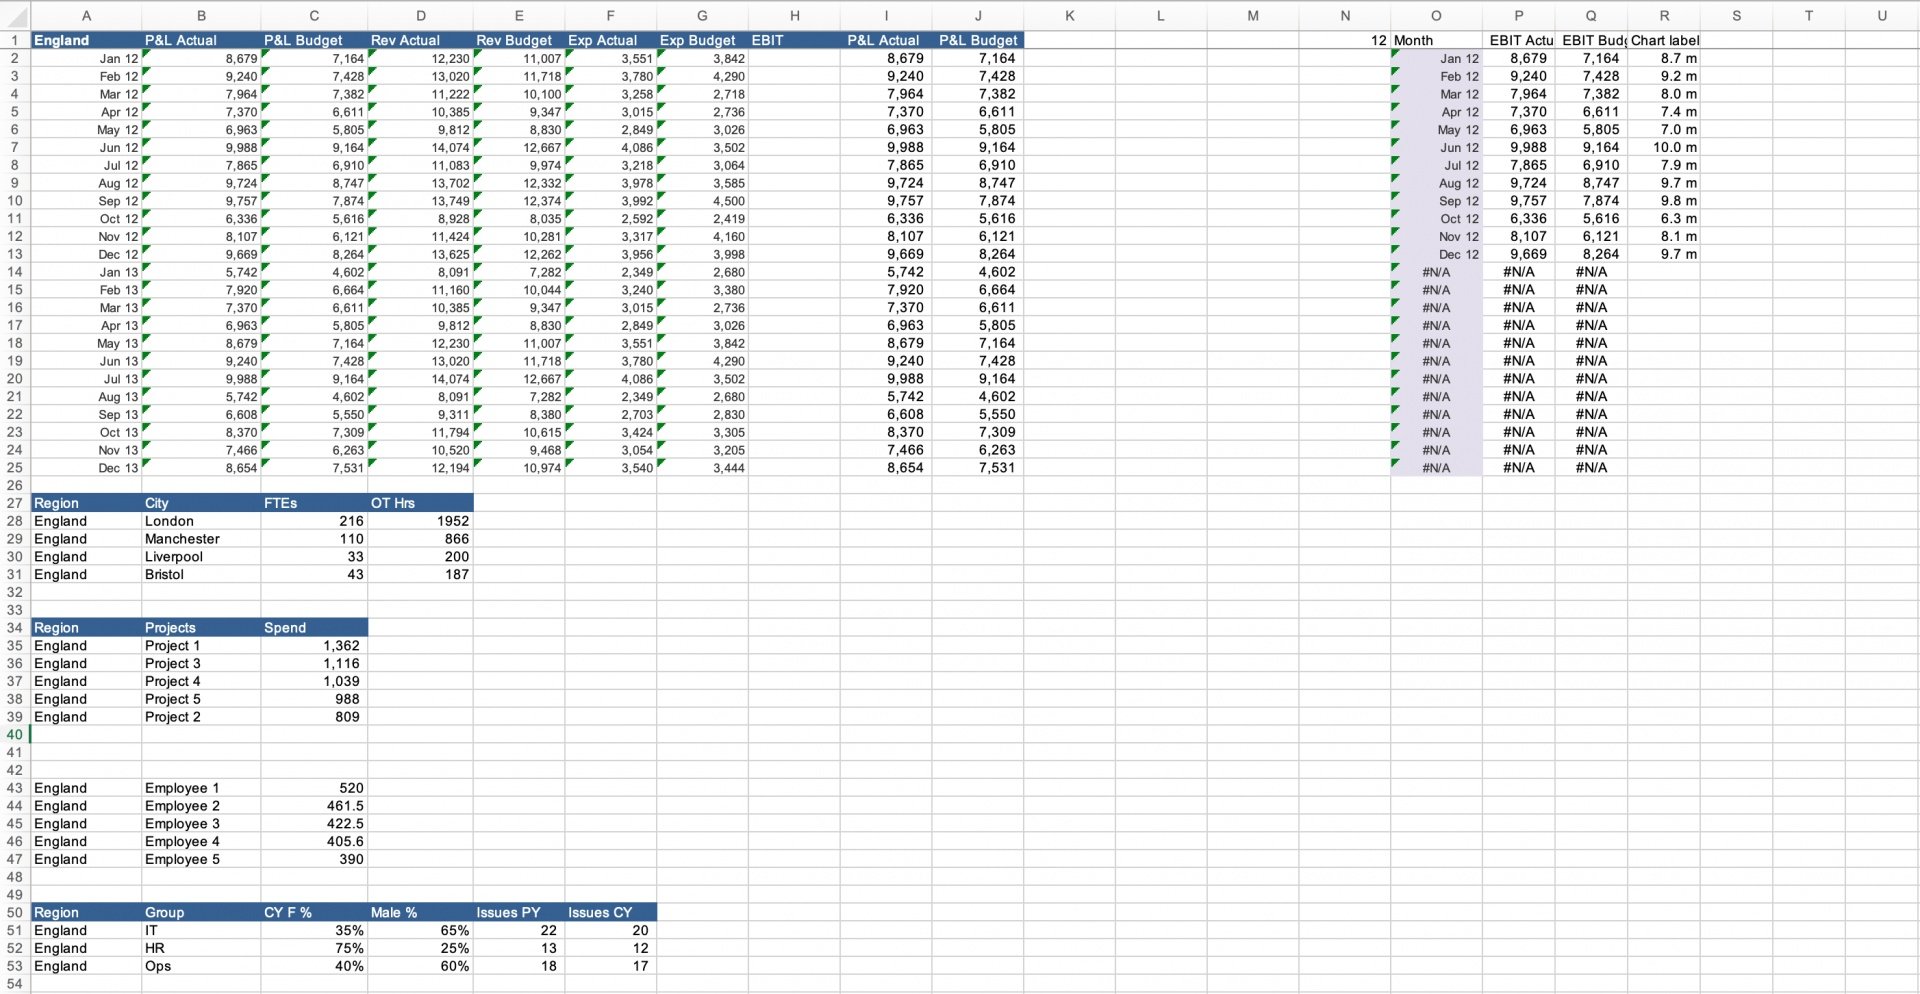
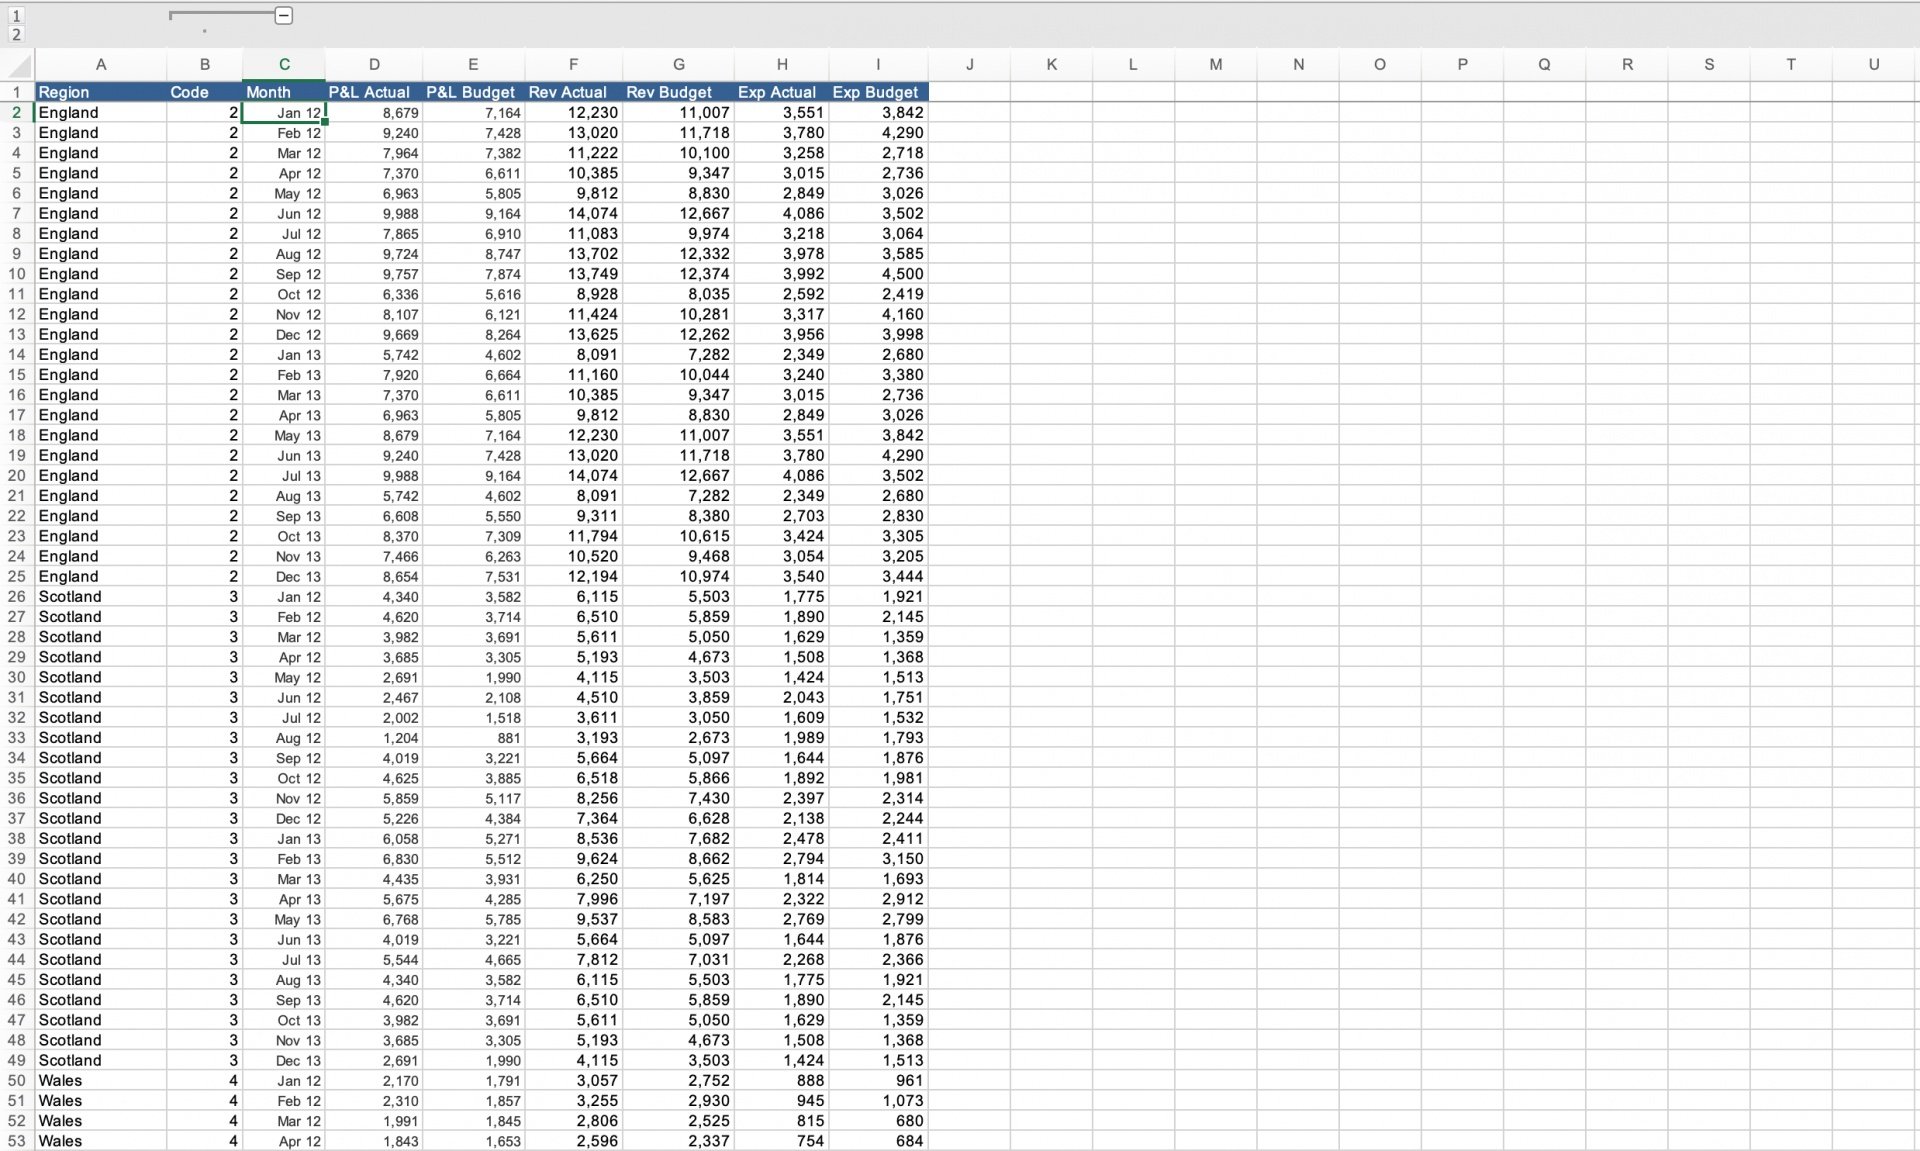
Corporate Excel Dashboard Model
This is a ready-to-use Key Performance Indicator Dashboard for a corporation.
Further information
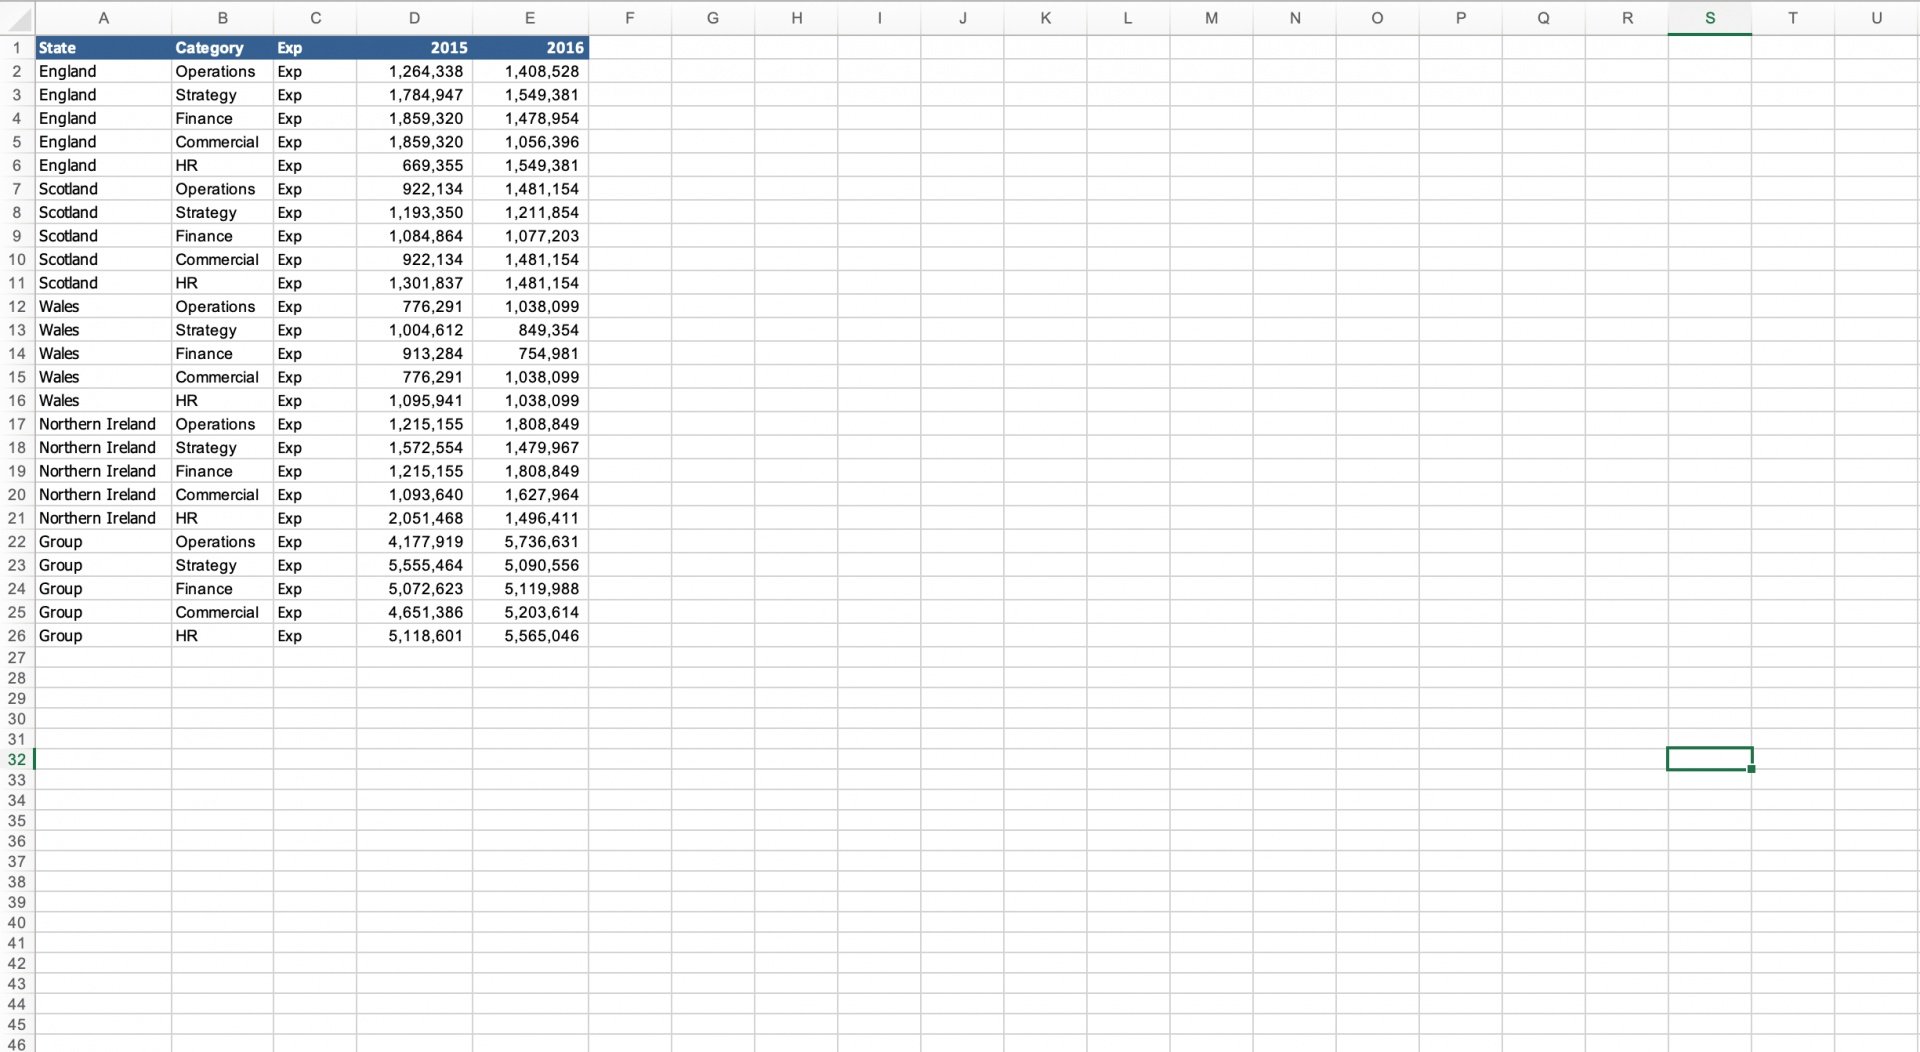
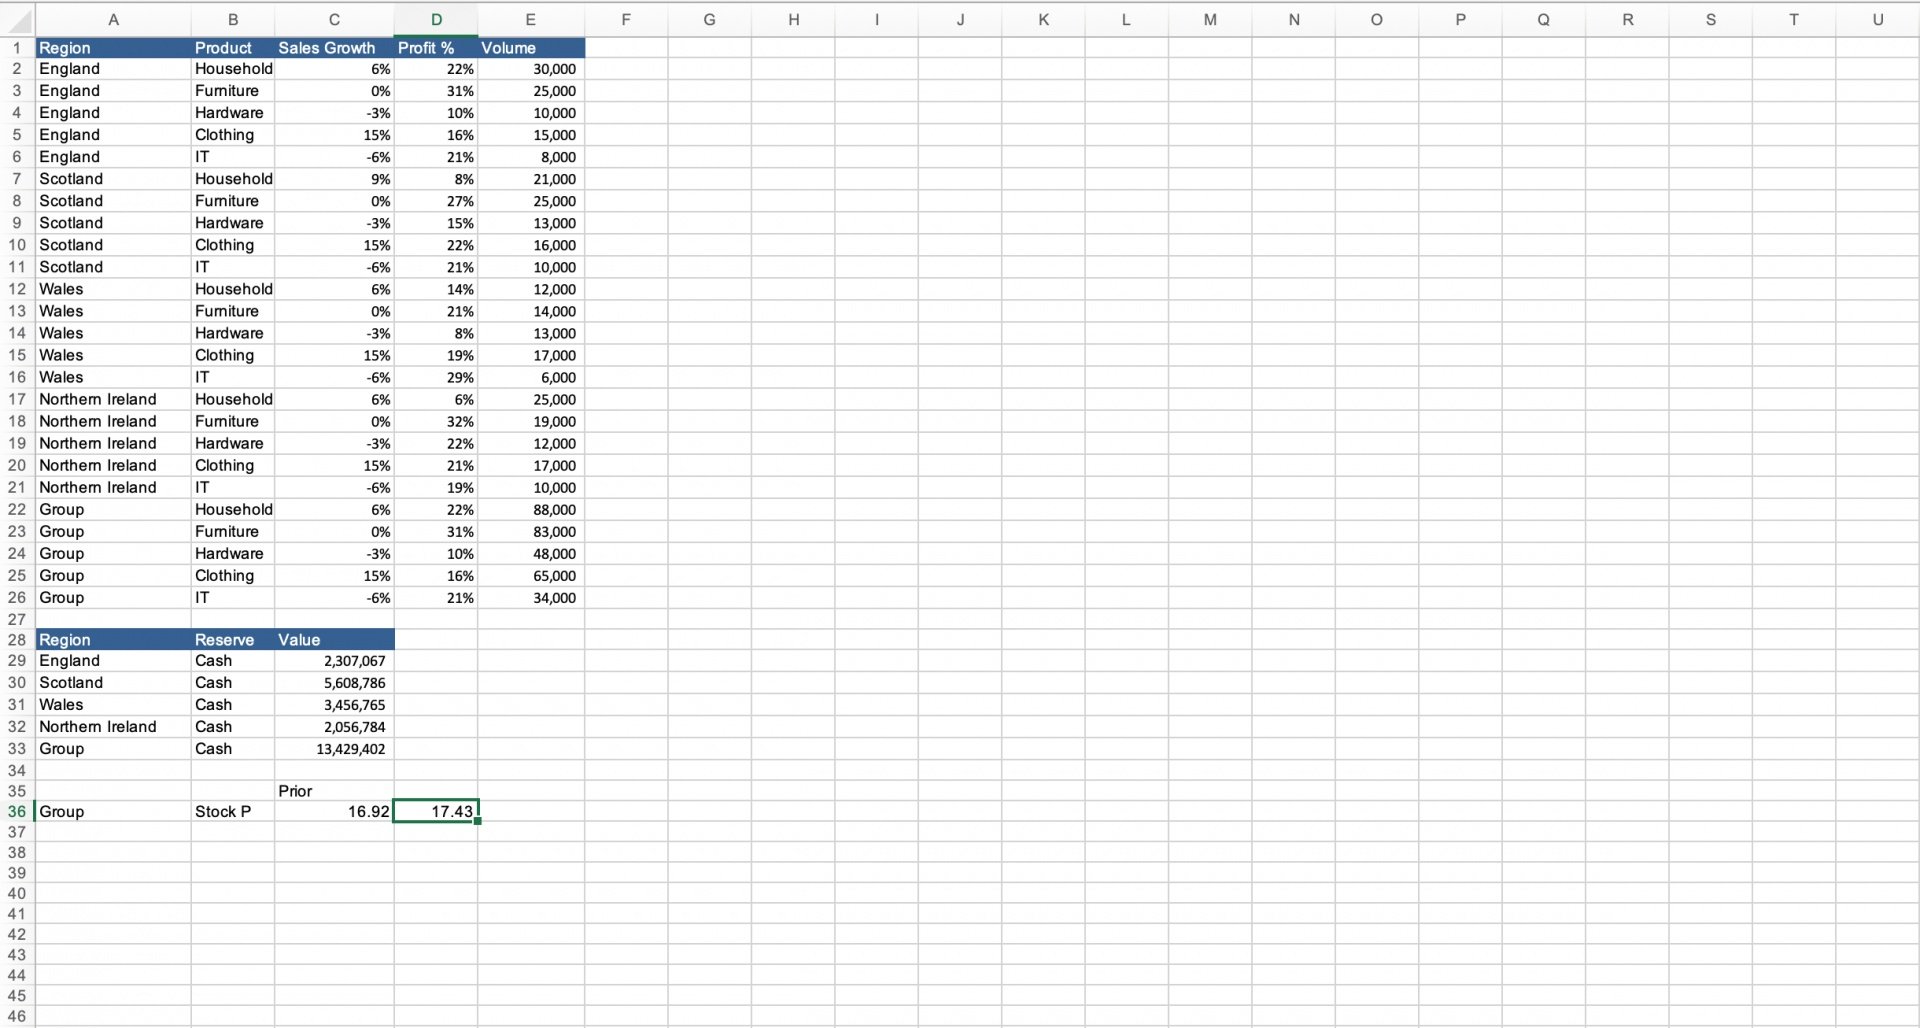
Should give people a starting point when preparing a financial model. If people copy the structure and layout of the model they should be in a healthy place.
