

Bankable Solar + BESS Financial Model
Originally published: 17/07/2026 20:22
Publication number: ELQ-45433-1
View all versions & Certificate
certified

Bankable Solar + BESS Financial Model

Transforming renewable energy projects into bankable, investor-ready financial opportunities.

Description

Introduction

Utility-scale renewable energy projects live or die by their financial models. Long before a single panel is installed or a battery container is delivered to site, a project's viability is tested, stress-tested, and negotiated inside a spreadsheet. Lenders size their debt off it. Sponsors calibrate their equity return expectations against it. Independent engineers and rating agencies pick it apart looking for optimistic assumptions or structural weaknesses.

The Solstice model was built to meet that standard: a fully linked, formula-driven, internationally bankable financial model for a utility-scale solar photovoltaic project paired with a Battery Energy Storage System (BESS), covering everything from first shovel in the ground through twenty-five years of commercial operation.

This is not a static projection or a set of hardcoded numbers dressed up to look like a model. Every cell that can be a formula is a formula. Every year is linked to the year before it. Change the PPA price, the interest rate, or the depreciation life in one place, and the effects ripple correctly through construction costs, tax calculations, debt sizing, cash flow, the balance sheet, and ultimately the investor returns — with the balance sheet still tying out to the cent. That internal consistency, more than any single number in it, is what makes a model "bankable."


Project Scope and Structure

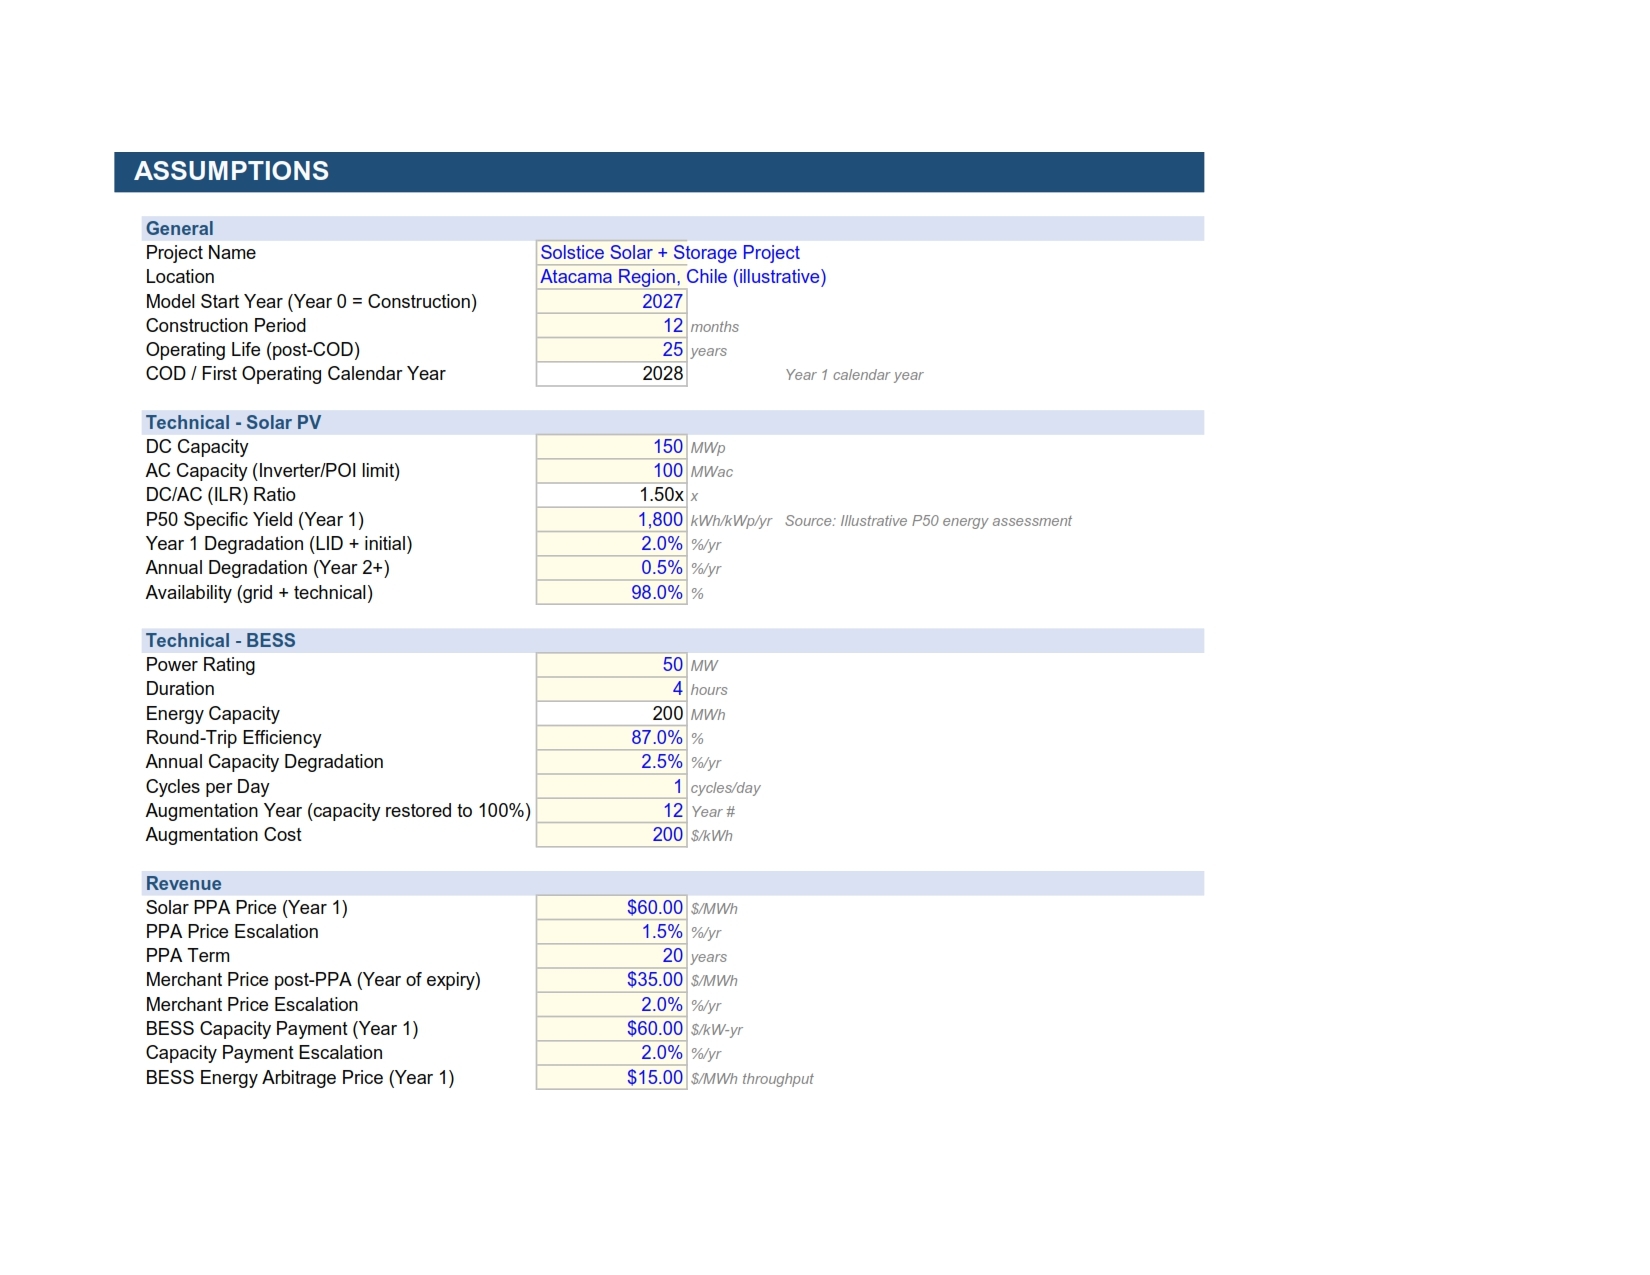
The illustrative project underpinning the model is a 150 MWp / 100 MWac solar PV plant paired with a 50 MW / 200 MWh battery storage system, located in an emerging international solar market (the Atacama region of northern Chile is used as the illustrative jurisdiction, chosen deliberately to keep the model's tax and incentive structure globally applicable rather than tied to any one country's rules).

The model runs on an annual periodicity across a Year 0 construction period followed by twenty-five years of commercial operation — twenty-six columns of linked calculation running across every worksheet in the book.

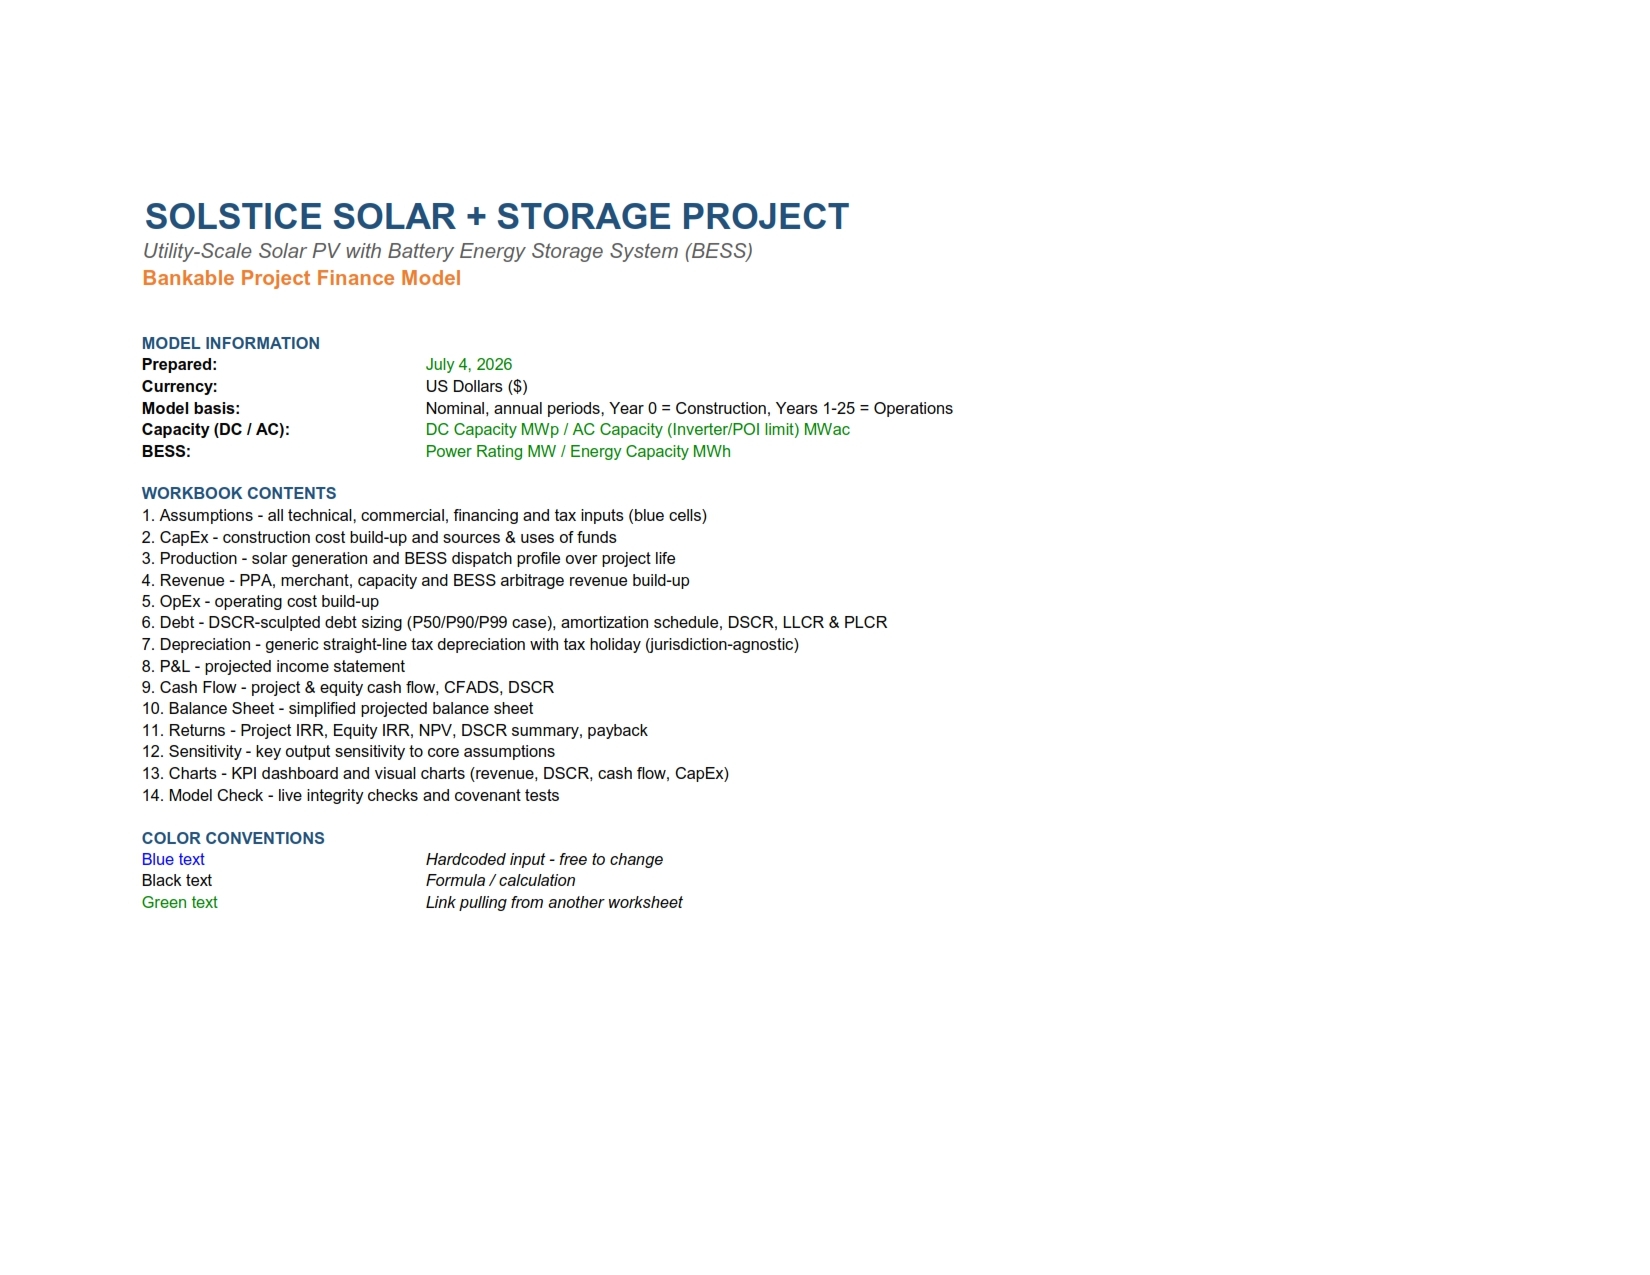
The workbook itself is organized into fifteen interlinked tabs, each with a clear and single responsibility:


  • Cover sheet for navigation and conventions

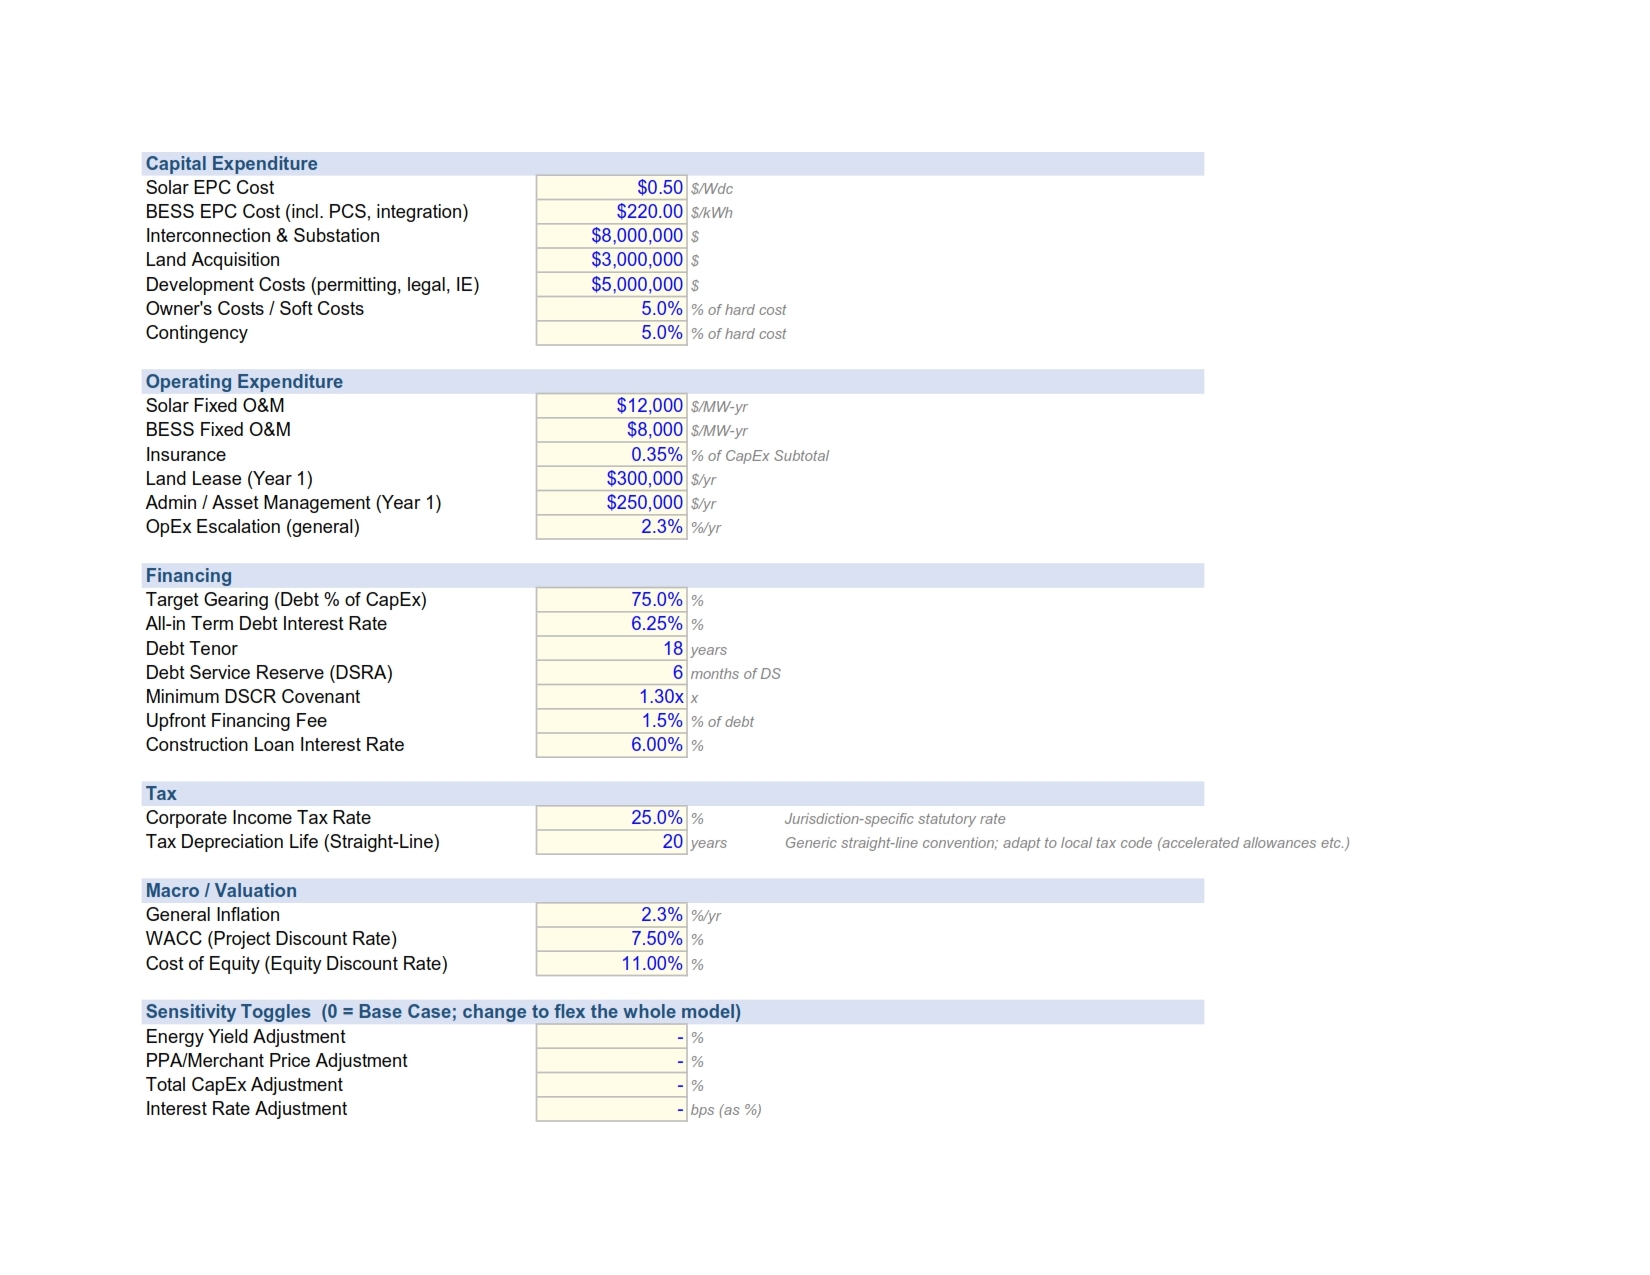
  • Assumptions tab holding every technical, commercial, financing, and tax input as a clearly marked blue cell

  • CapEx tab building up the full sources-and-uses of construction funds

  • Production and Revenue tabs modeling solar generation, battery dispatch, and the resulting revenue streams

  • OpEx tab for escalated operating costs

  • Debt tab handling debt sizing and amortization

  • Depreciation tab for tax calculations

  • P&L, Cash Flow, and Balance Sheet tabs forming the core three-statement engine

  • Returns tab summarizing the headline investment metrics

  • Sensitivity tab for stress-testing

  • Charts tab providing a visual dashboard

  • Model Check tab that runs a suite of live integrity tests on the model every time it recalculates


The Case for DSCR Sculpting

Perhaps the single most important structural decision in the model is how debt gets sized. A naive approach — and one used in many simpler renewable energy models — sizes debt as a flat percentage of construction cost (a "gearing cap") and then checks, almost as an afterthought, whether the resulting debt service coverage ratio clears the lender's covenant. That approach gets the mechanics backwards. In real project finance, debt capacity is a function of the cash flow available to service it, not the other way around.

The Solstice model instead implements true DSCR sculpting. For every operating year, it calculates a "Sizing CFADS" — cash flow available for debt service — using a deliberately conservative version of the project's cash flow that strips out the interest tax shield entirely, precisely so that the calculation does not become circular (debt size would otherwise depend on interest expense, which depends on debt size). From that Sizing CFADS series, the model computes the annual debt service the project could sustain while holding a constant target DSCR, discounts that payment stream back to present value at the cost of debt, and arrives at a debt capacity figure. The actual debt drawn is the lesser of that DSCR-sculpted capacity and a maximum gearing cap set by the sponsor — with the model showing explicitly, in a labeled cell, which constraint is binding in any given scenario.

When gearing binds, the DSCR comes out comfortably above target, exactly as a well-structured deal should. When the DSCR constraint binds instead, the model's internal scaling factor lands precisely at 1.0, confirming the sculpting math is self-consistent — a check that is itself one of the automated tests on the Model Check tab.


Cover Ratios and Energy Certainty

Two further metrics that any international lender's term sheet will demand are the Loan Life Cover Ratio (LLCR) and the Project Life Cover Ratio (PLCR) — the net present value of future cash flow available to service debt, measured respectively over the remaining loan tenor and over the full remaining project life, each divided by the outstanding debt balance at financial close. Both are computed directly in the model and checked against configurable minimum covenants, alongside the more familiar annual DSCR.

Underpinning all of this is an explicit treatment of energy production uncertainty. Solar resource assessments are never expressed as a single number in professional practice; they are expressed as exceedance probabilities — P50 (the median expected outcome), P90 (the output level exceeded in ninety years out of a hundred), and P99 (an even more conservative downside case). The model lets the user select which of these three cases drives debt sizing through a simple dropdown, while the base-case revenue and equity return calculations always remain anchored to the P50 outcome. This mirrors exactly how a real transaction is structured: sponsors and their equity investors think in terms of the expected case, while senior lenders size their exposure off a deliberately conservative downside case, creating a cushion between the two.


Built for International, Not Domestic, Deployment

An earlier design pass through this model included several distinctly American tax constructs — accelerated MACRS depreciation schedules and the federal Investment Tax Credit chief among them. Both have been deliberately removed. In their place, the model now uses a generic straight-line depreciation convention over a configurable asset life, alongside a configurable tax holiday period — a far more common and internationally recognizable incentive structure used across many emerging solar markets. The corporate tax rate itself is treated as a jurisdiction-specific input rather than defaulting to a U.S. statutory figure. The result is a model whose tax and incentive architecture can be redirected to almost any target jurisdiction by changing a handful of assumption cells, rather than one whose fundamental calculation logic is implicitly tied to a single country's tax code.


Validation as a First-Class Feature

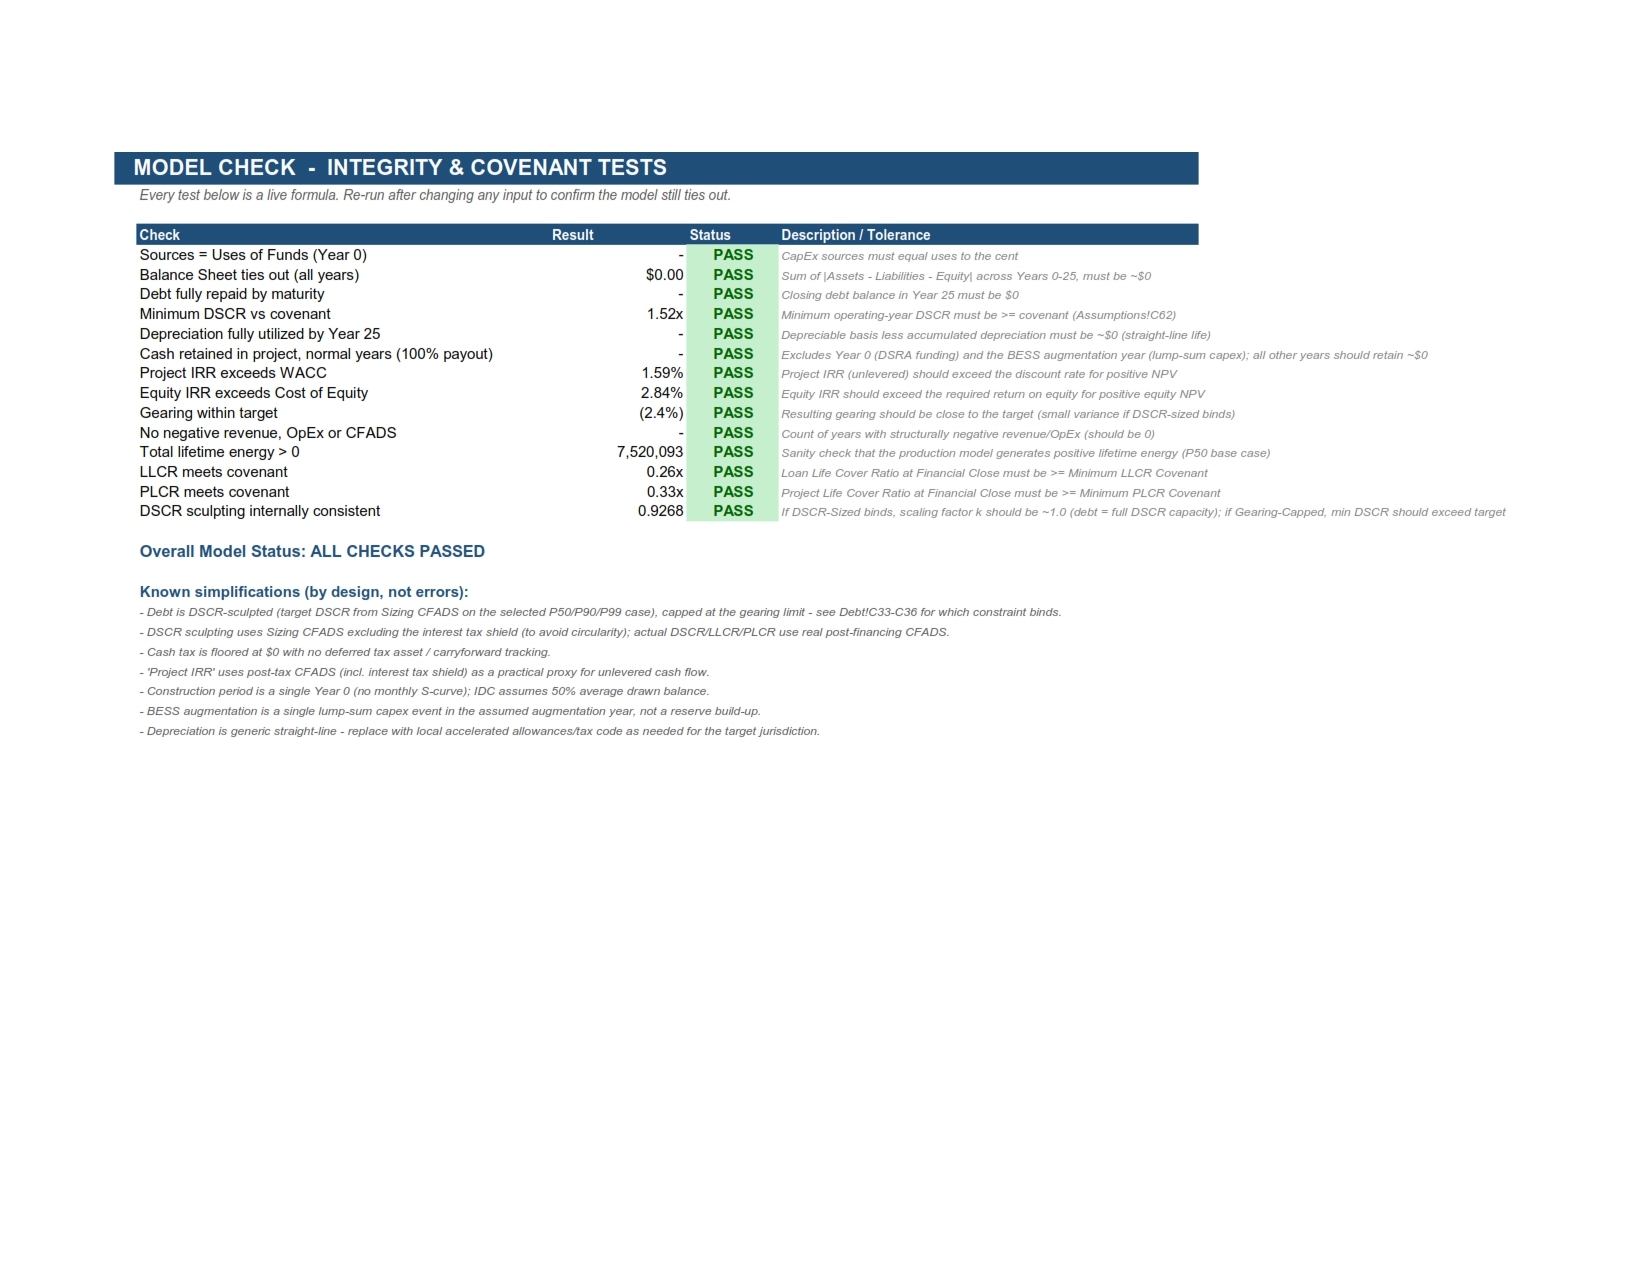
A financial model that cannot prove its own internal consistency is not a bankable model, no matter how sophisticated its formulas look. The Model Check tab treats validation as a feature in its own right rather than an afterthought. Fourteen live, formula-driven tests run automatically:


  • Sources equal uses of funds at financial close

  • The balance sheet ties out to the cent across all twenty-six years

  • The debt schedule fully amortizes to zero by maturity

  • The minimum operating-year DSCR clears its covenant

  • Accumulated depreciation fully exhausts the depreciable basis on schedule

  • Retained cash under the model's dividend policy nets to zero outside of two clearly-flagged and expected exceptions (the initial funding of the debt service reserve account and the lump-sum battery augmentation event)

  • Both cover ratios clear their respective covenants

  • The DSCR sculpting mechanism is shown to be internally coherent


Every test reports PASS, FAIL, or WARN with color-coded conditional formatting and a single overall status banner, so a reviewer can tell at a glance — without reading a single formula — whether the model is structurally sound.


Visual Presentation

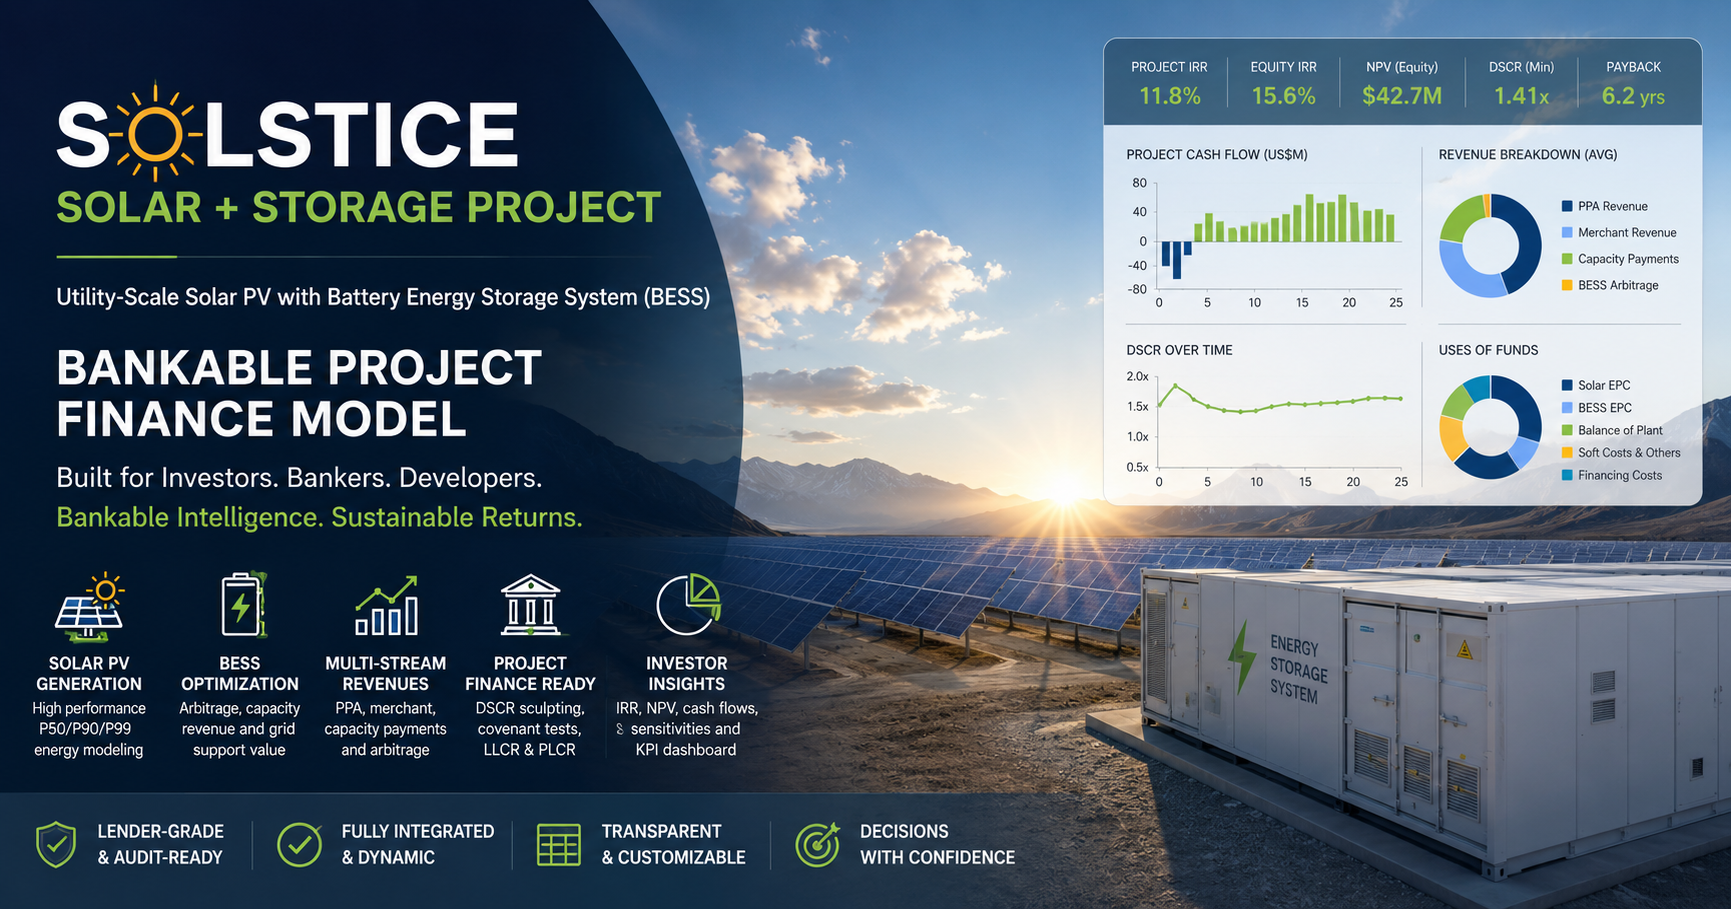
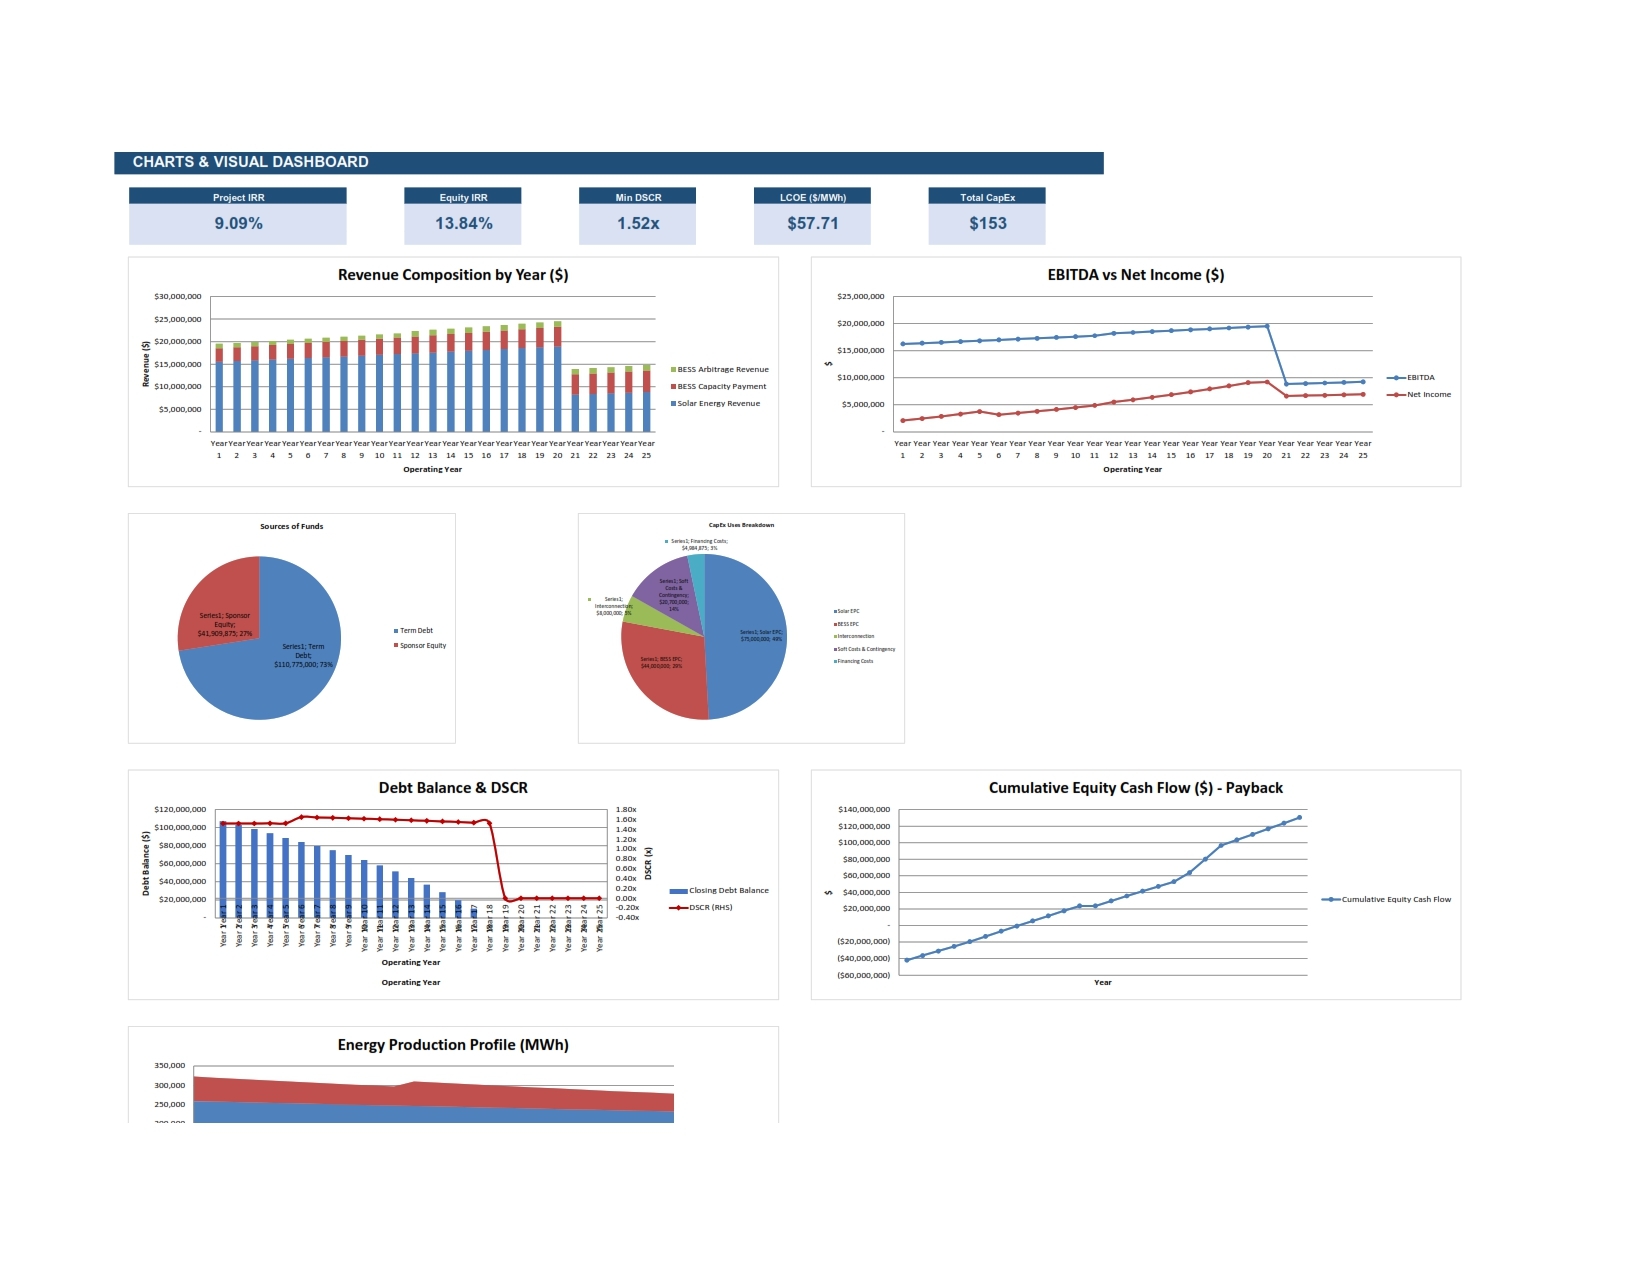
The model's Charts tab distills its results into a KPI dashboard and seven native, fully linked Excel charts:


  • Revenue composition by year

  • EBITDA against net income

  • Sources and uses of capital

  • The debt balance running alongside its DSCR on a secondary axis

  • The cumulative equity cash flow curve showing the investment payback point

  • The year-by-year production profile split between solar and battery discharge


Every chart recalculates automatically as assumptions change, and the workbook has been formatted for clean, presentation-ready PDF export — with print titles, appropriately scaled paper sizes, and repeating label columns so that even the widest twenty-six-year statements print legibly across multiple pages rather than collapsing into illegible text on a single sheet.


Conclusion

The Solstice model is offered as a demonstration of what a genuinely bankable renewable energy financial model looks like under the hood: not a black box of hardcoded assumptions, but a transparent, fully-linked calculation engine built around the same debt sizing logic, cover ratio discipline, and energy certainty framework that international lenders, multilateral development banks, and export credit agencies actually require before they will commit capital to a project.

It is intended as a flexible starting point — every blue input cell is a lever the user is free to pull to reflect a different market, a different capital structure, or a different technology mix — resting on a calculation architecture that has been deliberately built to hold together under that kind of scrutiny.

This Best Practice includes
1 PDF file and 1 MS Excel Workbook

Acquire business license for $250.00

Add to cart

Add to bookmarks

Discuss

Further information

1. Assess Project Bankability
To evaluate whether the solar PV and battery energy storage project generates sufficient and predictable cash flows to satisfy lender, investor, and sponsor requirements.

2. Determine Financial Viability
To establish the economic attractiveness of the project through key financial metrics such as IRR, NPV, payback period, and Levelized Cost of Energy (LCOE).

3. Optimize Capital Structure
To determine the optimal debt-to-equity mix that minimizes financing costs while maintaining acceptable risk and compliance with lender covenants.

4. Evaluate Revenue Potential
To quantify projected revenues from multiple income streams including power purchase agreements (PPAs), merchant energy sales, capacity payments, and battery energy arbitrage.

5. Analyze Debt Service Capacity
To assess the project’s ability to service debt obligations using lender-focused metrics such as DSCR, LLCR, and PLCR, ensuring sustainable debt repayment throughout the loan tenor.

6. Forecast Long-Term Cash Flows
To project annual operating cash flows over the full project lifecycle, accounting for generation degradation, operating costs, taxation, maintenance capex, and financing obligations.

7. Support Investment Decision-Making
To provide sponsors, equity investors, lenders, and strategic partners with reliable financial insights for investment appraisal and capital allocation decisions.

8. Perform Scenario and Sensitivity Analysis
To stress-test project performance against changes in key assumptions such as energy yield, tariff, capex, inflation, and interest rates, thereby quantifying downside and upside risks.

9. Facilitate Fundraising and Financial Close
To provide a transparent, auditable, and lender-ready model that supports due diligence, debt raising, investor presentations, and financial close negotiations.

10. Enhance Strategic Project Planning
To serve as a decision-support tool for optimizing project design, operational strategy, commercial structuring, and long-term value creation.

These objectives position the model not merely as a spreadsheet, but as a strategic investment decision tool for bankable renewable energy infrastructure development.

1. Utility-Scale Renewable Energy Projects
Best suited for medium to large-scale solar PV projects integrated with Battery Energy Storage Systems (BESS), typically ranging from tens to hundreds of megawatts.

2. Project Finance Transactions
Most applicable where projects are financed using non-recourse or limited-recourse project finance structures, requiring detailed lender-grade financial analysis.

3. Long-Term Revenue Visibility
Performs best where revenue streams are supported by Power Purchase Agreements (PPAs), capacity contracts, merchant markets, or ancillary service revenues with reasonably predictable pricing.

4. Debt-Financed Infrastructure Developments
Ideal for projects involving significant leverage where debt sizing, amortization sculpting, and covenant testing using DSCR, LLCR, and PLCR are critical.

5. Bankability and Due Diligence Requirements
Highly suitable for projects undergoing financial close, lender due diligence, investor fundraising, acquisition valuation, or refinancing.

6. Markets with Established Regulatory Frameworks
Most effective in jurisdictions with relatively stable energy regulation, tariff structures, taxation, and grid interconnection frameworks.

7. Projects Requiring Scenario Analysis
Particularly valuable where developers need to evaluate sensitivities around **energy yield, capex, tariff movements, inflation, interest rates, and storage performance degradation.

8. Hybrid Energy Systems with Multiple Revenue Streams
Best applied where BESS contributes value through energy shifting, peak shaving, arbitrage, reserve capacity, or ancillary grid services.

9. Medium- to Long-Term Asset Life
Designed for infrastructure assets with operating lives of 15–30 years, where lifecycle cash flow forecasting materially impacts investment decisions.

10. Institutional Investment Evaluation
Especially useful for infrastructure funds, DFIs, private equity investors, utilities, banks, and strategic energy developers requiring robust investment-grade analysis.

1. Small-Scale or Distributed Energy Projects
The model is not ideally suited for rooftop solar, mini-grids, residential storage, or small commercial installations, where project finance complexity is unnecessary.

2. Projects Without Reliable Technical Data
It is less effective where critical inputs such as resource assessments, generation profiles, degradation assumptions, or BESS dispatch data are unavailable or highly uncertain.

3. Early Concept or Pre-Feasibility Projects
Not ideal for projects still at a purely conceptual stage with undefined technology, land, grid access, or commercial arrangements.

4. Merchant-Only Projects in Highly Volatile Markets
Projects relying entirely on uncontracted merchant revenues in unstable electricity markets may require more advanced stochastic price modeling beyond the scope of this model.

5. Non-Project Finance Structures
The model is less suitable for projects funded through corporate balance sheets, grant-based financing, public-sector budgeting, or fully equity-funded structures where lender covenants are not relevant.

6. Projects with Complex Multi-Asset Portfolios
It may not adequately capture highly complex portfolio structures involving multiple generation technologies, transmission assets, or cross-border energy trading without customization.

7. Jurisdictions with Highly Specialized Tax Regimes
The model uses generalized tax logic and may not fully capture jurisdictions with complex tax incentives, accelerated depreciation, tax equity structures, or intricate withholding tax rules.

8. Markets with Unstable Regulatory Environments
Less reliable in countries experiencing frequent regulatory changes, tariff uncertainty, weak offtaker creditworthiness, or evolving grid policies.

9. Projects Requiring High-Frequency Dispatch Optimization
The model is not intended for detailed hourly or sub-hourly energy market dispatch simulations, ancillary service bidding, or advanced battery optimization algorithms.

10. Projects with Highly Customized Financing Instruments
Not ideal for structures involving mezzanine debt, convertible instruments, revenue-sharing financing, securitization, or structured derivatives unless materially adapted.

Key Limitation
This model is designed as a best-practice project finance tool, not a substitute for detailed engineering simulations, legal due diligence, or market trading models. For non-standard projects, significant customization may be required.


0.0 / 5 (0 votes)

please wait...