Originally published: 10/01/2025 08:42
Publication number: ELQ-83101-1
View all versions & Certificate
Publication number: ELQ-83101-1
View all versions & Certificate

Rubber and Plastics Manufacturer Financial Model
A comprehensive editable, 5-year 3 statement MS Excel spreadsheet for tracking a Rubber and Plastics Manufacturer's finances.
 by AllFinancialModels
AllFinancialModels offer a curated selection of high-quality yet financial model templates designed to support a wide range of business needs.Follow
rubberplasticsmanufacturermanufacturingfinancialfinancial modelfinanceexcelrubber and plasticsd printing
Description
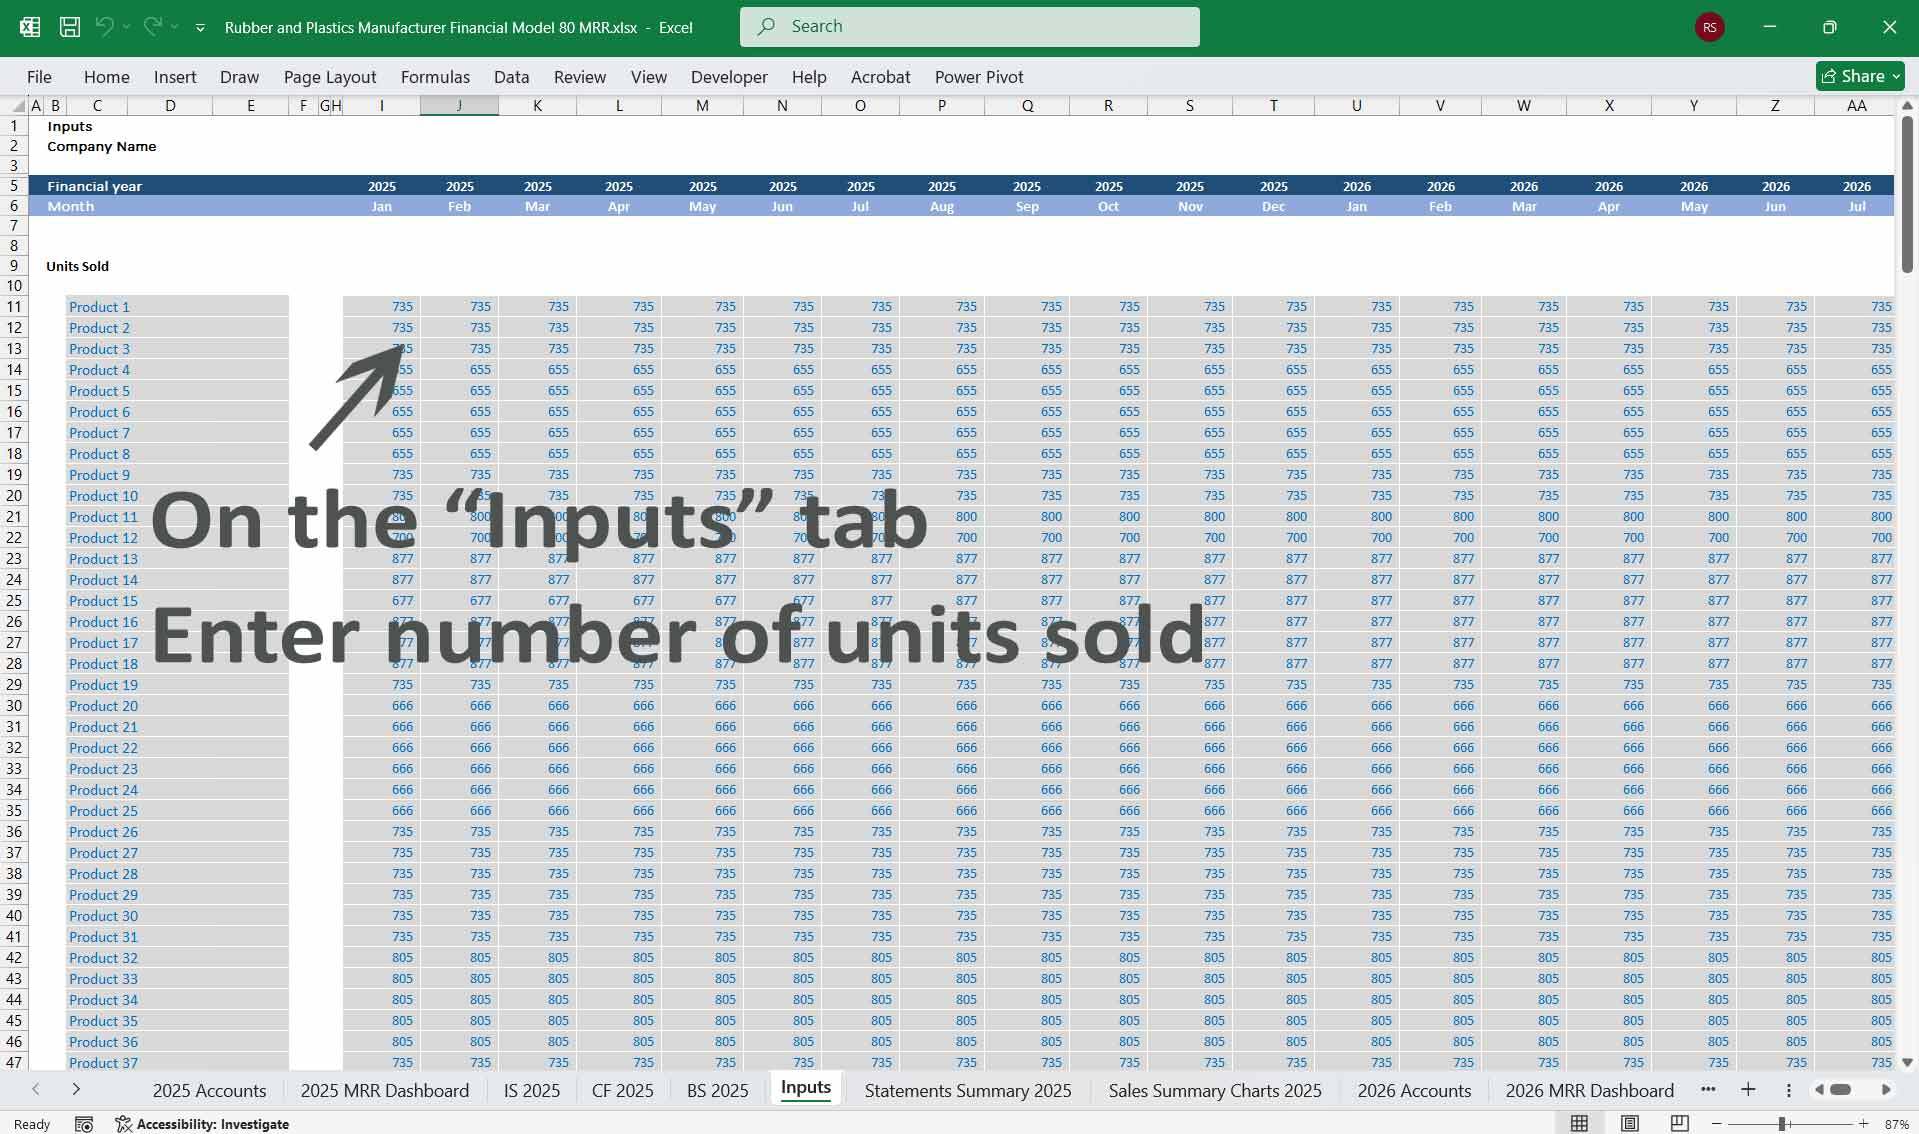
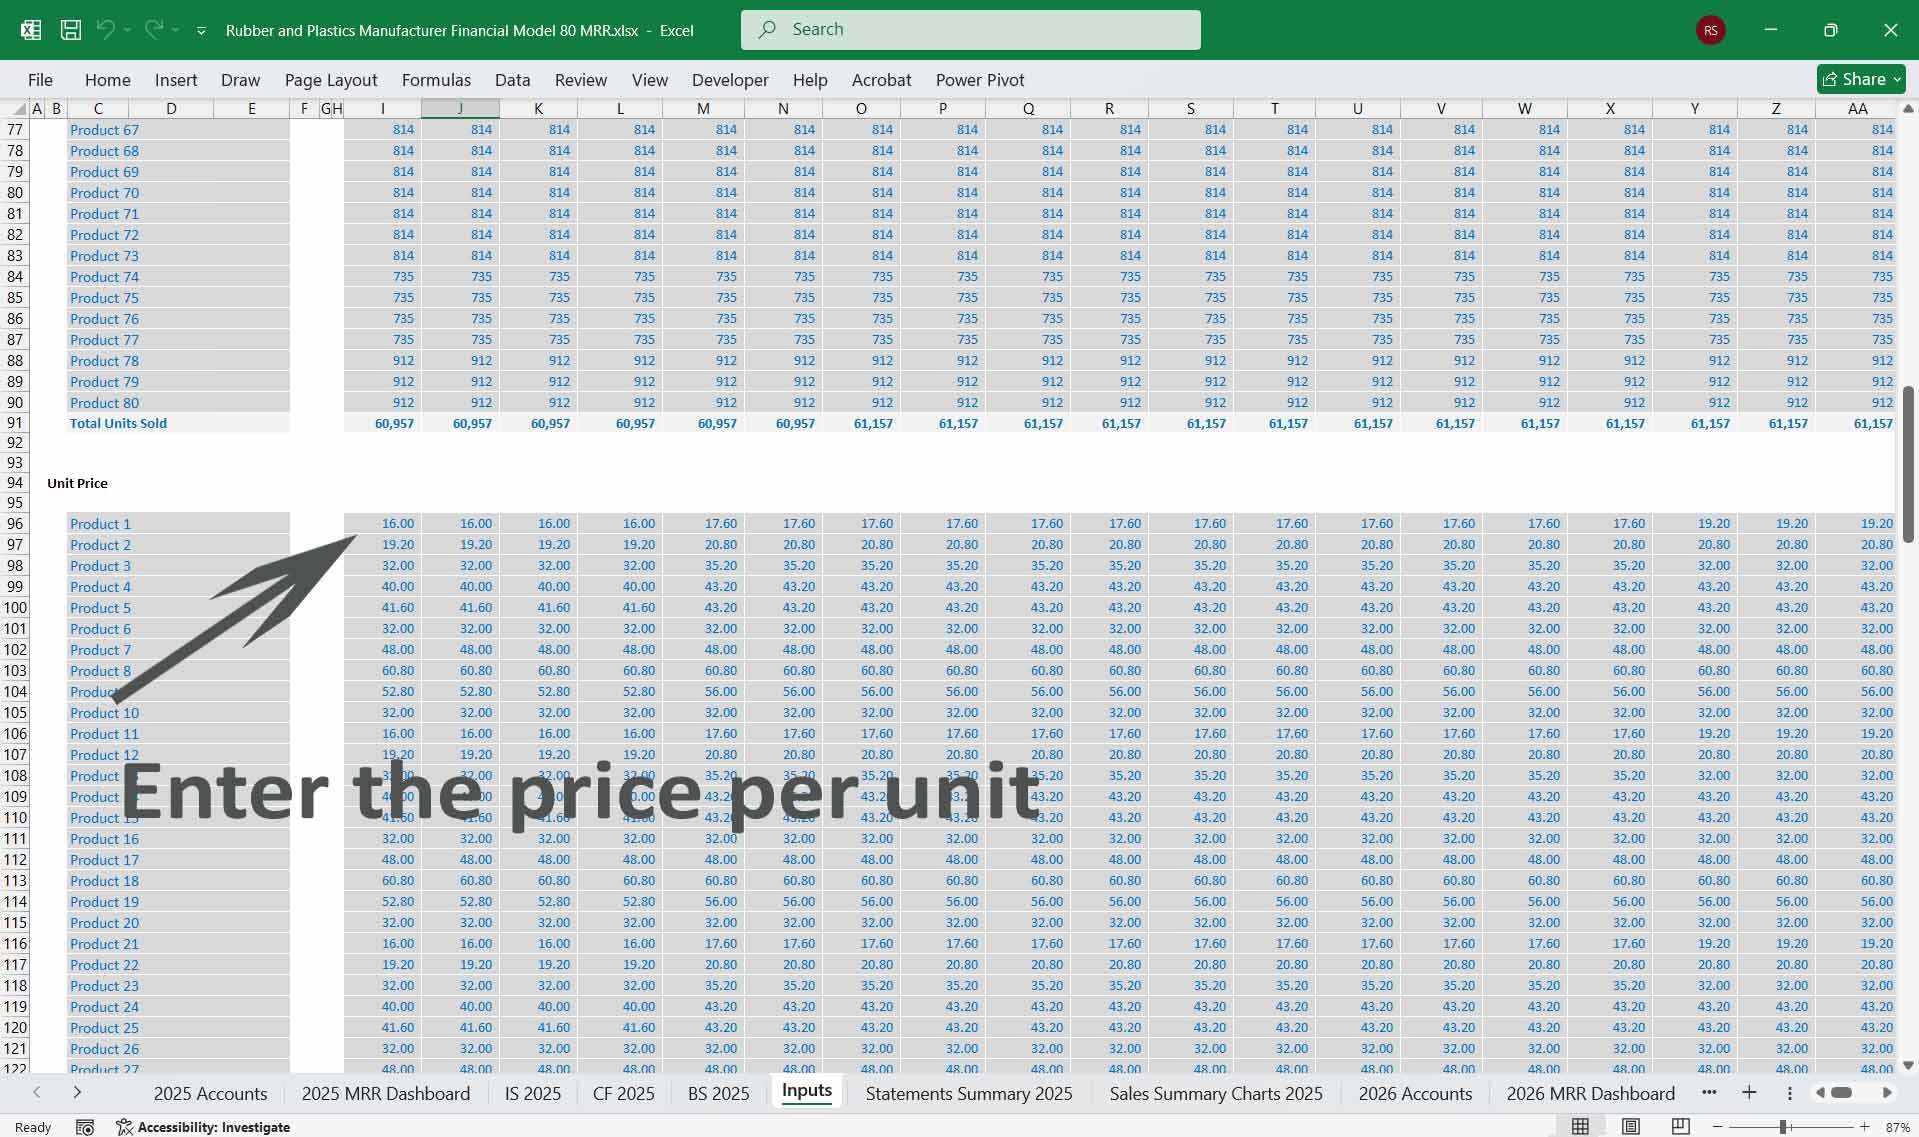
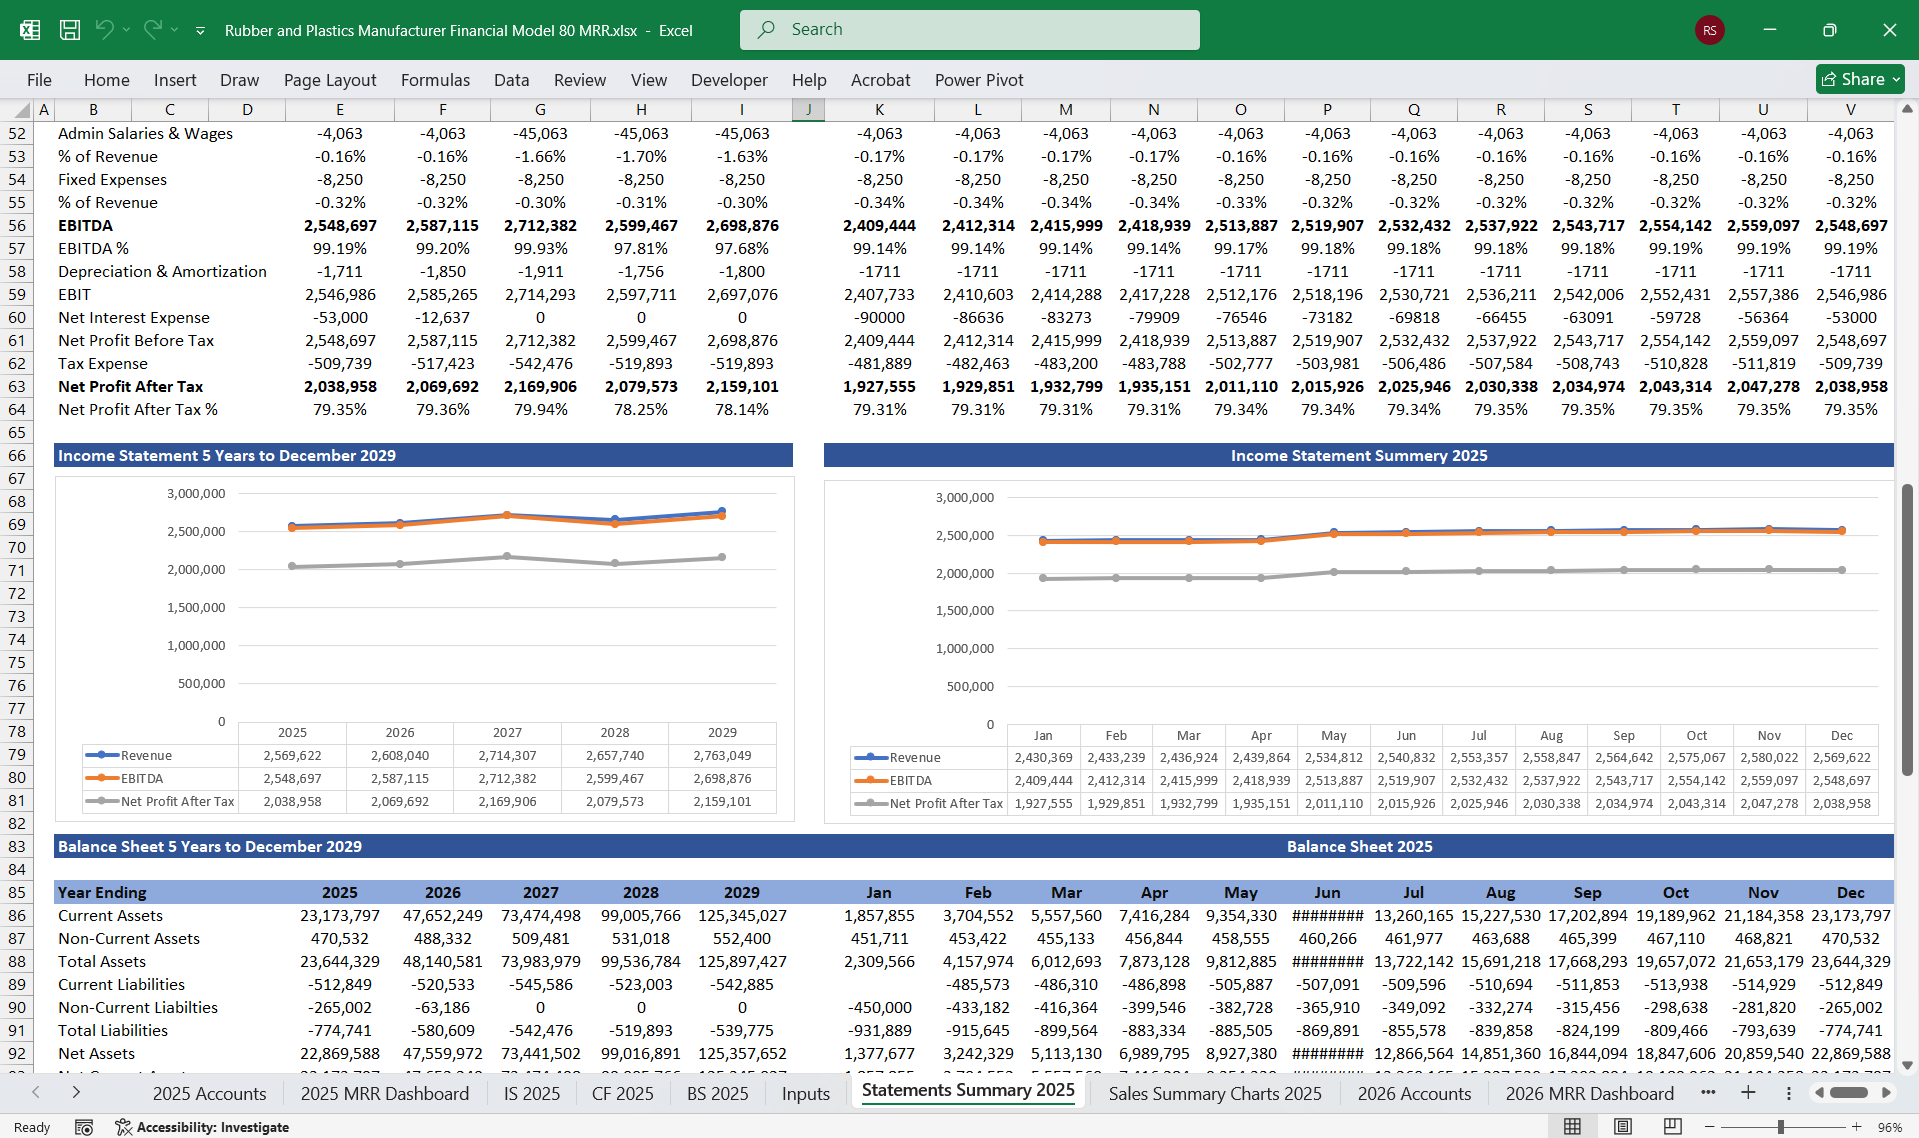
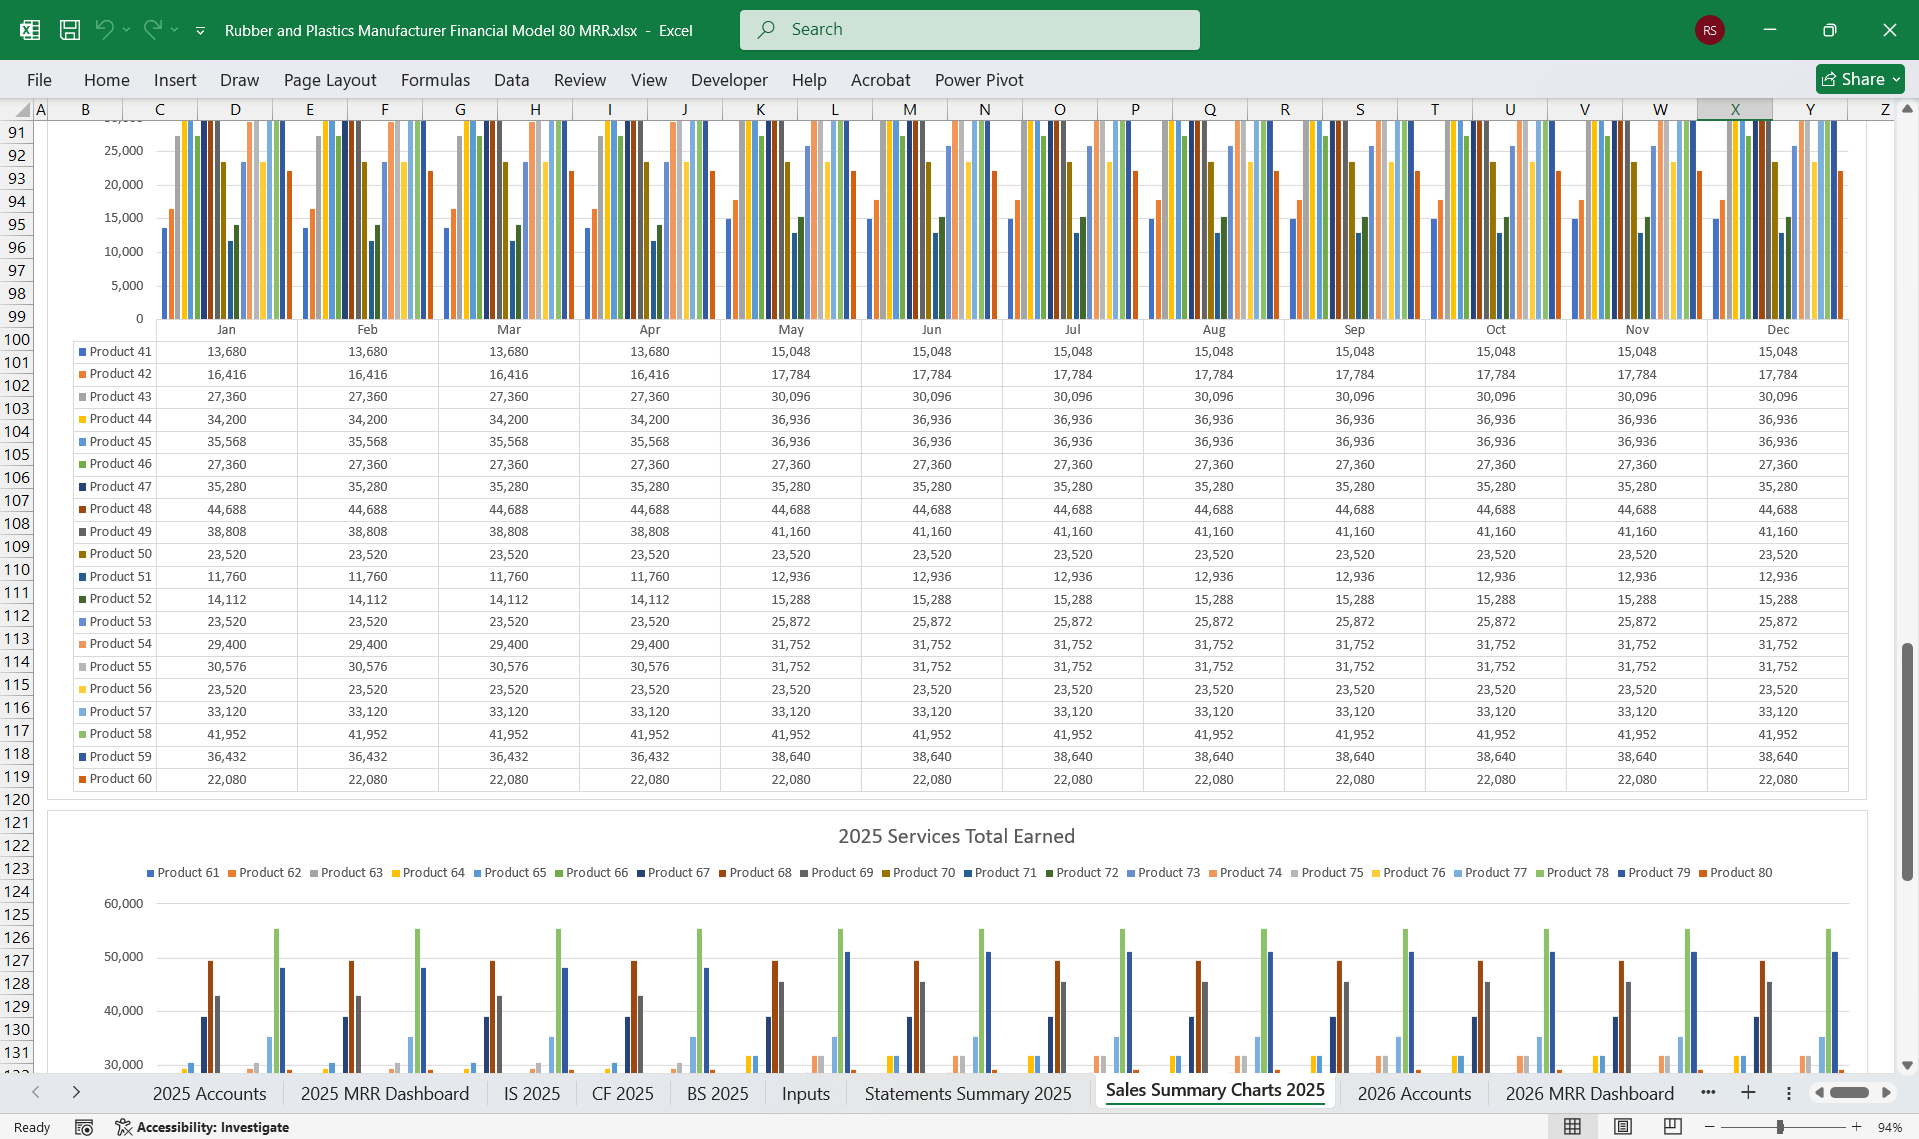
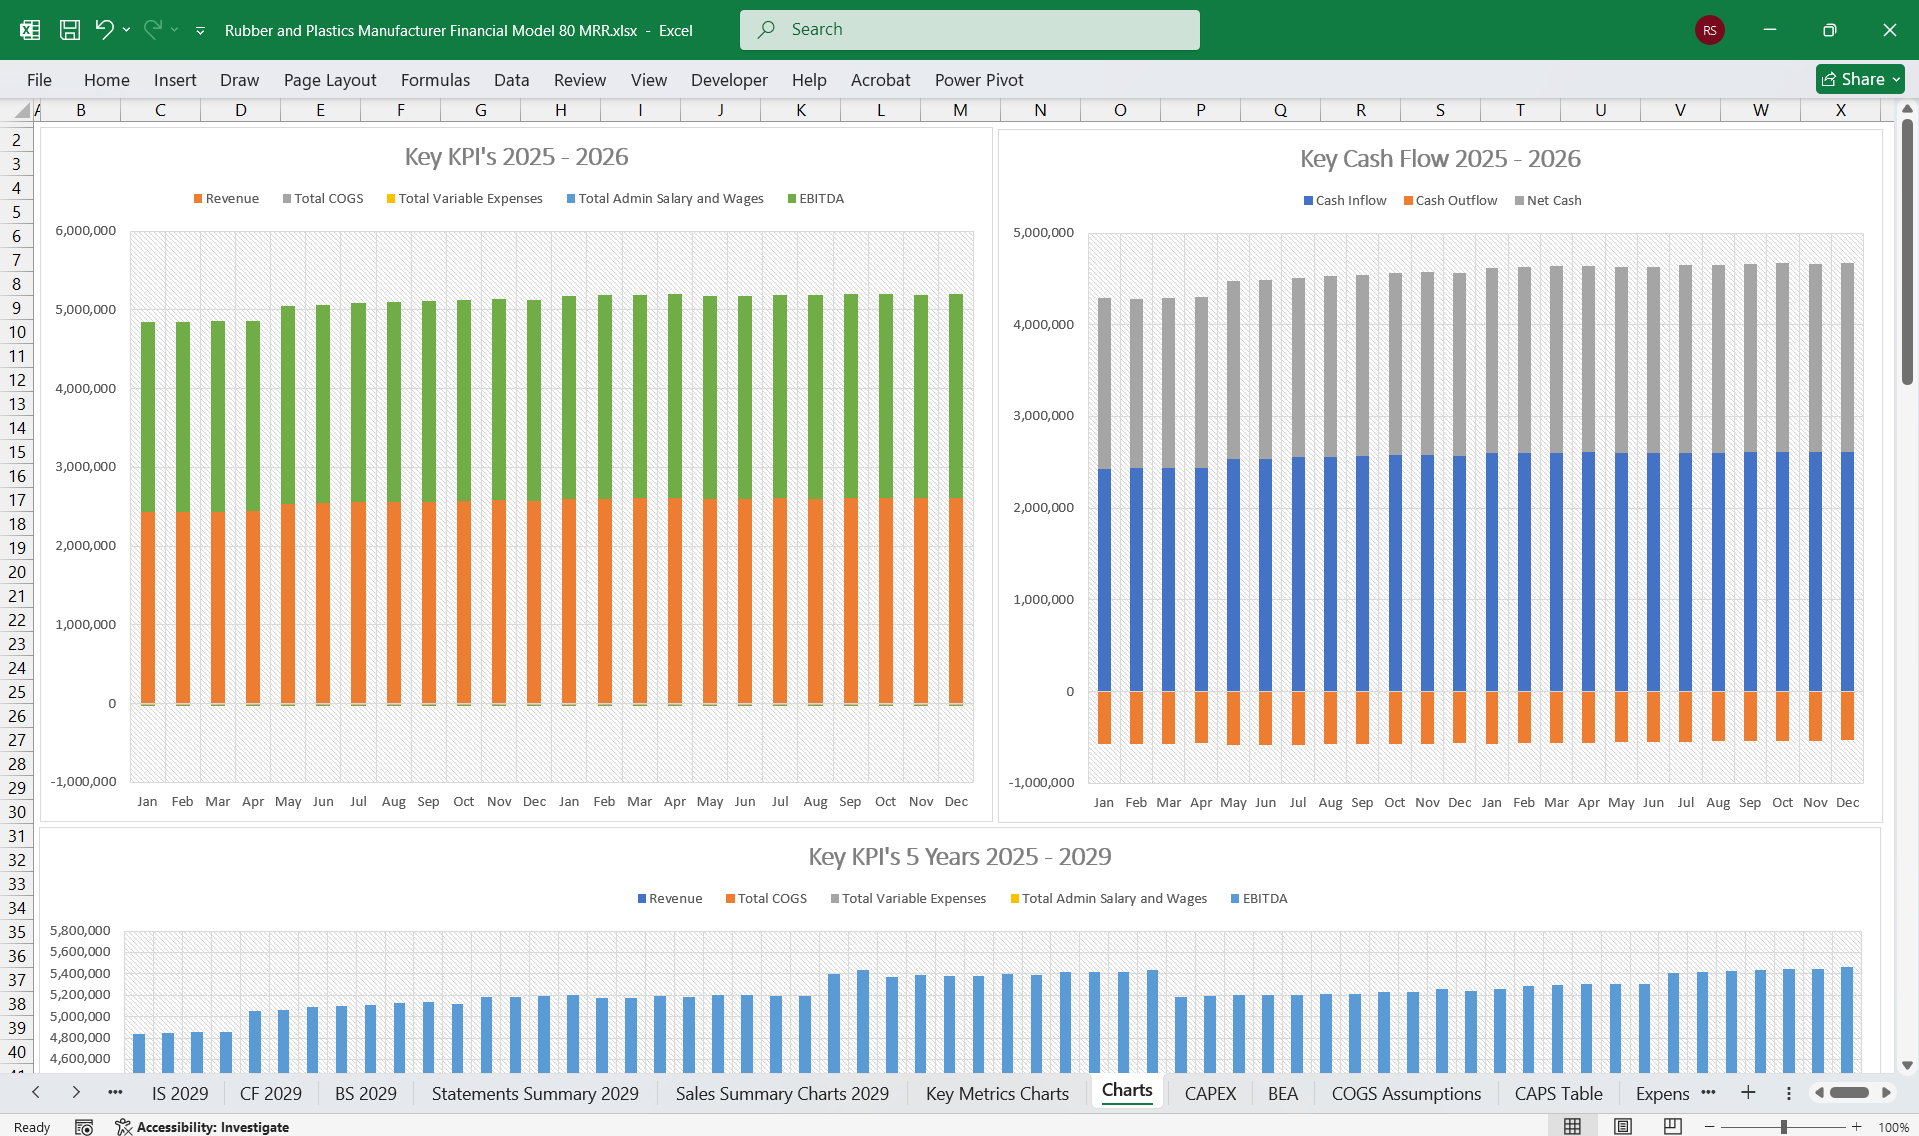
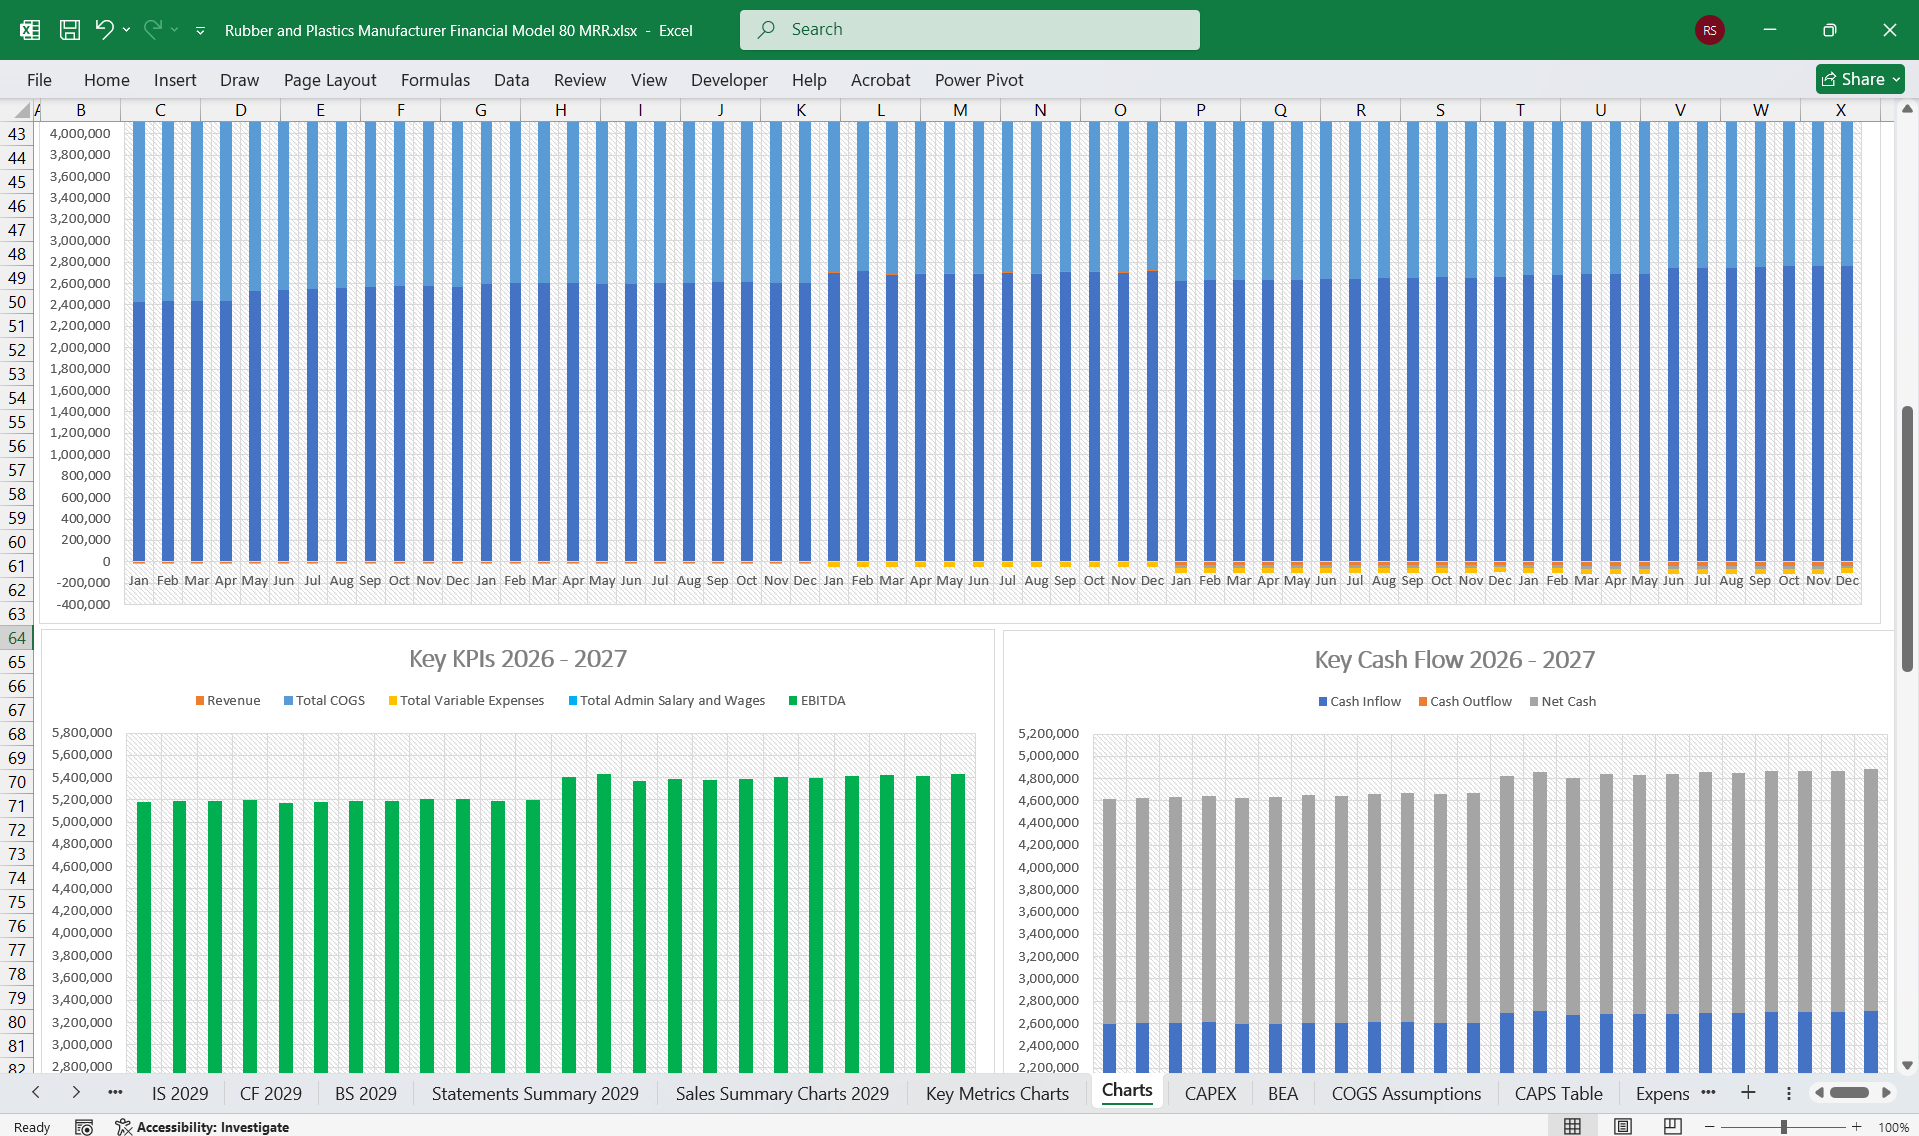
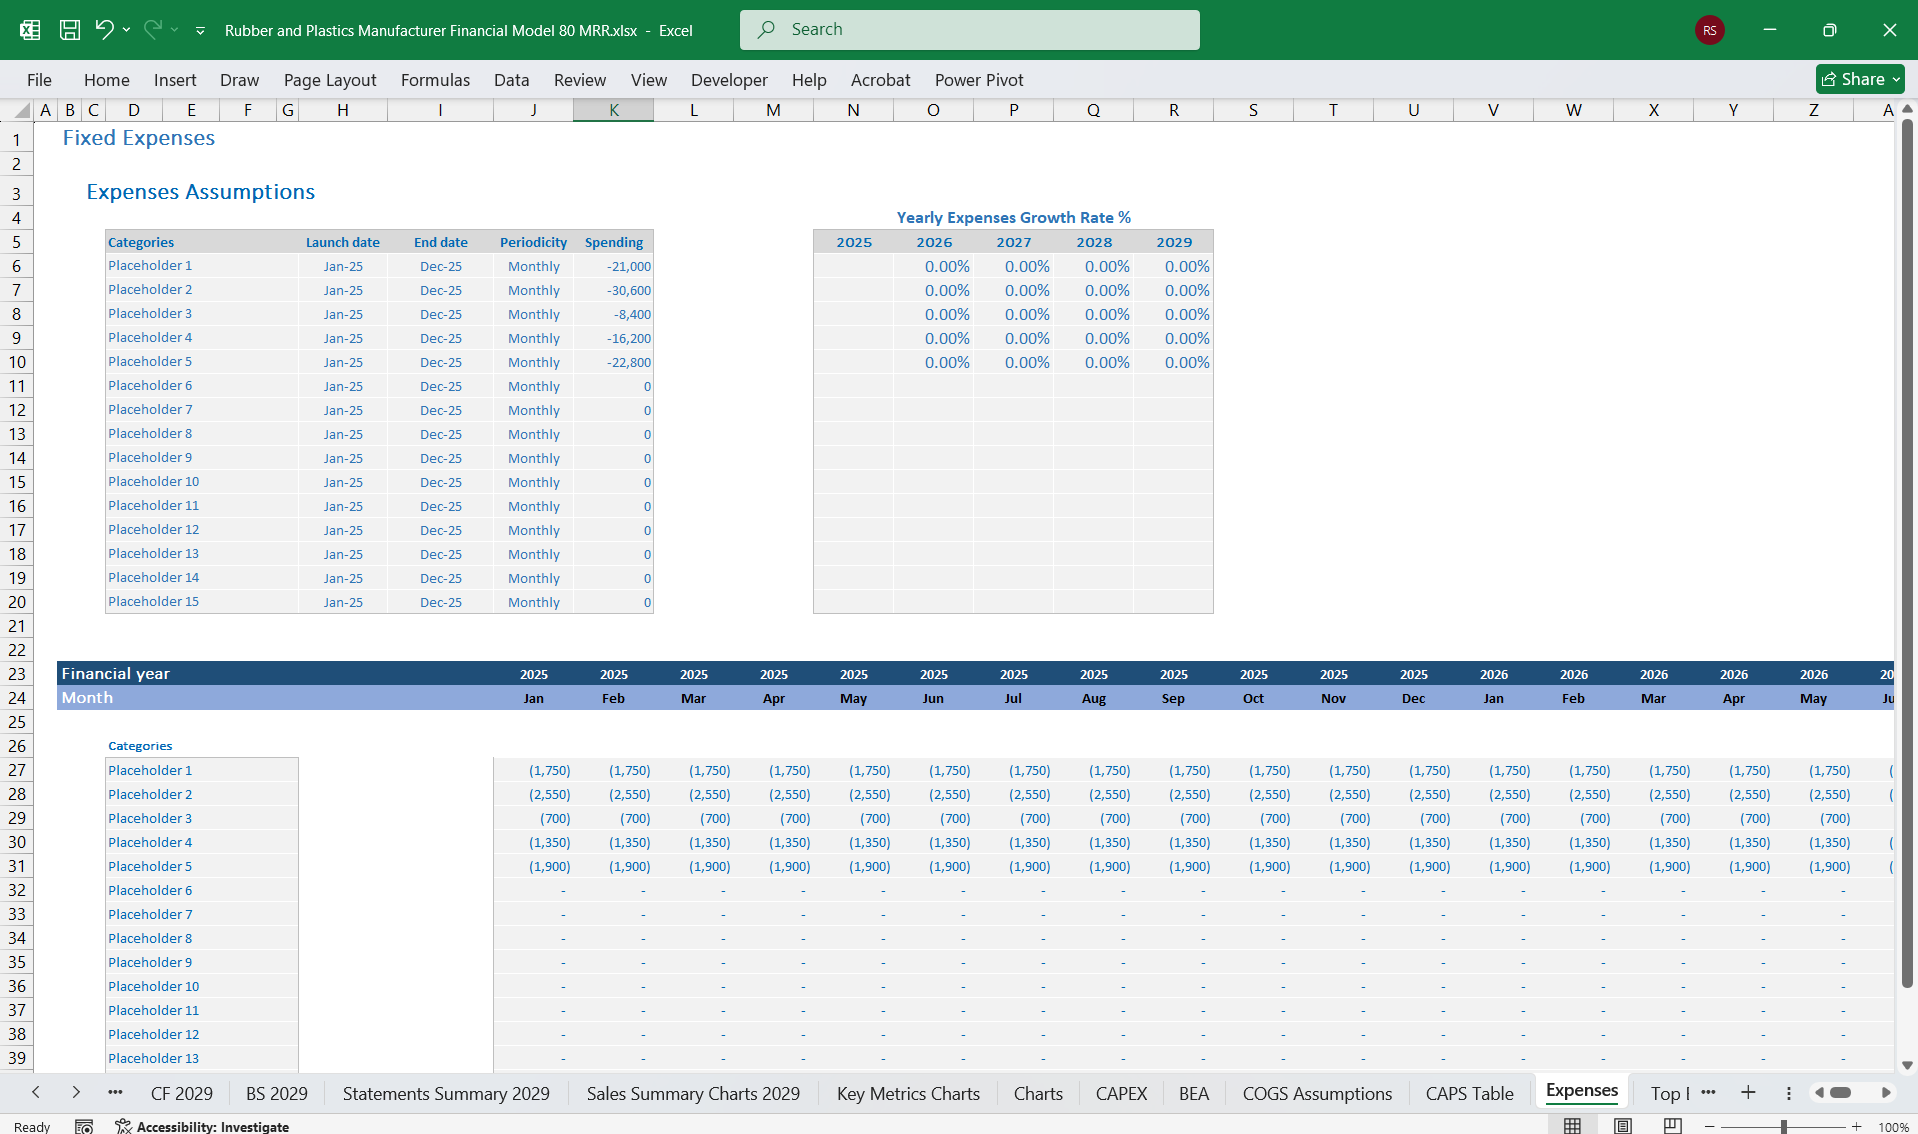
Financial Model for a Rubber and Plastics ManufacturerThis financial model provides an in-depth framework tailored for a Rubber and Plastics Manufacturer, a business that produces industrial and consumer-grade materials such as molded components, extruded profiles, and plastic packaging. The model covers the Income Statement, Cash Flow Statement, and Balance Sheet, with detailed segments for 80-product line scenarios and a 6-Tier Subscription Add-on that ensures recurring revenue through value-added services.
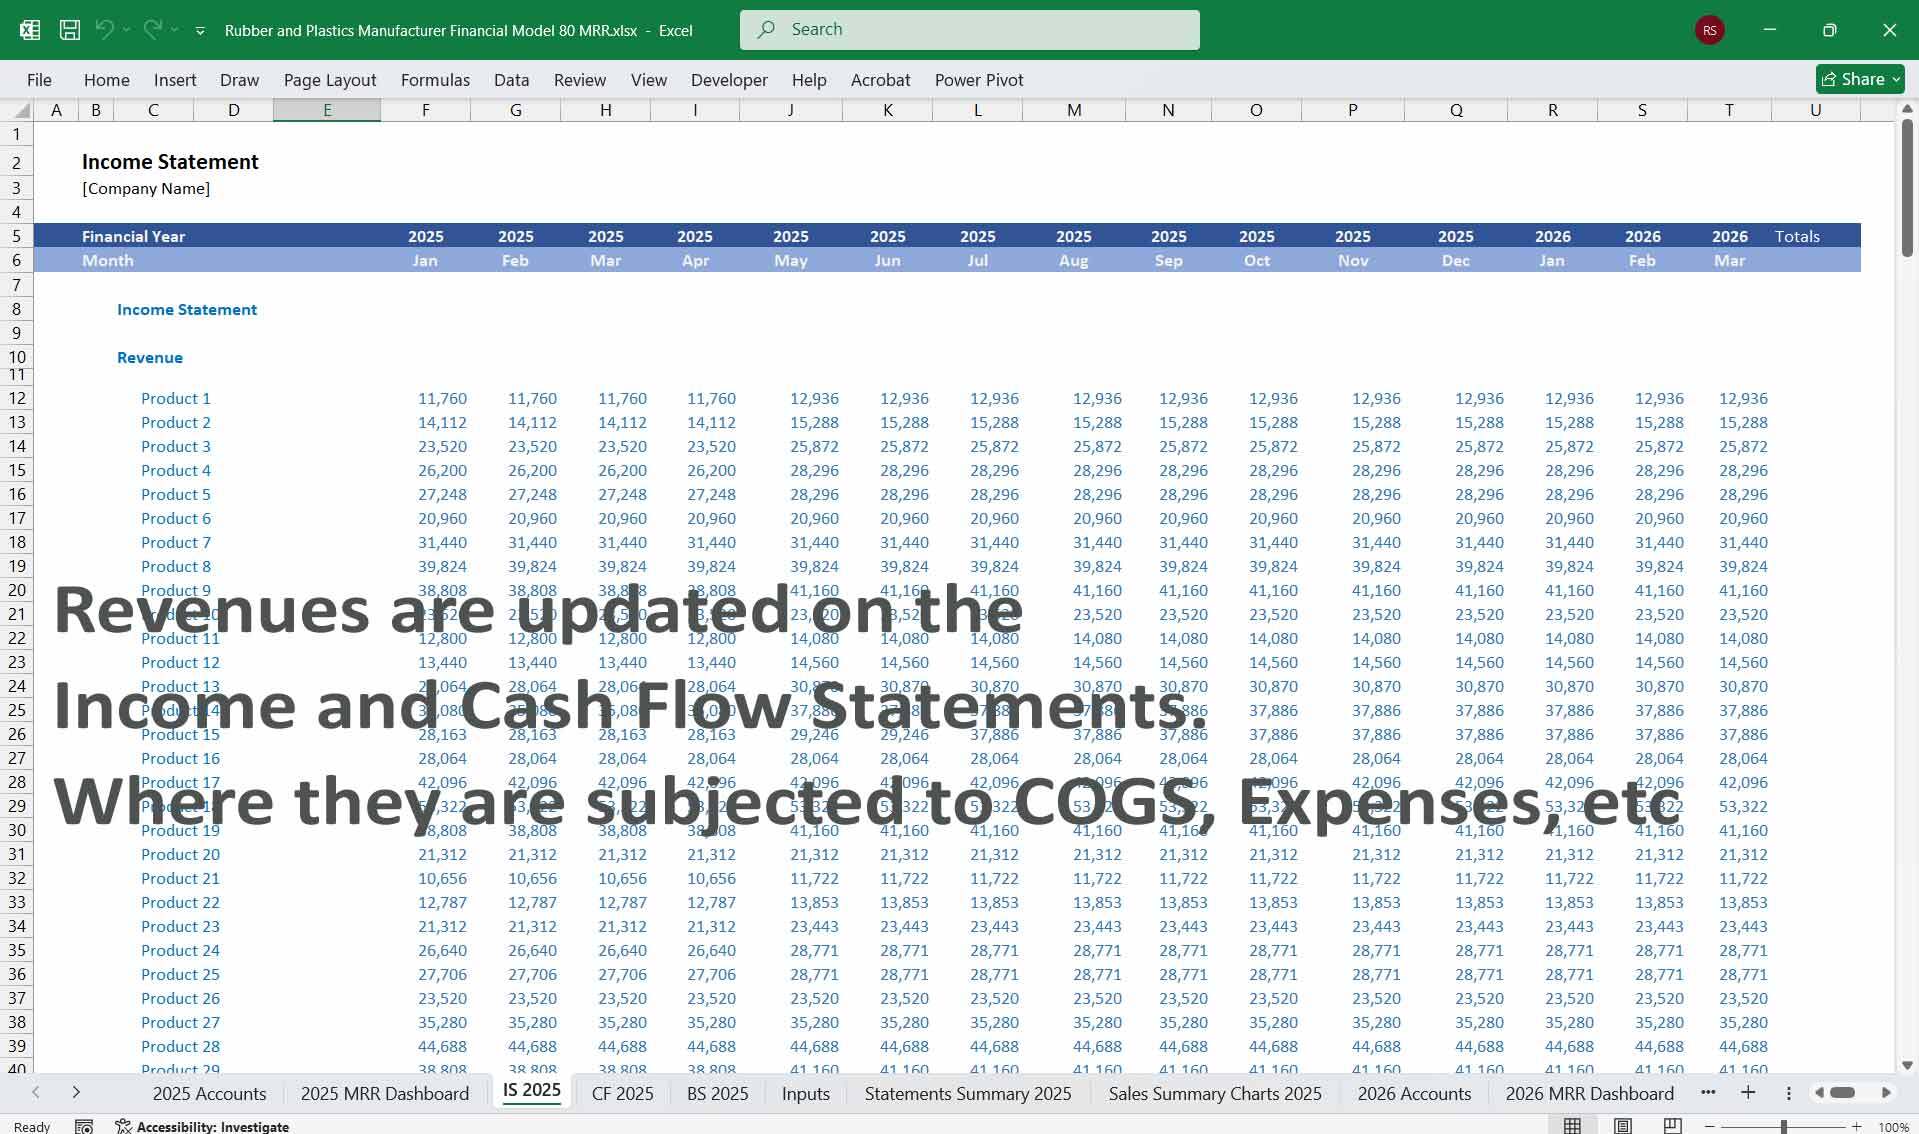
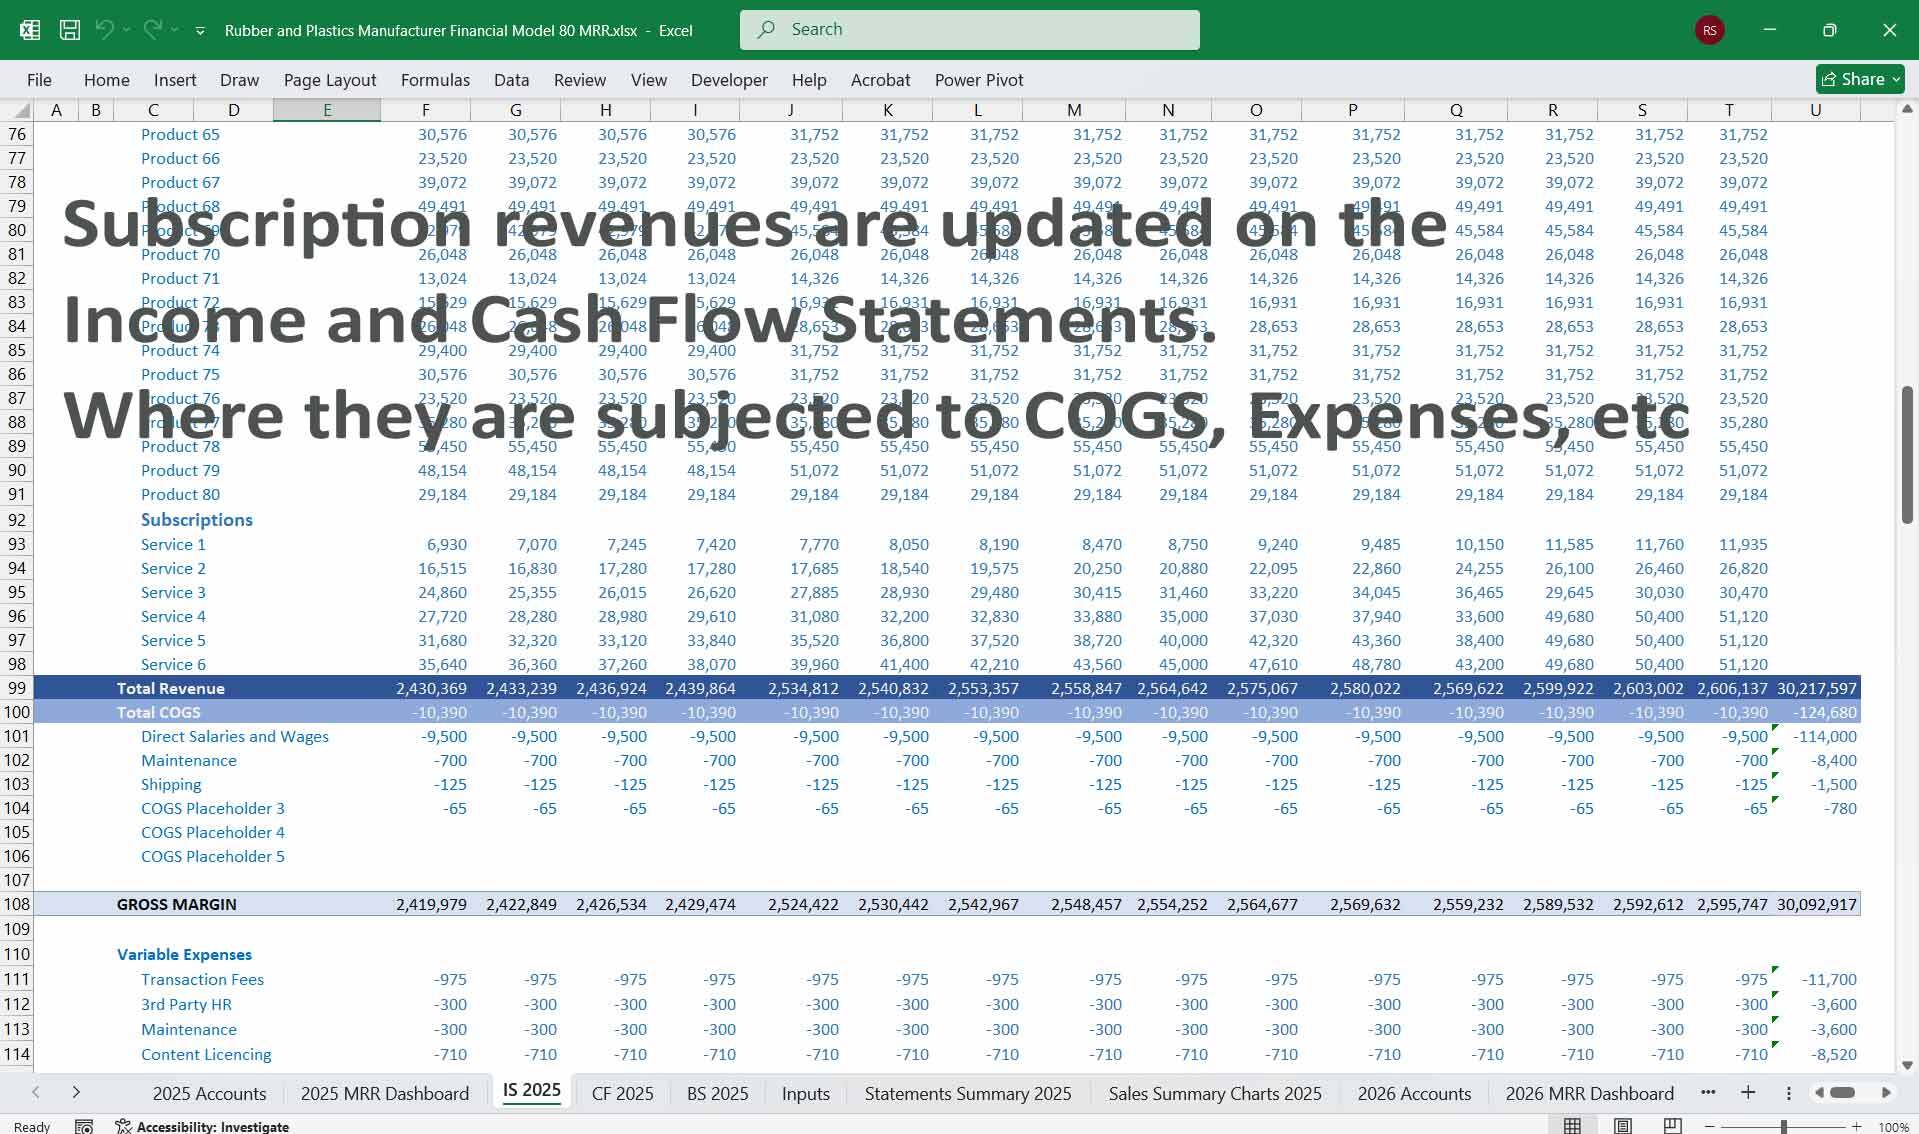
1. Income StatementRevenue Streams
Diversifying into specialty and high-margin products.
Tier Details
Financial Model for a Rubber and Plastics ManufacturerThis financial model provides an in-depth framework tailored for a Rubber and Plastics Manufacturer, a business that produces industrial and consumer-grade materials such as molded components, extruded profiles, and plastic packaging. The model covers the Income Statement, Cash Flow Statement, and Balance Sheet, with detailed segments for 80-product line scenarios and a 6-Tier Subscription Add-on that ensures recurring revenue through value-added services.
1. Income StatementRevenue Streams
- Product Sales:
- Standard Products: High-volume production items like tires, gaskets, plastic sheets, or disposable packaging.
- Custom Products: Tailored items, such as medical-grade or specialized industrial components.
- High-Performance Lines: Products with enhanced strength or resistance (e.g., reinforced plastic panels, vulcanized rubber components).
- Recycling Revenue:
- Sale of by-products or recycled materials for eco-friendly initiatives.
- Service Revenue:
- Maintenance services for rubber and plastic molds.
- Prototyping and design consultation for custom components.
- Subscription Services:
- Analytics, production insights, and extended warranties via subscription tiers.
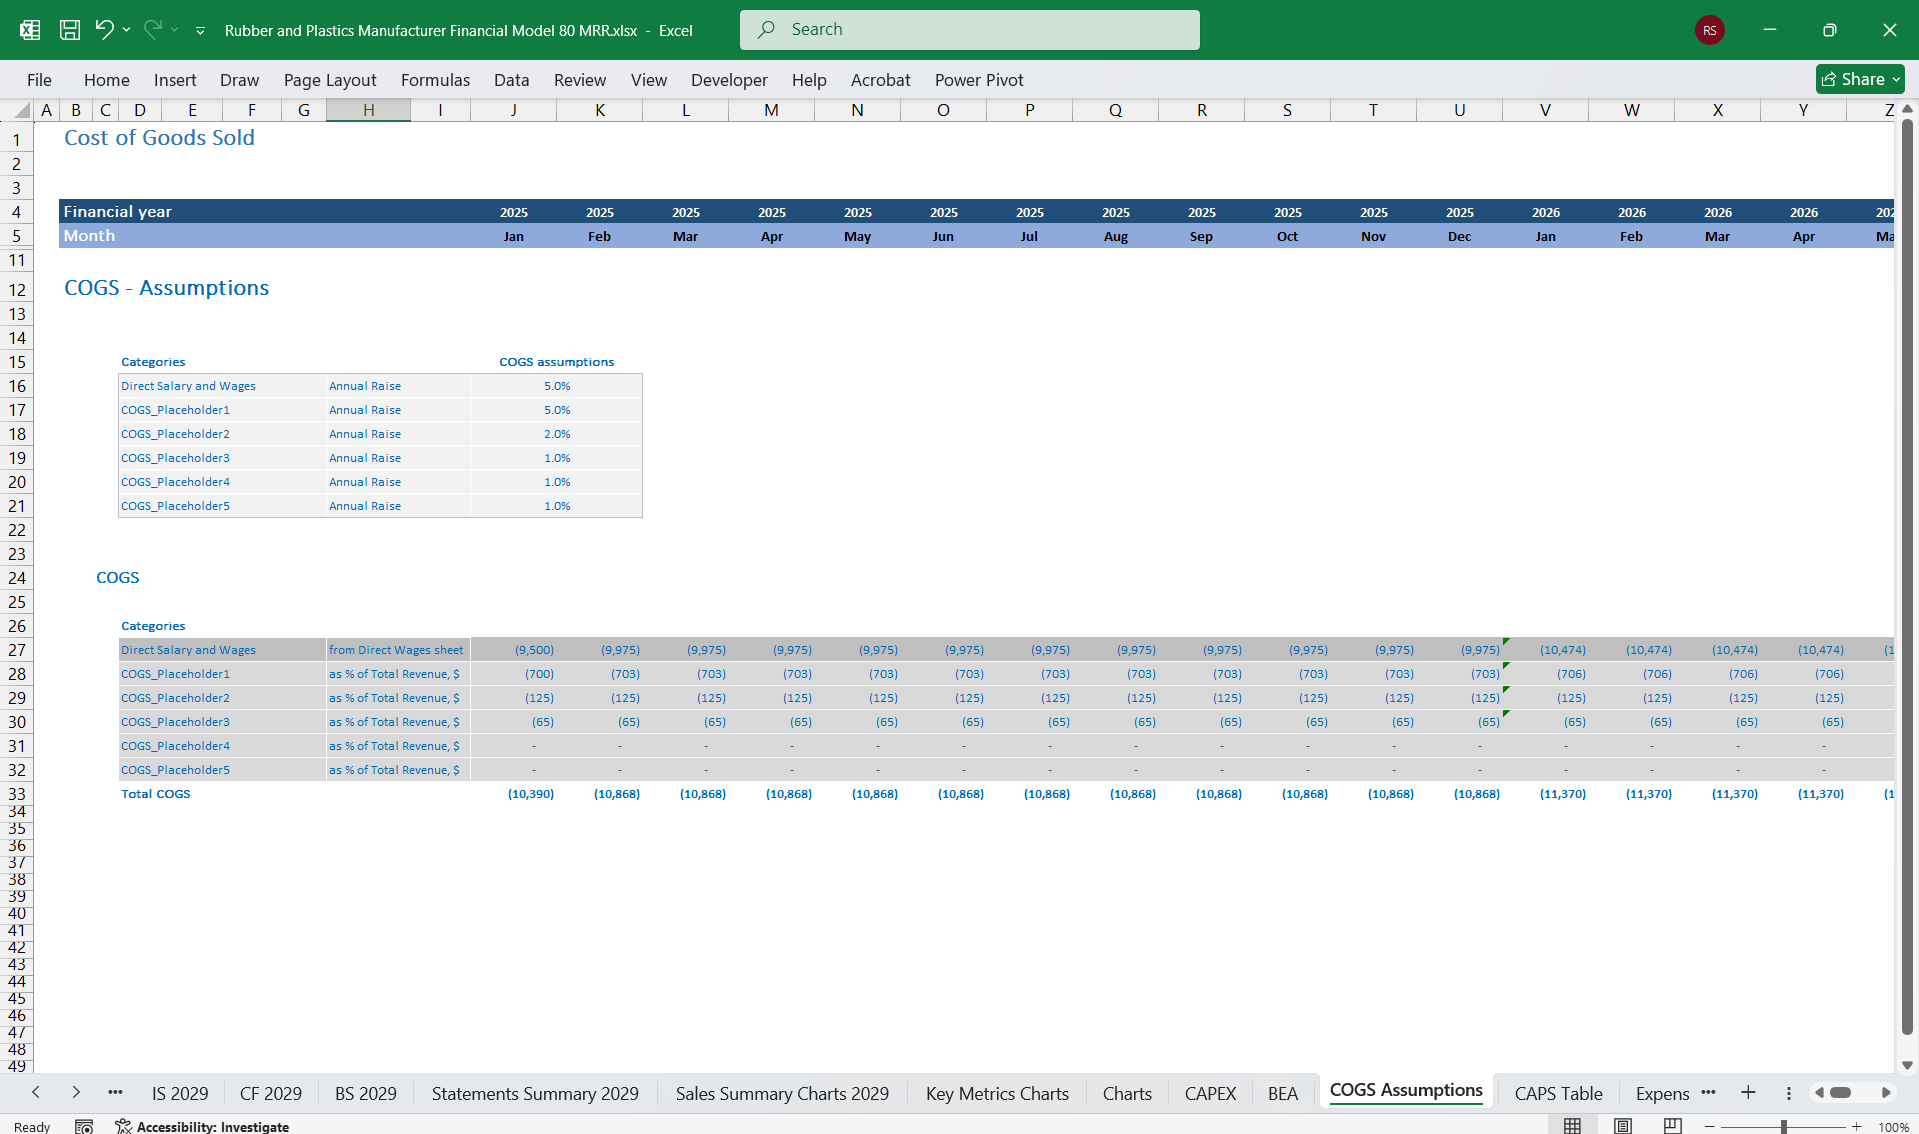
- Cost of Goods Sold (COGS):
- Materials: Natural or synthetic rubber, plastic resins, and additives (colorants, fillers, and stabilizers).
- Labor: Salaries for machinists, operators, and technicians.
- Overhead: Utility costs, machinery wear-and-tear, and testing protocols.
- Operating Expenses:
- R&D: Development of biodegradable plastics, reinforced polymers, and specialty formulations.
- Sales and Marketing: Customer acquisition and outreach to industrial buyers.
- General Administrative: Employee salaries, software for inventory management.
- Other Costs:
- Regulatory compliance for certifications (e.g., FDA approval for food-grade plastics).
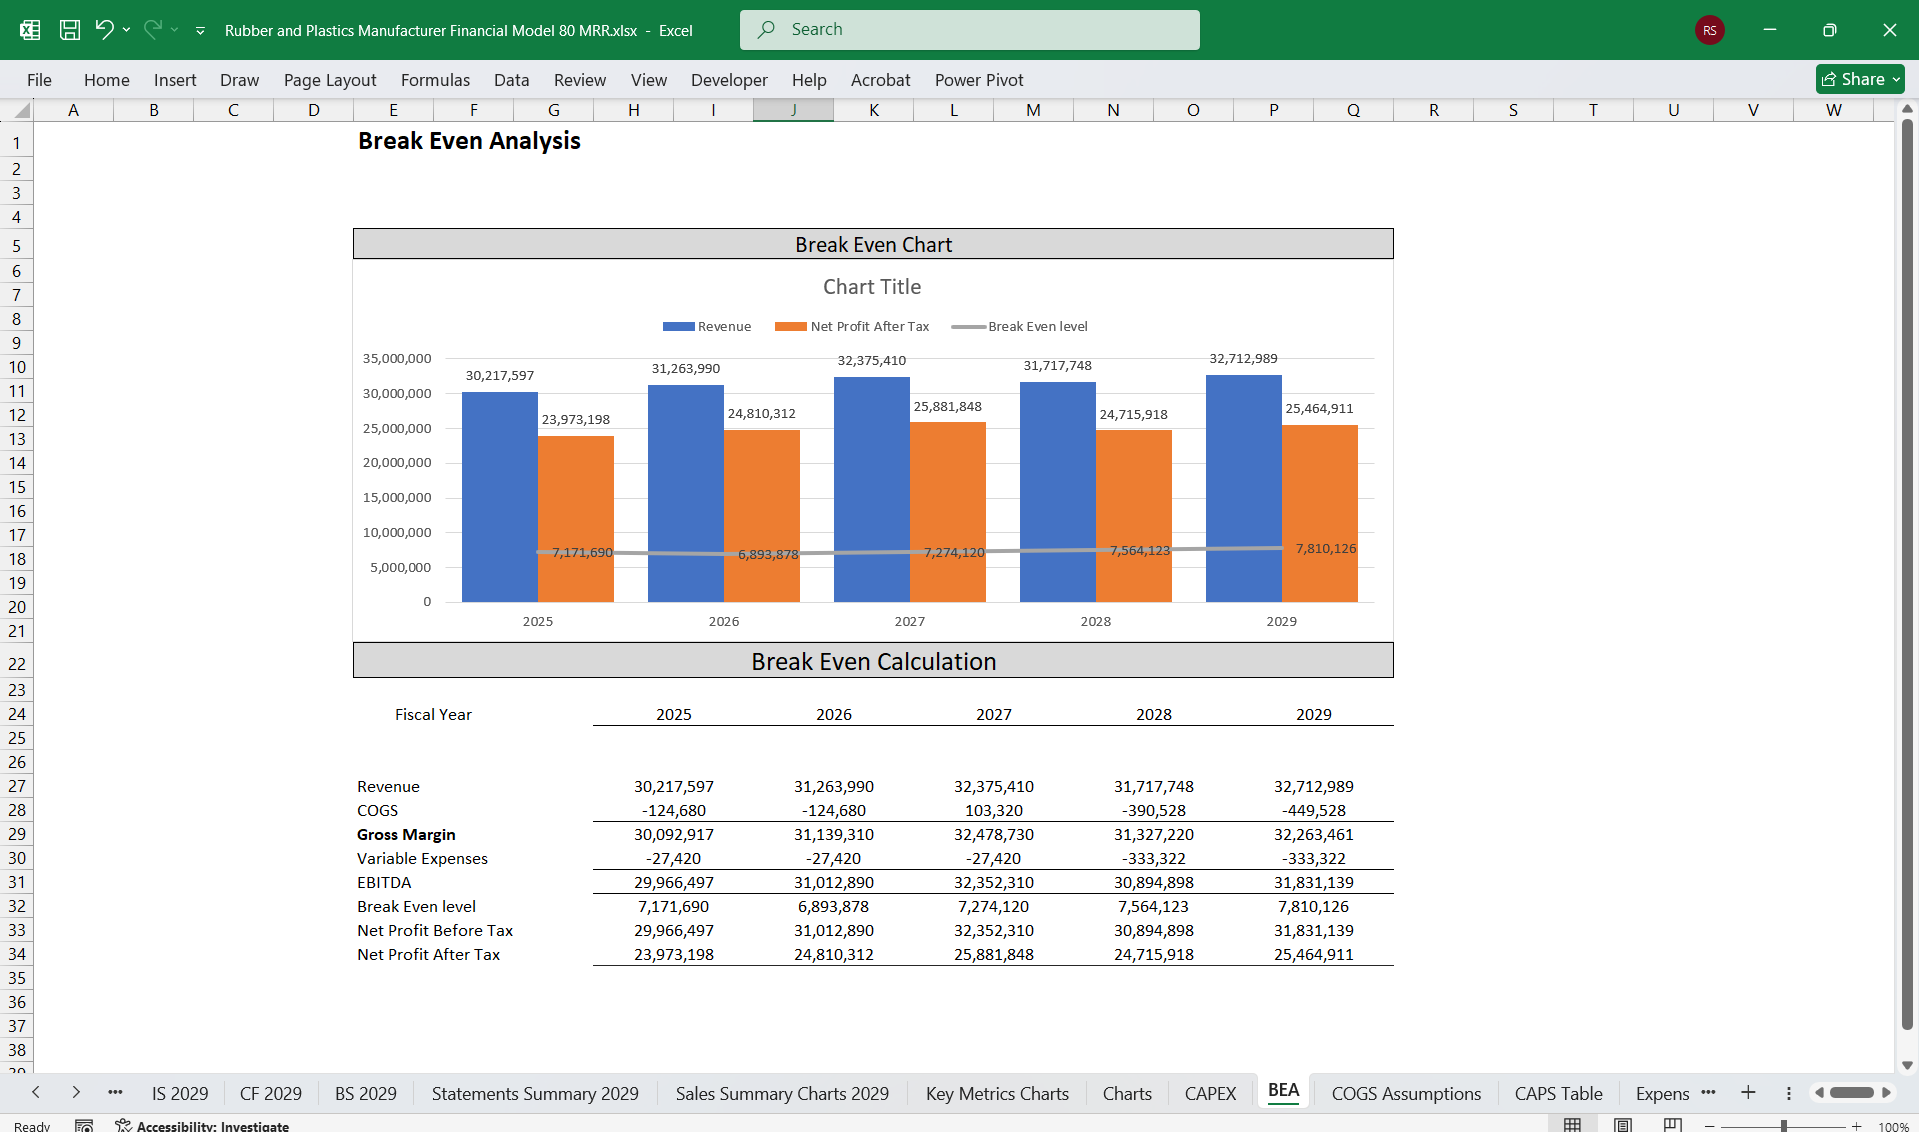
- Gross Profit = Revenue - COGS.
- Operating Income (EBIT) = Gross Profit - Operating Expenses.
- Net Income = EBIT - Taxes - Interest.
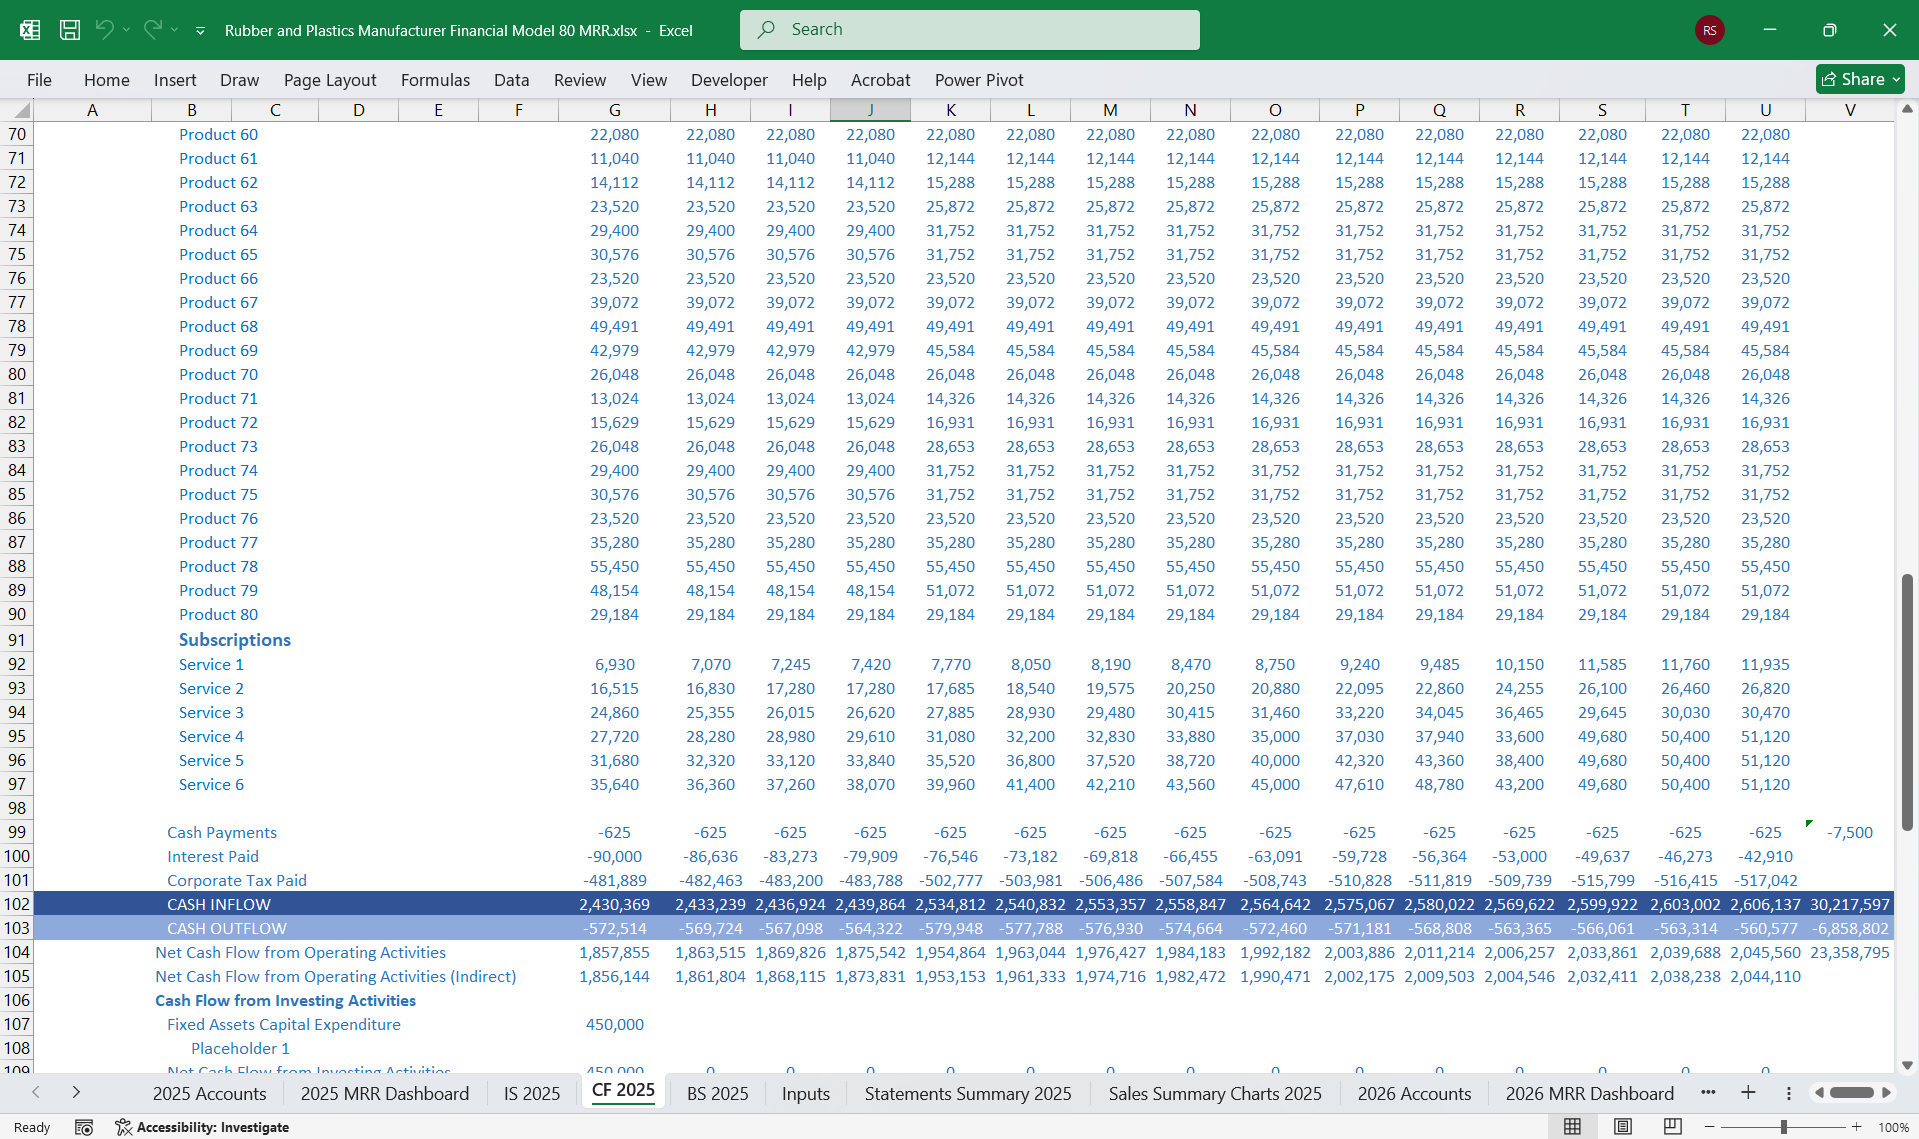
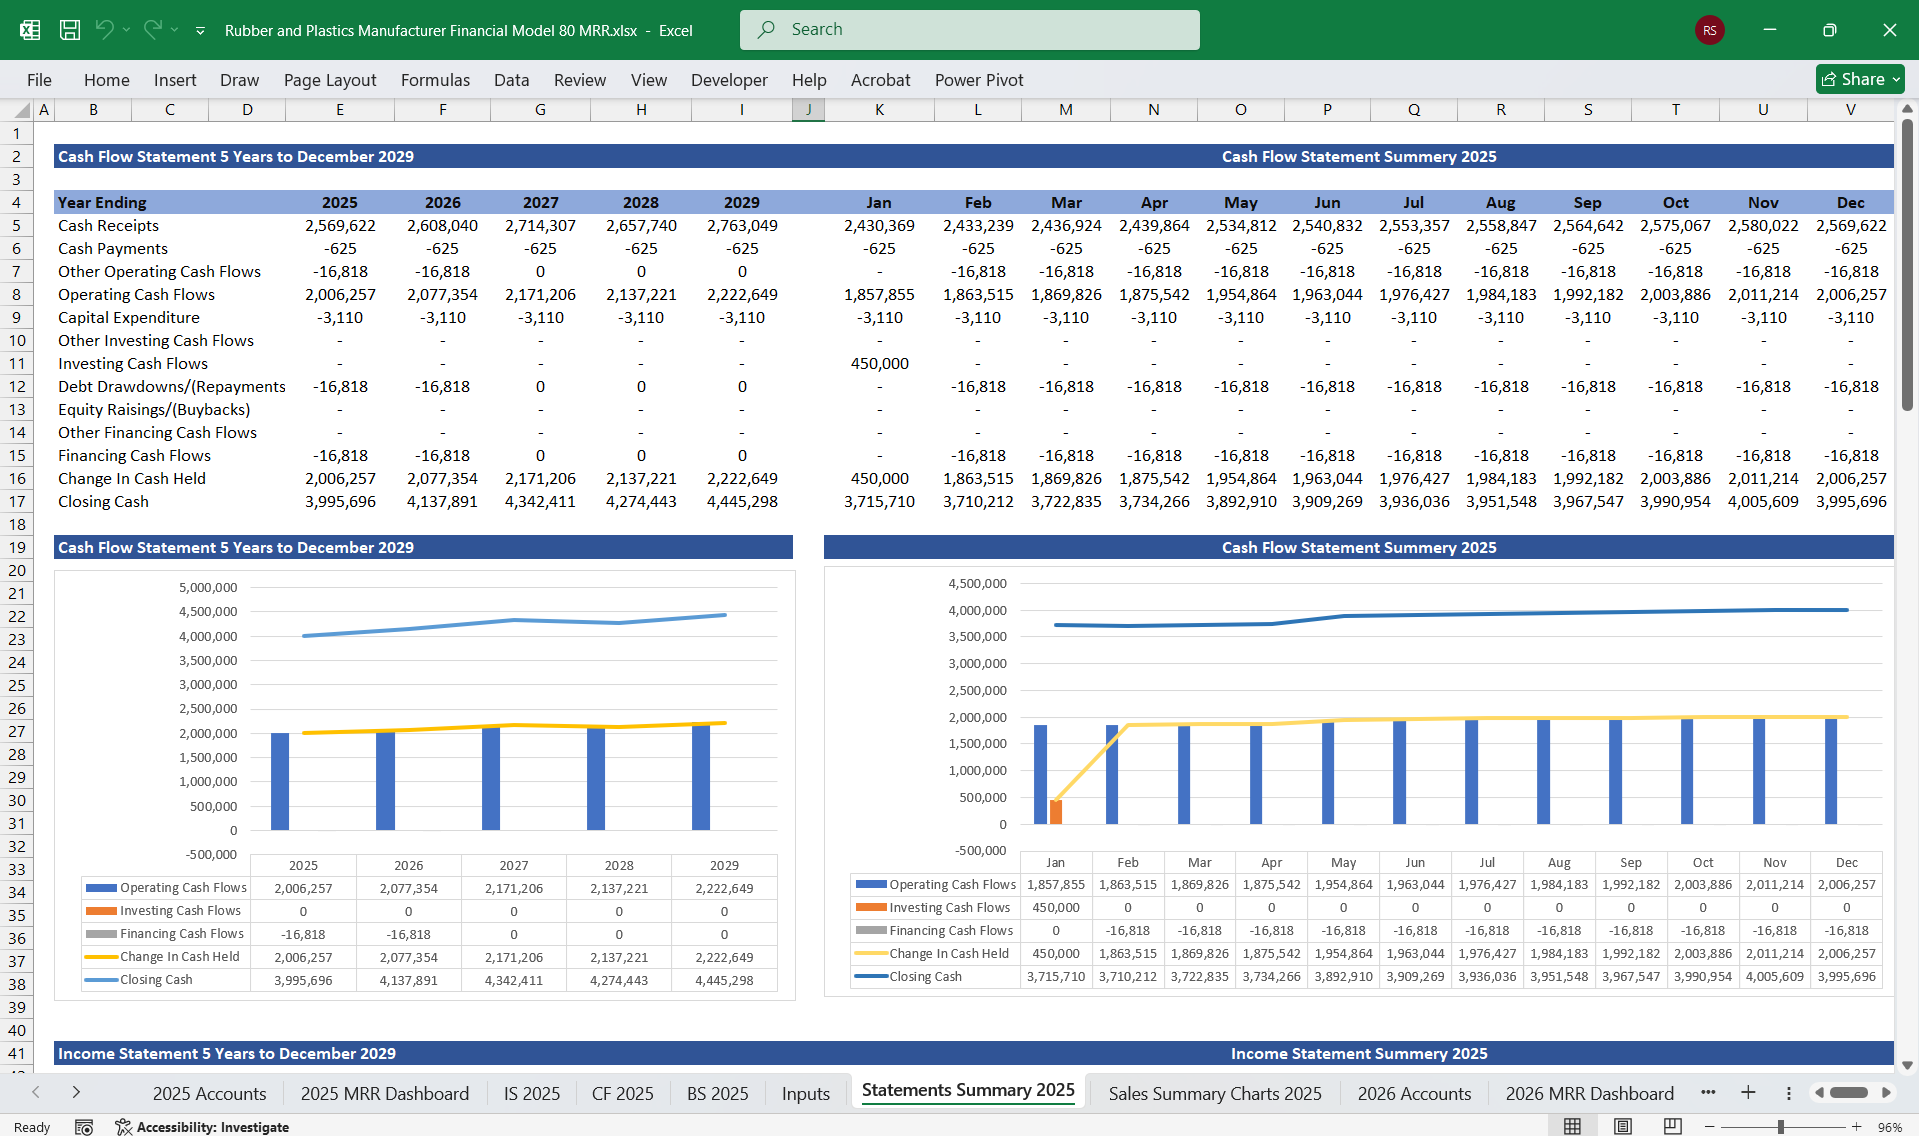
- Inflows:
- Payments for bulk orders of raw materials or finished goods.
- Upfront charges for custom product designs.
- Subscription revenue from analytics services.
- Outflows:
- Supplier payments for raw materials and transportation.
- Payroll for machine operators and engineers.
- Factory utility bills, such as electricity for high-energy machinery.
- Inflows:
- Asset liquidation: Selling older machinery or unused molds.
- Outflows:
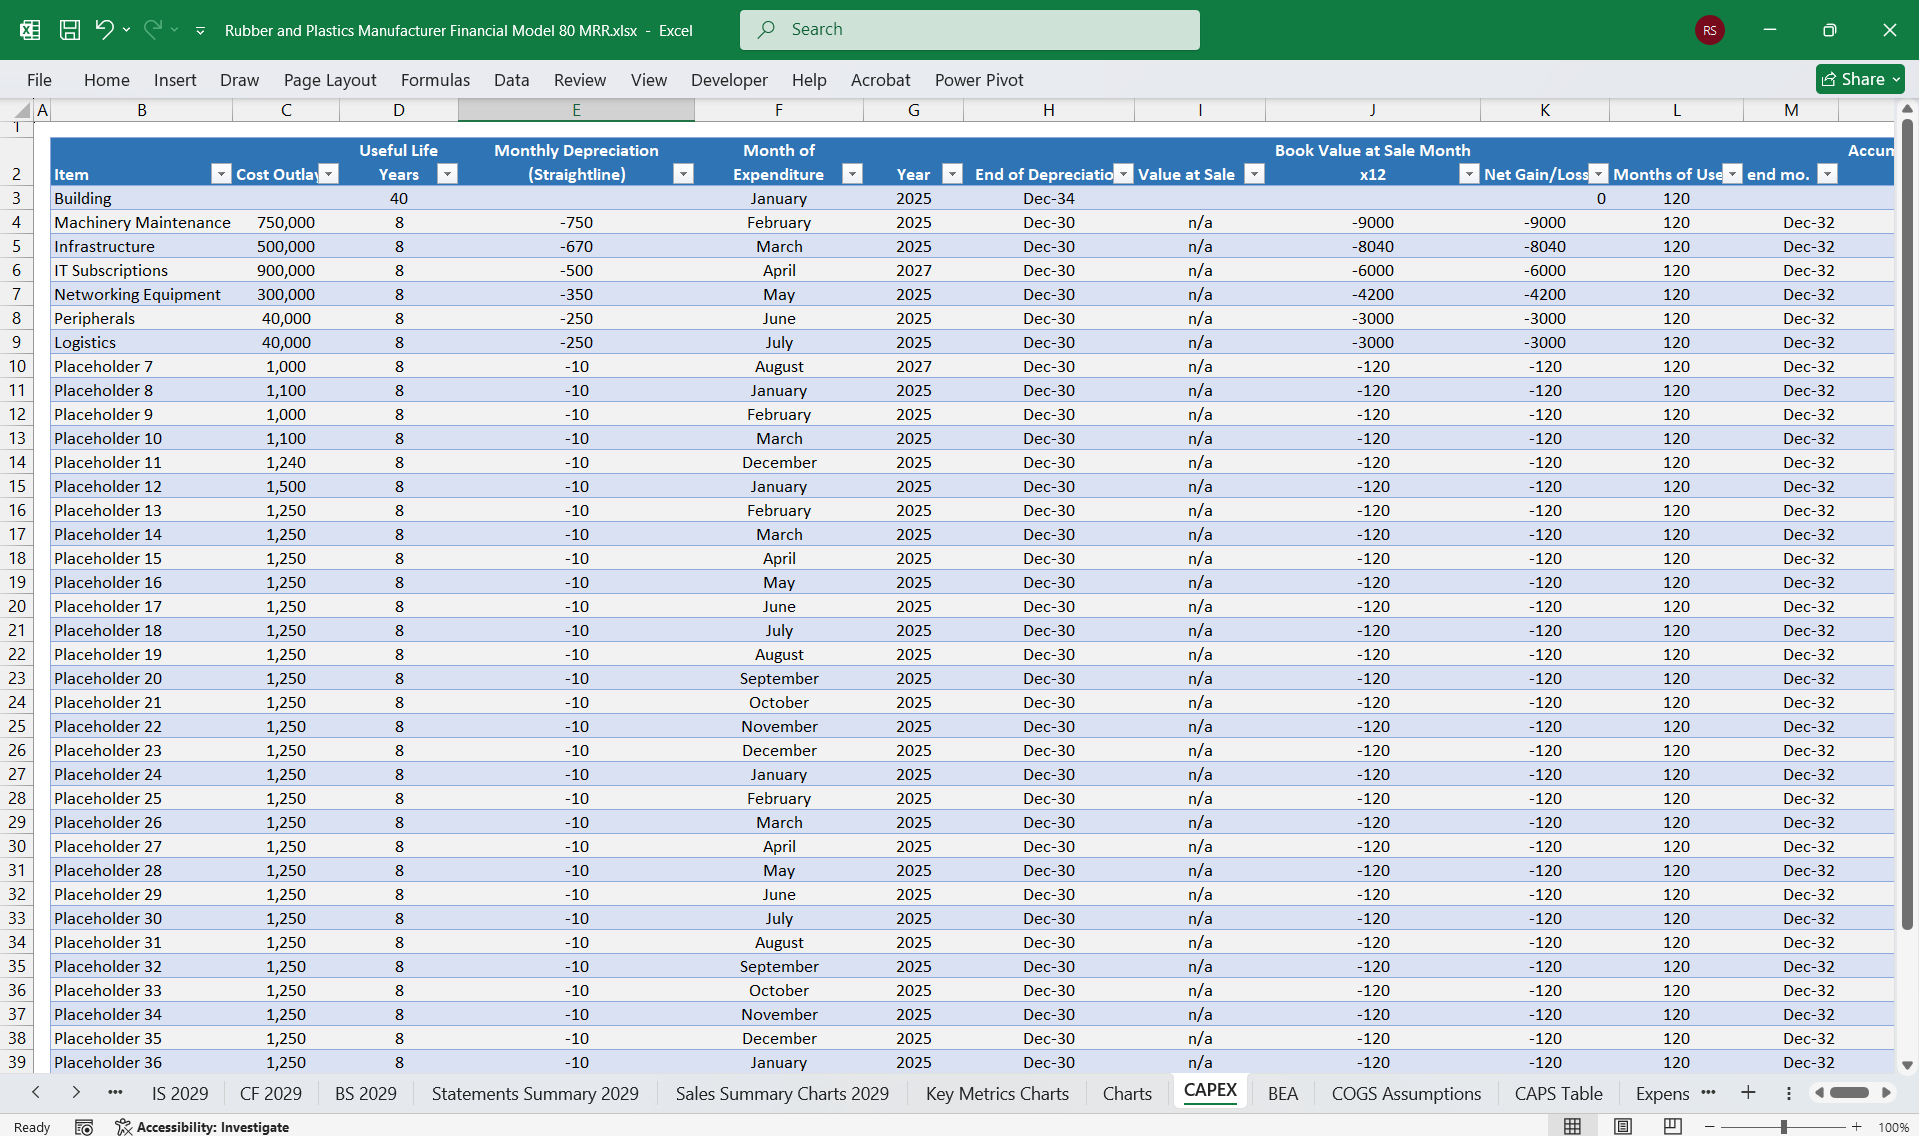
- Procurement of high-efficiency machinery for advanced manufacturing.
- Facility upgrades for larger production lines or eco-compliance upgrades.
- Inflows:
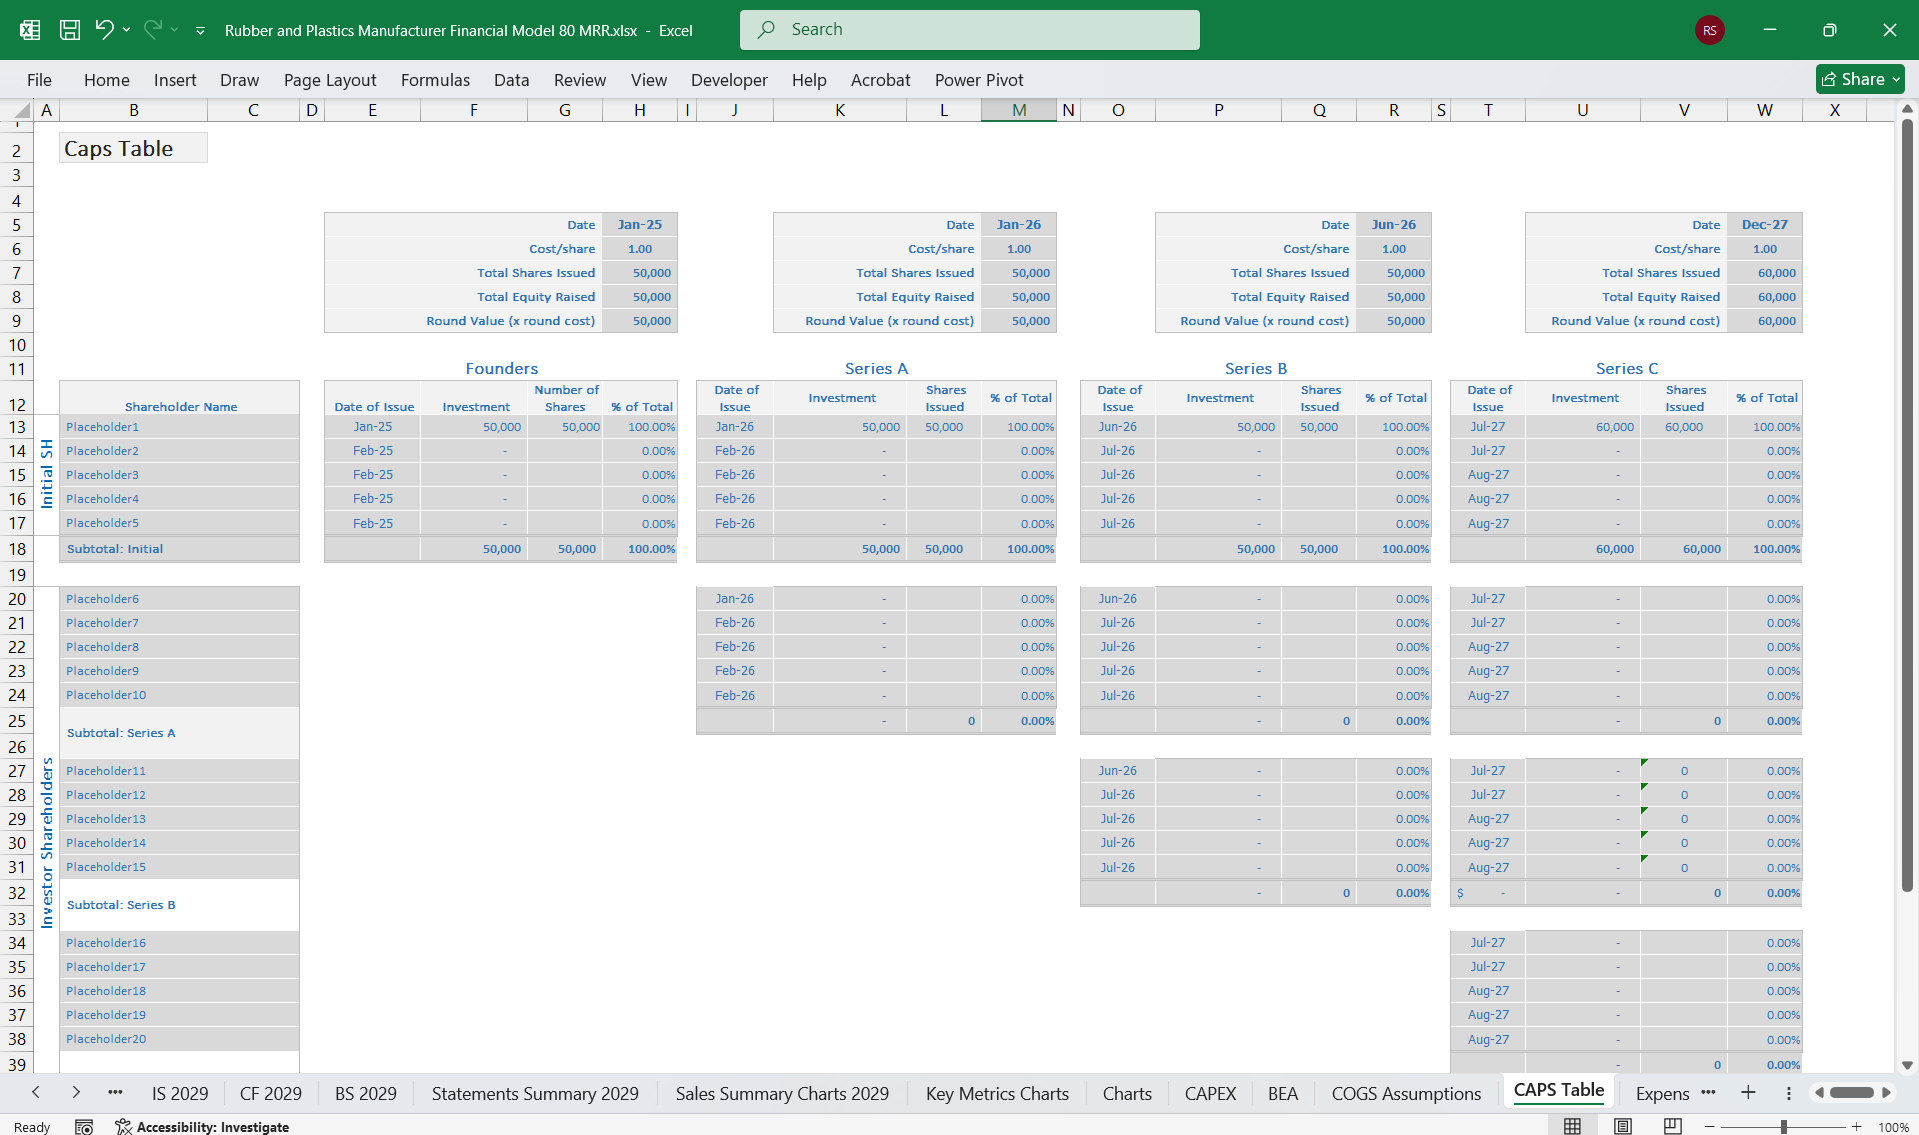
- Equity financing to fund capacity expansion.
- Debt financing for the acquisition of specialty production lines.
- Outflows:
- Debt repayments and shareholder dividends.
- Operating Cash Flow Conversion: Efficiency in turning profits into cash.
- CapEx as % of Revenue: Monitors investments in machinery upgrades.
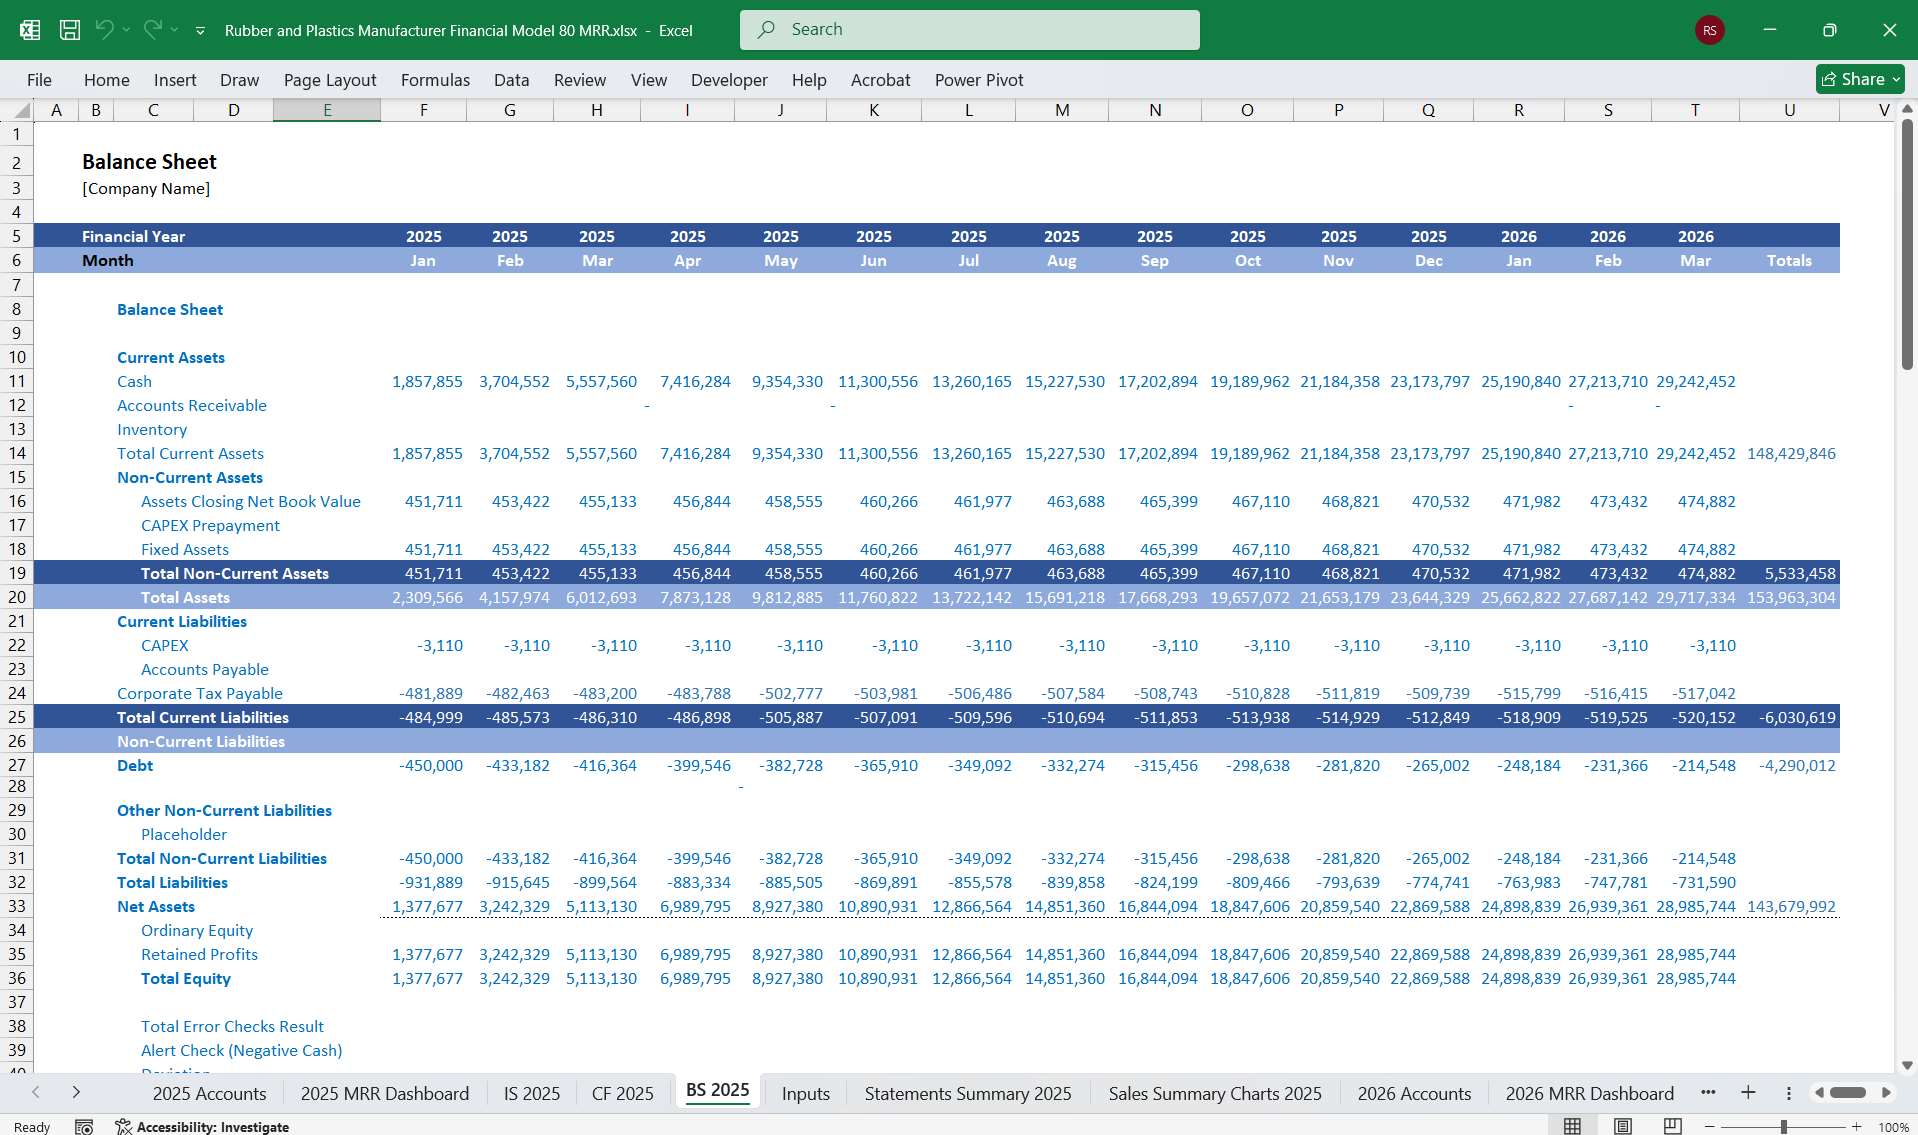
- Current Assets:
- Cash: Liquidity for operational flexibility.
- Inventory:
- Raw materials (e.g., rubber compounds, plastic granules).
- Work-in-progress (semi-finished extrusions, injection molds).
- Finished goods (mats, seals, pipes, packaging).
- Accounts Receivable: Outstanding payments from industrial buyers.
- Non-Current Assets:
- Machinery and Equipment: Extruders, injection molders, and curing presses.
- Patents and IP: Proprietary recipes for rubber or plastic formulations.
- Current Liabilities:
- Supplier payables.
- Accrued expenses for wages and deferred revenue.
- Non-Current Liabilities:
- Long-term loans for facility expansion or automation.
- Retained earnings reinvested for capacity growth.
- Share capital from funding rounds.
Diversifying into specialty and high-margin products.
- Revenue Generation:
- Expansion into premium markets like medical, electronics, or automotive sectors.
- Bespoke products command higher prices (e.g., flame-retardant or biocompatible plastics).
- Cost Management:
- Higher material variety and associated logistics costs.
- Increased R&D investment for advanced formulations.
- Target Customers:
- Larger-scale industrial clients and exports.
- Profit Margins:
- Gross Margin: ~40-50%.
- Net Margin: ~15-18%.
Tier Details
- Tier 1 (Basic):
- Access to material traceability reports.
- Basic analytics for order history.
- Tier 2 (Standard):
- Includes Tier 1 features.
- Mold maintenance reminders and history.
- Tier 3 (Professional):
- Access to eco-certification tracking tools.
- Productivity insights (e.g., efficiency of material utilization).
- Tier 4 (Premium):
- Custom production forecasting and inventory recommendations.
- AI-powered design improvement suggestions.
- Tier 5 (Enterprise):
- Integration with ERP systems for industrial clients.
- Detailed waste reduction insights and sustainability metrics.
- Tier 6 (Custom):
- Dedicated account manager for large-scale clients.
- Full analytics suite tailored to specific needs.
- On-site process assessments for efficiency.
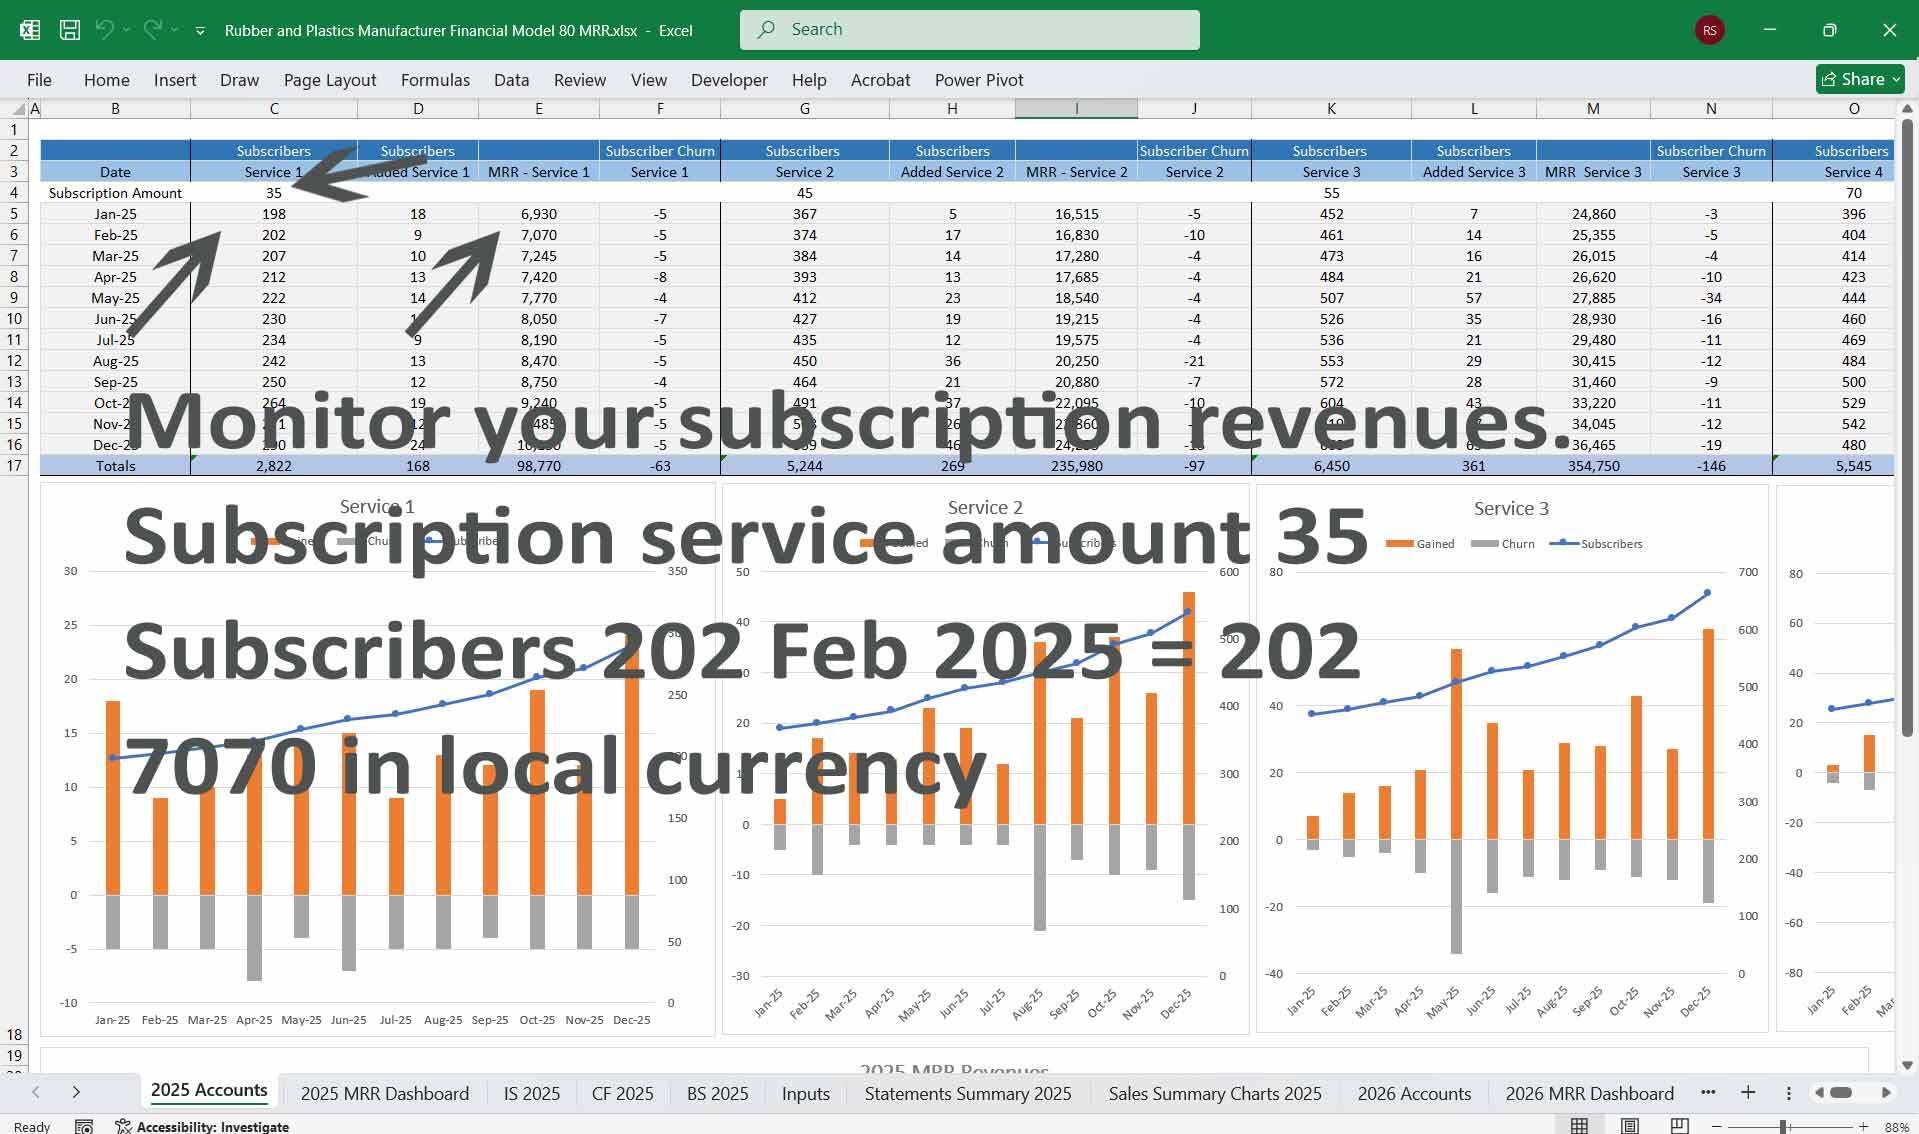
- MRR (Monthly Recurring Revenue): Recurring revenue driven by client adoption.
- ARR (Annual Recurring Revenue) = MRR × 12.
- Customer Lifetime Value (LTV) = Average subscription value × lifespan.
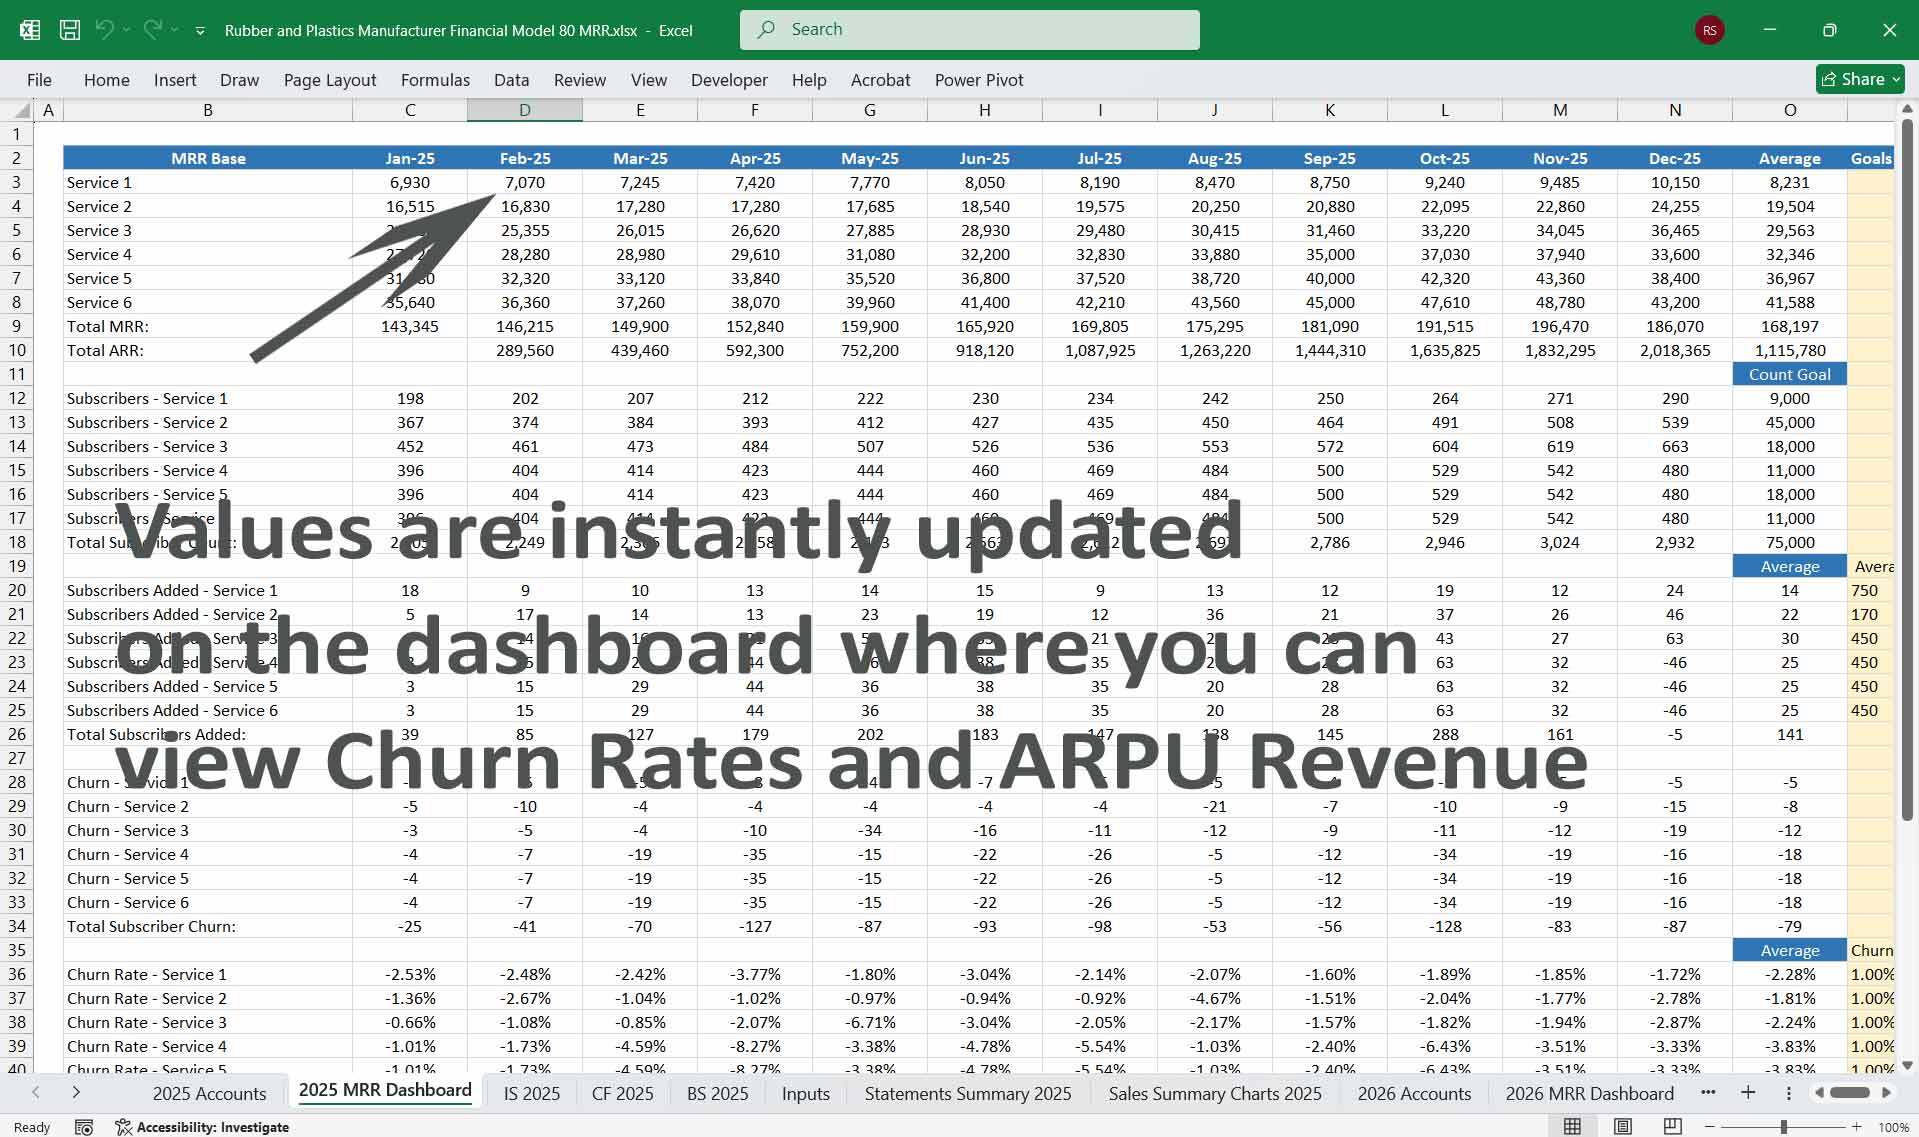
- Churn Rate: Evaluates loss of subscribers over time.
- Customer Acquisition Cost (CAC): Sales/marketing spend per subscription signup.
- Operational Metrics:
- Production cycle time: Efficiency of mold setup and production.
- Inventory turnover: Frequency of raw material and finished goods usage.
- Subscription Metrics:
- Growth rate in tier adoption.
- Average revenue per user by subscription tier.
- Profitability Metrics:
- Contribution margin by product and subscription revenue streams.
- Scenario Comparisons:
- Direct analysis of margins and capacity usage for 80-product scenarios.
This Best Practice includes
1 Excel Financial Model
Further information
Provides thorough oversight, tracking, and reporting of Rubber and Plastics Manufacturer finances, including updates on budget utilisation and projections.
