


Originally published: 28/09/2021 08:19
Publication number: ELQ-21873-1
View all versions & Certificate
Publication number: ELQ-21873-1
View all versions & Certificate

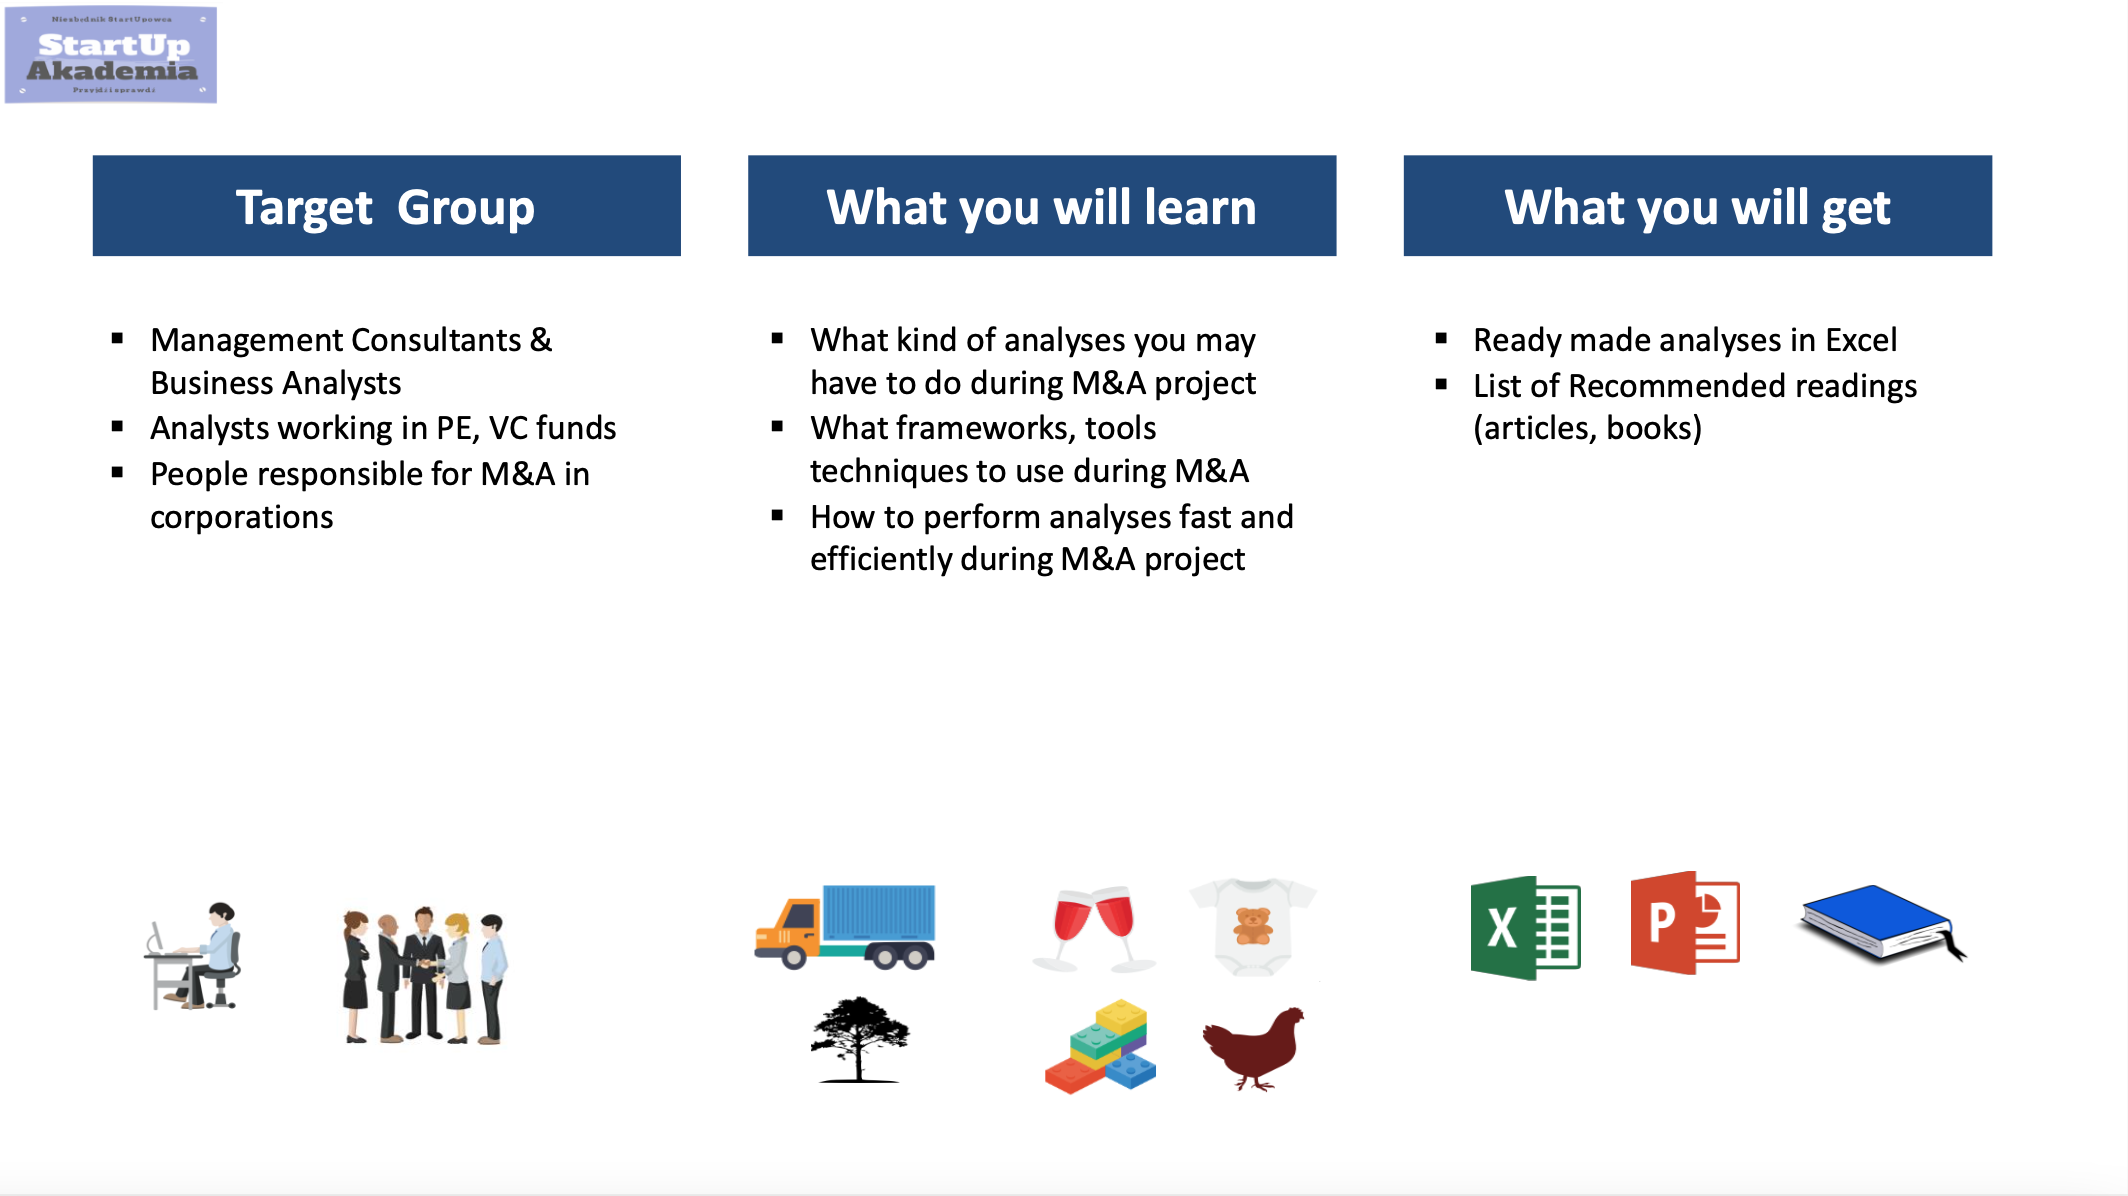
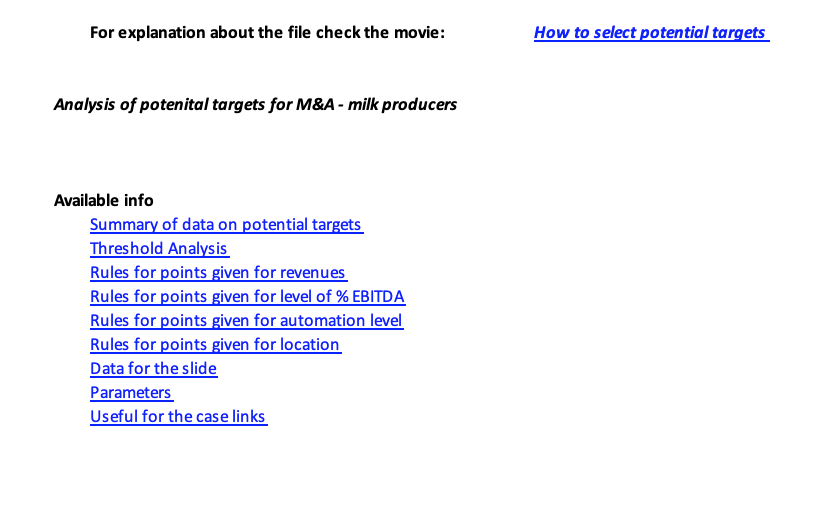
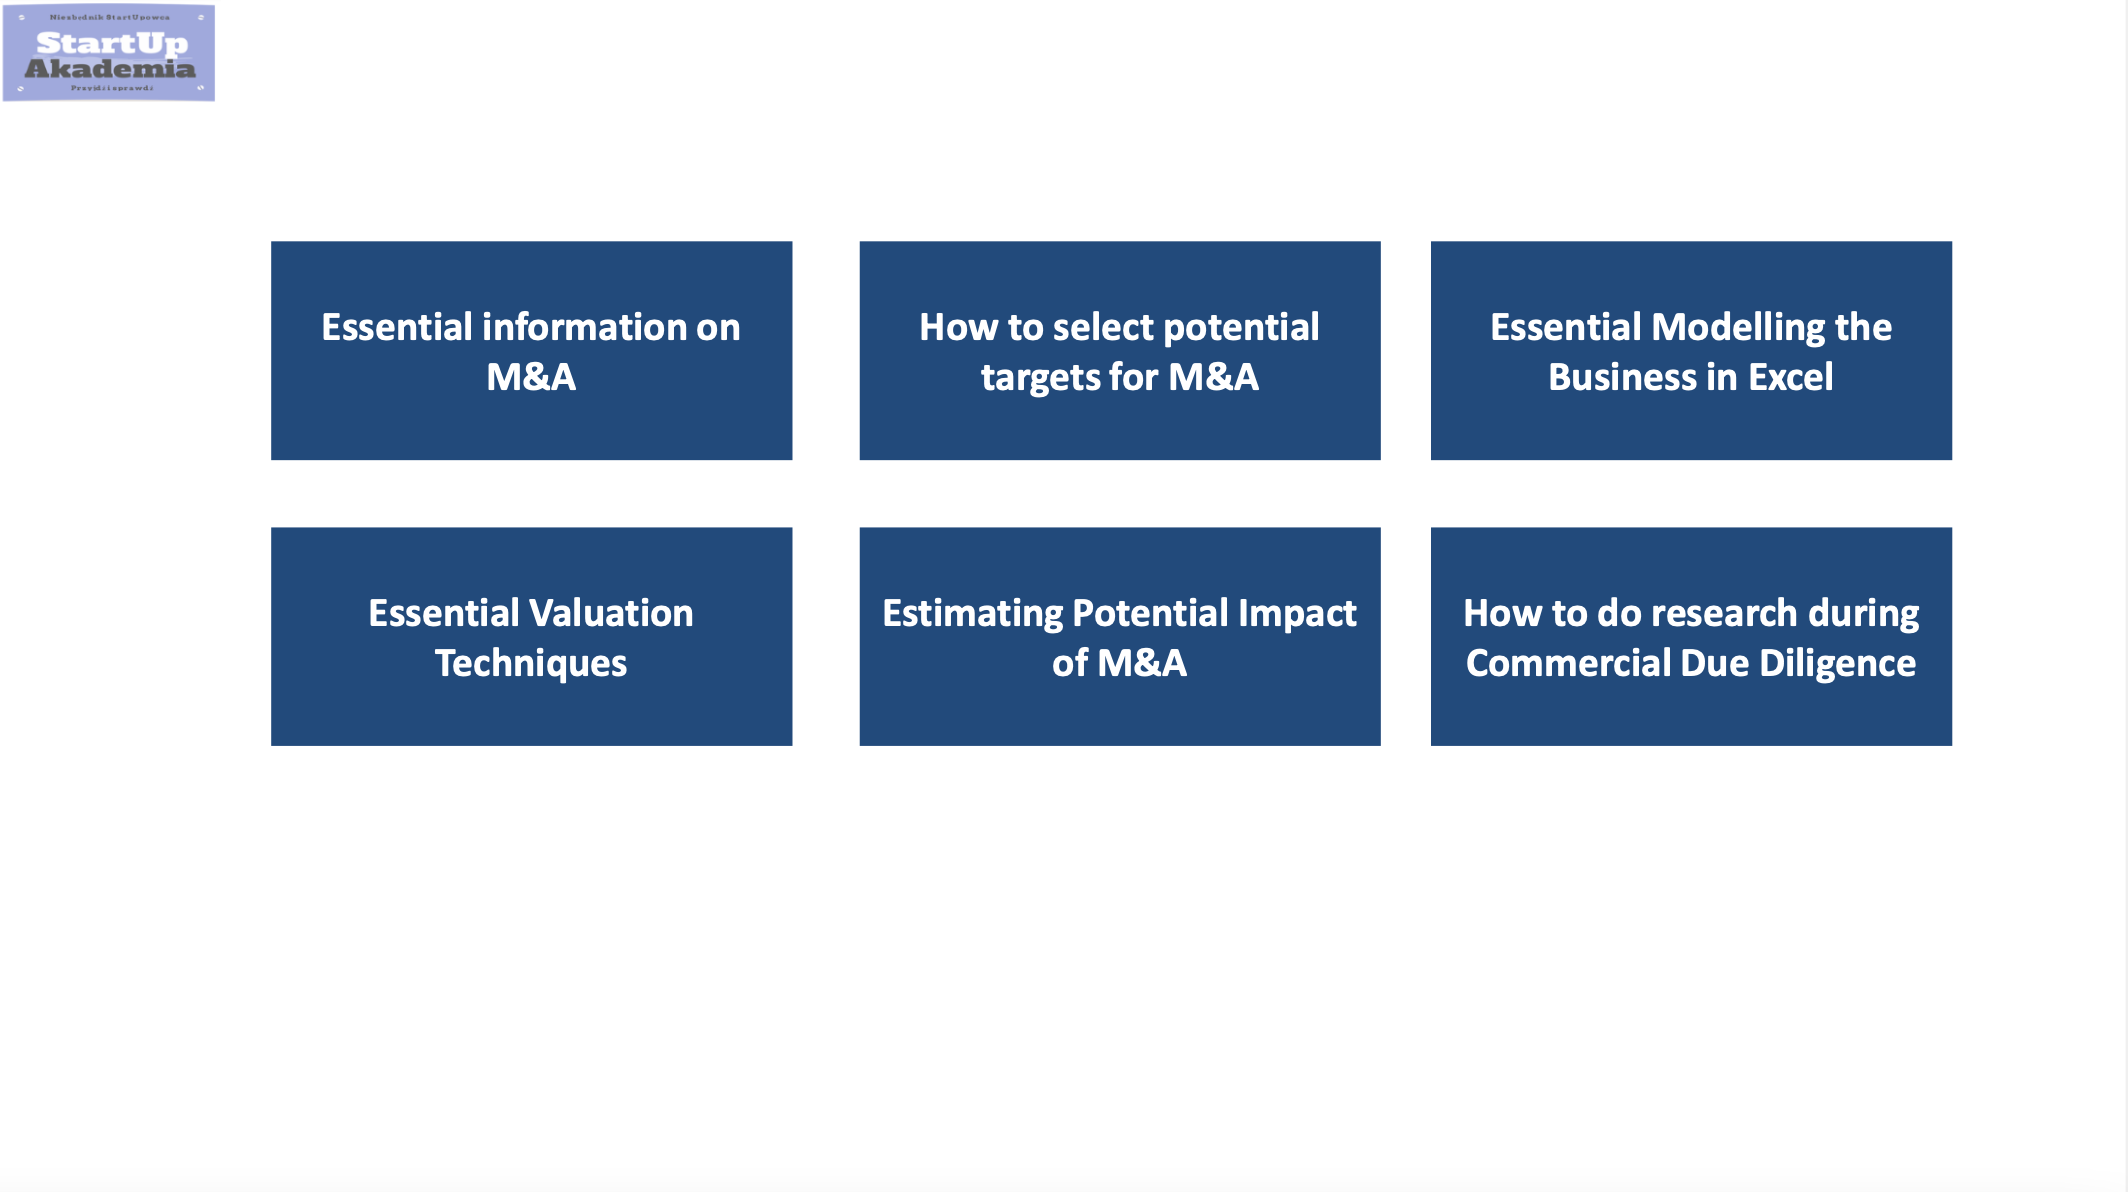
M&A Analysis – Selecting Potential Targets (Examples from Management Consulting Projects)
M&A Analysis – Selecting Potential Targets (Examples from Management Consulting Projects).
Expert in performance improvement and restructuring with significant experienceFollow 444
