
Originally published: 31/03/2021 15:05
Publication number: ELQ-36535-1
View all versions & Certificate
Publication number: ELQ-36535-1
View all versions & Certificate

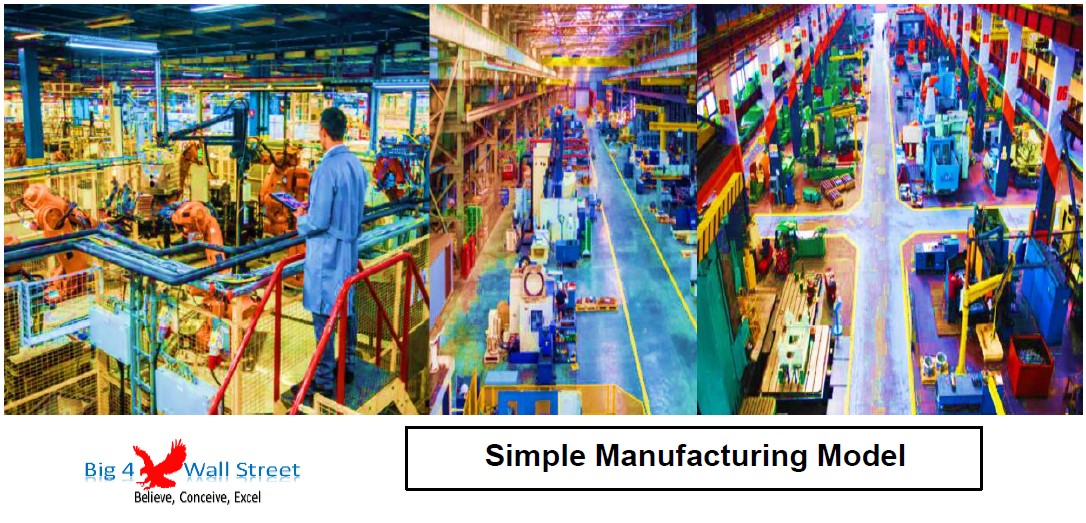
Simple Manufacturing Model
Simple Manufacturing Model consists of an Excel model which presents the case of a 1 page manufacturing model.
excelfinancial modelfinancial modelingmanufacturingproductionproduct lossesreturn lossescostsratiosthree financial statements
Description
Simple Manufacturing Model consists of an Excel model which presents the case of a 1 page model for an already operating manufacturing company. The model generates the three financial statements (profit and loss, balance sheet, and cash flow) and performs a valuation, along with financial ratios.
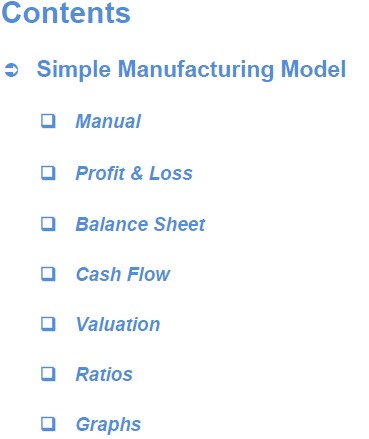
So, a quick overview of the model, in the contents tab you can see the structure of the model and by clicking on any of the headlines to be redirected to the relevant cells.
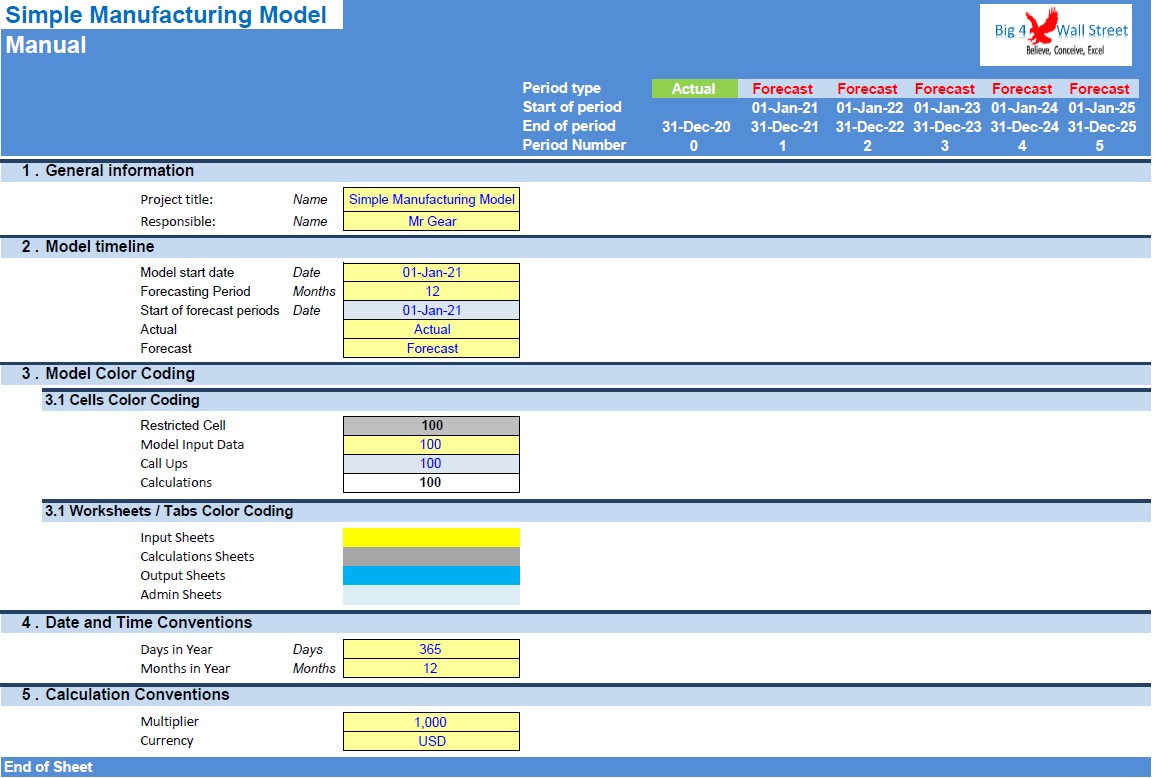
On the manual tab you can feed the general information for the model such as: model name, responsible, timeline of the model and date and currency conventions.
Additionally, there is a description of the color coding of the model in the same tab. Inputs are always depicted with a yellow fill and blue letters, call up (that is direct links from other cells) are filled in light blue with blue letters while calculations are depicted with white fill and black characters. Grey cells are restricted cells which you must not change.
There is also a color coding for the various tabs of the model. Yellow tabs are mostly assumptions tabs, grey tabs are calculations tabs, blue tabs are outputs tabs (that is effectively results or graphs) and finally light blue tabs are admin tabs (for example: the cover page, and contents).
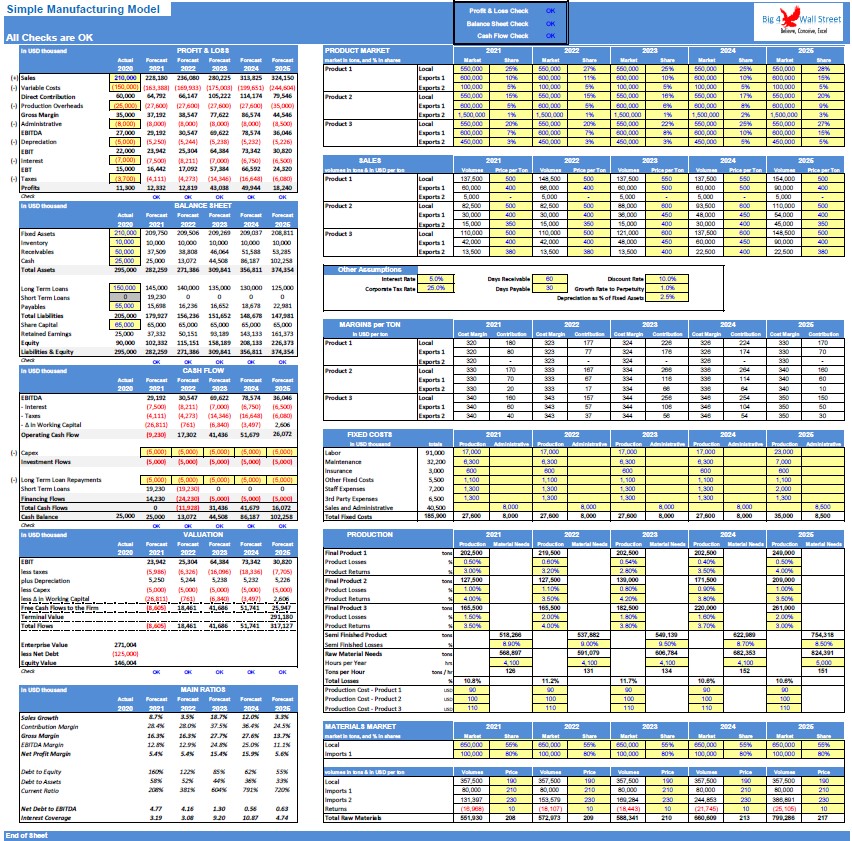
Moving on the the "Inputs - Outputs" tab, the user can amend various assumptions on the right side of the worksheet (from columns K to V). Such assumptions consist of Market and Market Share per Product, Volumes and Prices per Product, other assumptions ( interest rate, taxes, receivables, payables, discount rate, growth rate and depreciation as percentage of fixed assets).
Additionally the user is able to change the fixed costs of production, the administrative fixed costs, as well as the production costs per product. Finally the user is also able to change the materials market and share, as well as the raw materials purchase price per market.
The left side is focusing on the outputs such as the profit and loss, the balance sheet and the cash flow statement. Additionally a valuation is performed together with the main financial ratios.
On the top of the page, the checks make sure that everything is working as planned.
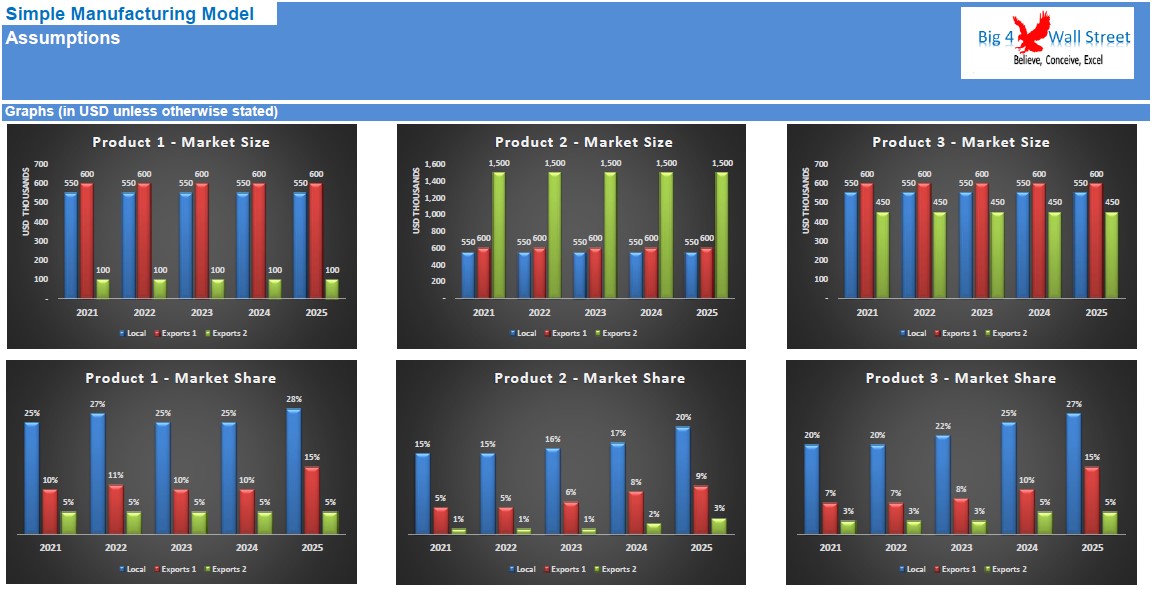
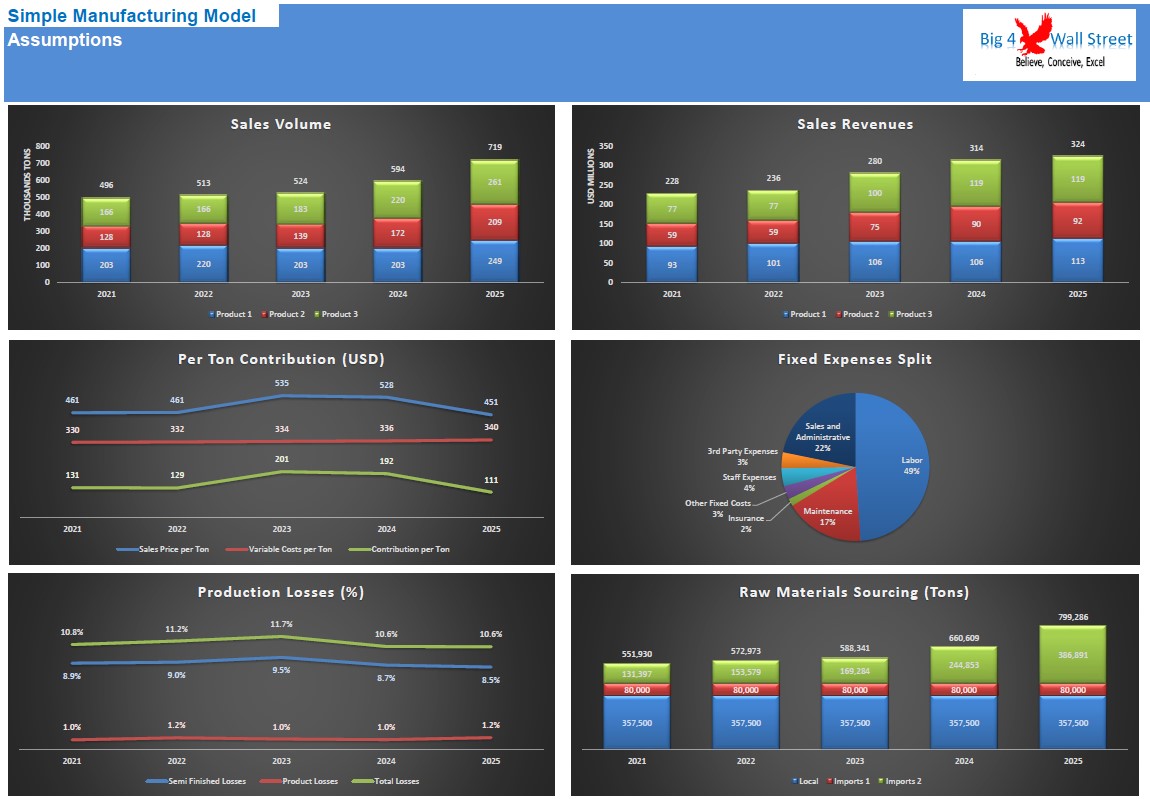
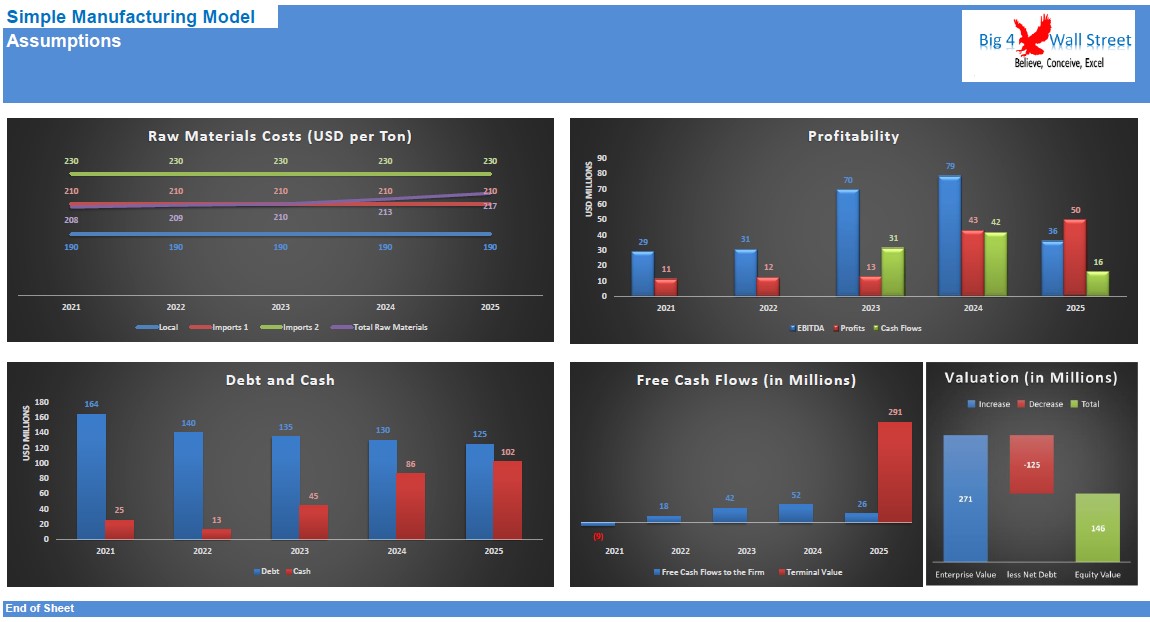
Finally the last tab consists of various graphs, from market size and shares, volumes sold and revenues, per ton contribution, fixed expenses split, production losses, raw materials sourcing and costs, profitability, debt and cash, as well as free cash flows to the firm and valuation.
Simple Manufacturing Model consists of an Excel model which presents the case of a 1 page model for an already operating manufacturing company. The model generates the three financial statements (profit and loss, balance sheet, and cash flow) and performs a valuation, along with financial ratios.
So, a quick overview of the model, in the contents tab you can see the structure of the model and by clicking on any of the headlines to be redirected to the relevant cells.
On the manual tab you can feed the general information for the model such as: model name, responsible, timeline of the model and date and currency conventions.
Additionally, there is a description of the color coding of the model in the same tab. Inputs are always depicted with a yellow fill and blue letters, call up (that is direct links from other cells) are filled in light blue with blue letters while calculations are depicted with white fill and black characters. Grey cells are restricted cells which you must not change.
There is also a color coding for the various tabs of the model. Yellow tabs are mostly assumptions tabs, grey tabs are calculations tabs, blue tabs are outputs tabs (that is effectively results or graphs) and finally light blue tabs are admin tabs (for example: the cover page, and contents).
Moving on the the "Inputs - Outputs" tab, the user can amend various assumptions on the right side of the worksheet (from columns K to V). Such assumptions consist of Market and Market Share per Product, Volumes and Prices per Product, other assumptions ( interest rate, taxes, receivables, payables, discount rate, growth rate and depreciation as percentage of fixed assets).
Additionally the user is able to change the fixed costs of production, the administrative fixed costs, as well as the production costs per product. Finally the user is also able to change the materials market and share, as well as the raw materials purchase price per market.
The left side is focusing on the outputs such as the profit and loss, the balance sheet and the cash flow statement. Additionally a valuation is performed together with the main financial ratios.
On the top of the page, the checks make sure that everything is working as planned.
Finally the last tab consists of various graphs, from market size and shares, volumes sold and revenues, per ton contribution, fixed expenses split, production losses, raw materials sourcing and costs, profitability, debt and cash, as well as free cash flows to the firm and valuation.
This Best Practice includes
1 Excel and 1 PDF
