Originally published: 31/05/2021 08:56
Publication number: ELQ-65902-1
View all versions & Certificate
Publication number: ELQ-65902-1
View all versions & Certificate

New Business Revenue Financial Model- Fully Dynamic
A financial model to calculate revenue based on a variety of assumptions, inputs, and choices.
Description
Users will learn advanced Excel modeling techniques and functions. The model uses inputs and user drop-downs to create a revenue estimate that is flexible to changing demands.
The Scenario:
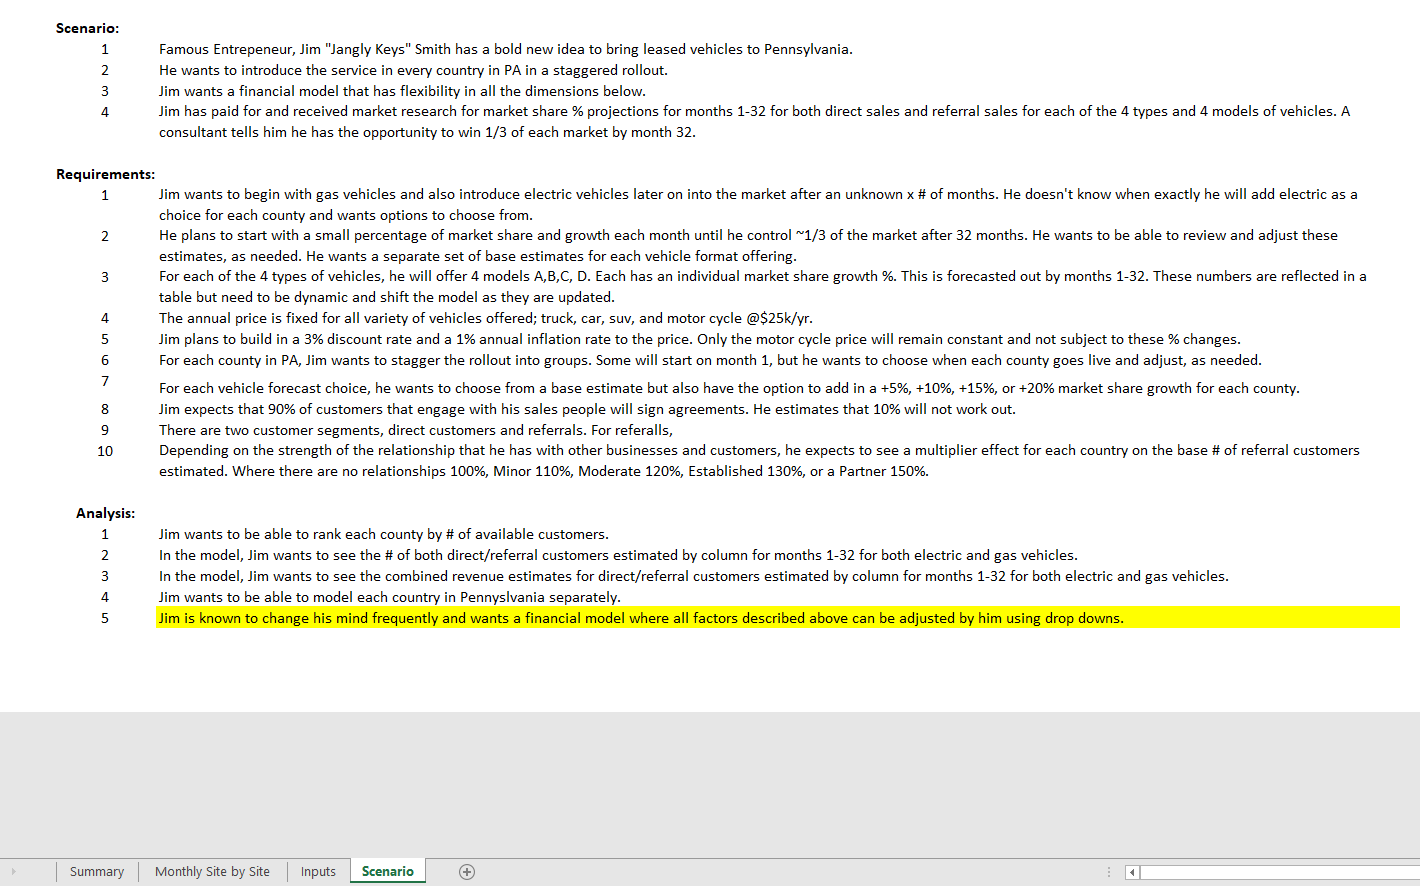
Scenario:
1 Famous Entrepreneur, Jim "Jangly Keys" Smith, has a bold new idea to bring leased vehicles to Pennsylvania.
2 He wants to introduce the service in every country in PA in a staggered rollout.
3 Jim wants a financial model that has flexibility in all the dimensions below.
4 Jim has paid for and received market research for market share % projections for months 1-32 for both direct sales and referral sales for each of the 4 types and 4 models of vehicles. A consultant tells him he has the opportunity to win 1/3 of each market by month 32.
Requirements:
1 Jim wants to begin with gas vehicles and also introduce electric vehicles later on into the market after an unknown x # of months. He doesn't know when exactly he will add electric as a choice for each county and wants options to choose from.
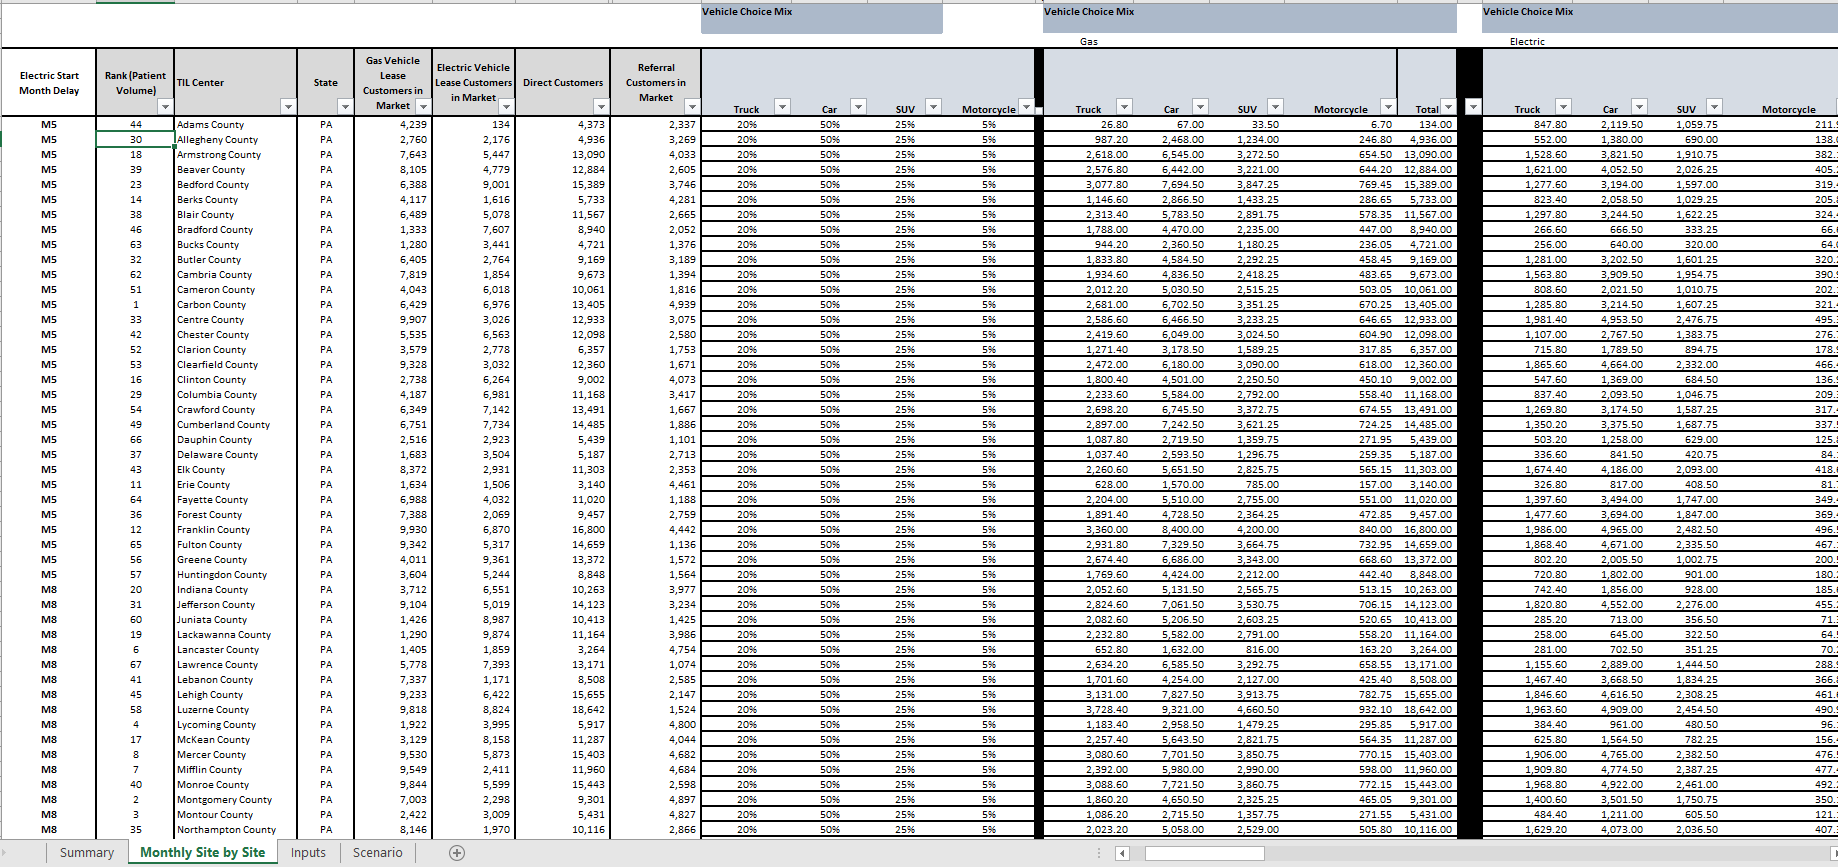
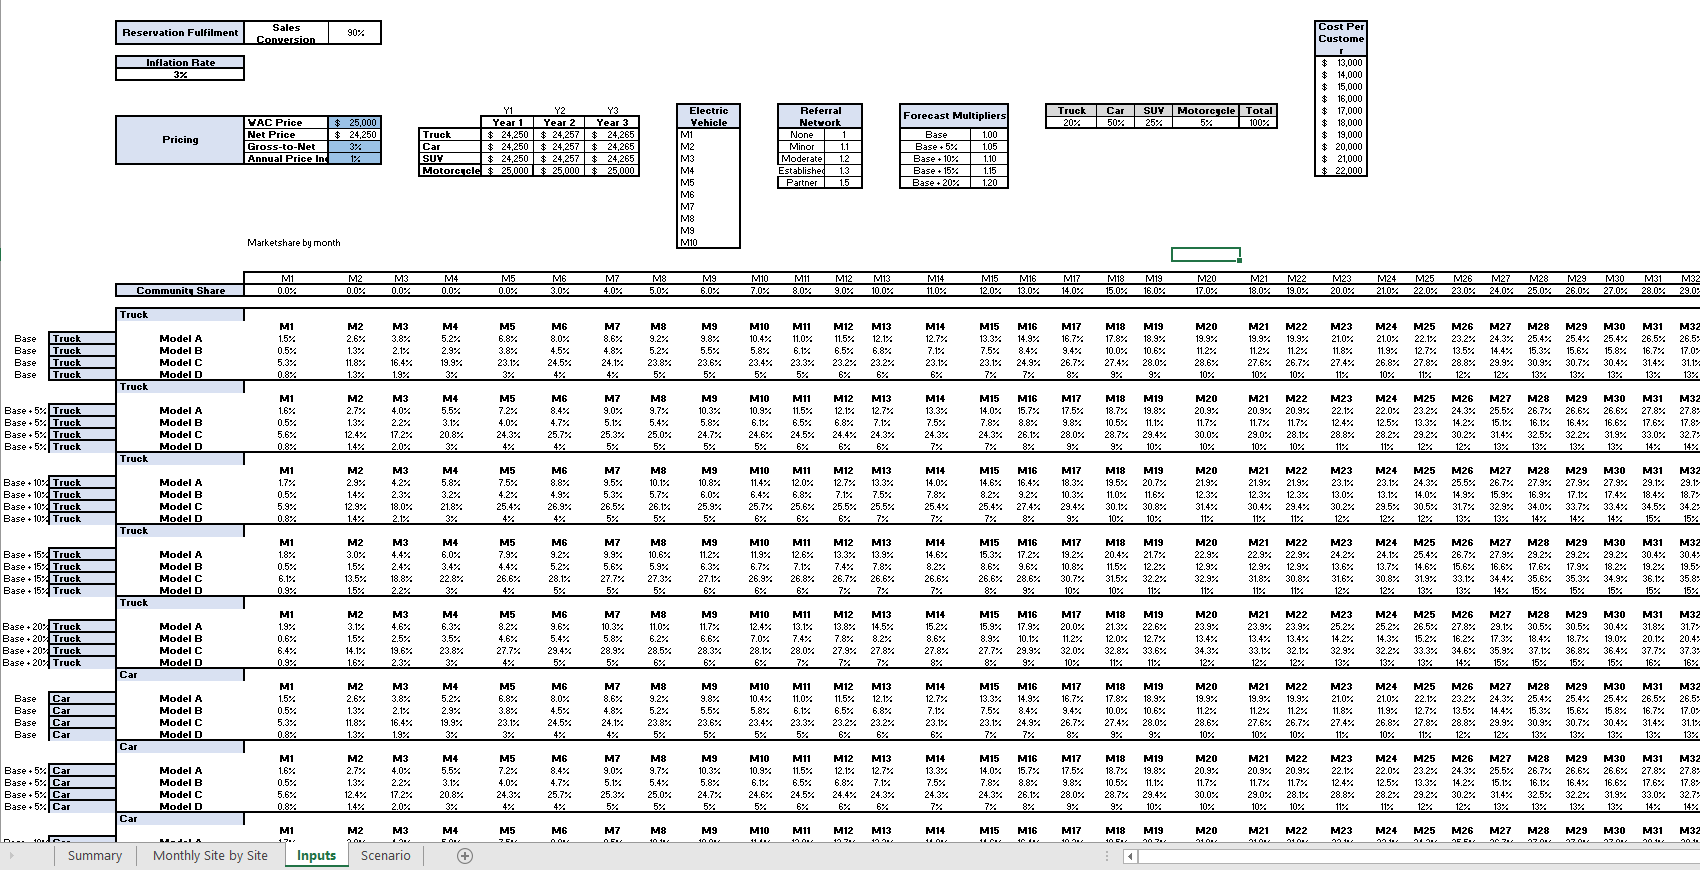
2 He plans to start with a small percentage of market share and growth each month until he controls ~1/3 of the market after 32 months. He wants to be able to review and adjust these estimates as needed. He wants a separate set of base estimates for each vehicle format offering.
3 For each of the 4 types of vehicles, he will offer 4 models, A, B, C, D. Each has an individual market share growth %. This is forecasted out by months 1-32. These numbers are reflected in a table but need to be dynamic and shift the model as they are updated.
4 The annual price is fixed for all variety of vehicles offered; truck, car, SUV, and motorcycle @$25k/yr.
5 Jim plans to build in a 3% discount rate and a 1% annual inflation rate to the price. Only the motorcycle price will remain constant and not subject to these % changes.
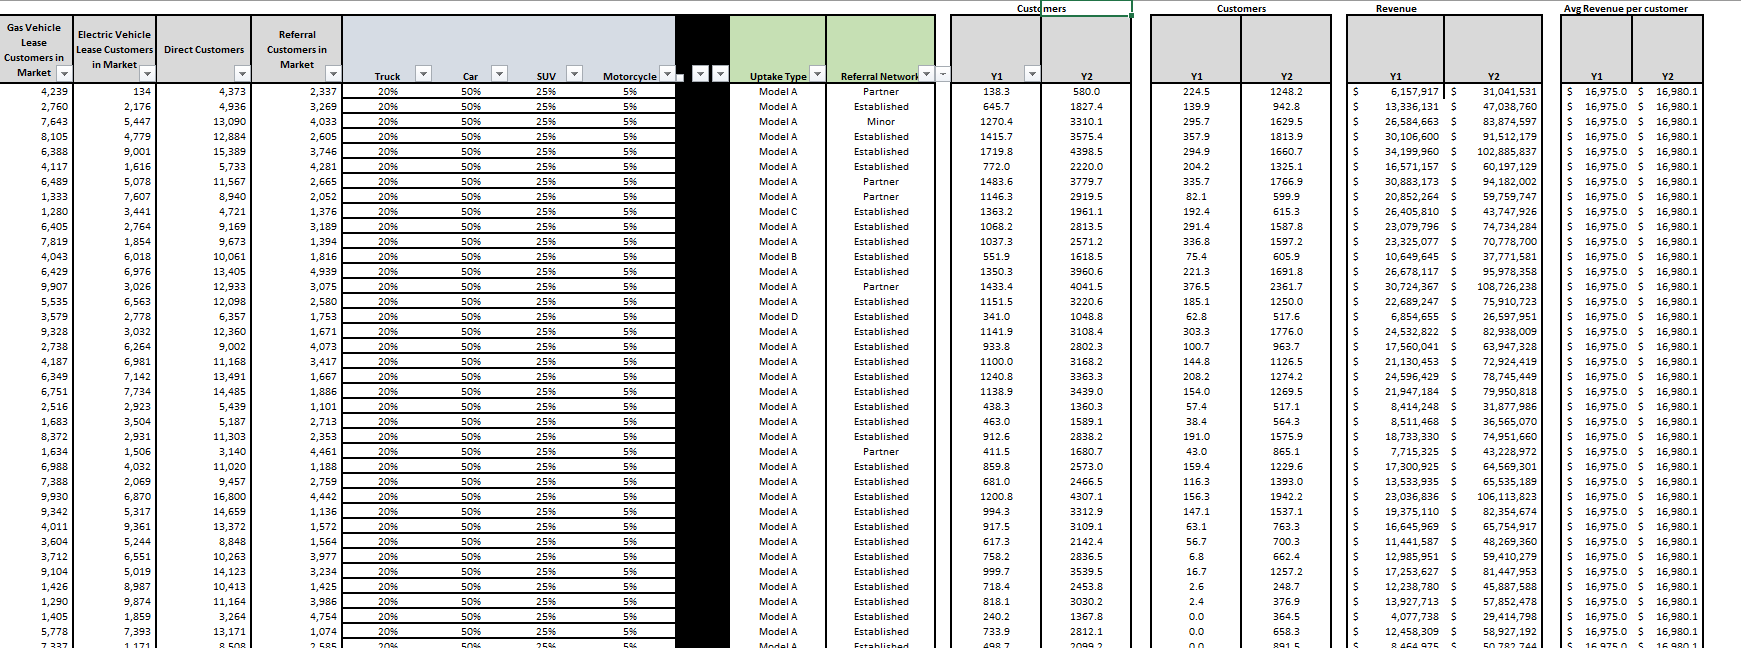
6 For each county in PA, Jim wants to stagger the rollout into groups. Some will start on month 1, but he wants to choose when each county goes live and adjust as needed.
7 For each vehicle forecast choice, he wants to choose from a base estimate but also has the option to add in a +5%, +10%, +15%, or +20% market share growth for each county.
8 Jim expects that 90% of customers that engage with his salespeople will sign agreements. He estimates that 10% will not work out.
9 There are two customer segments, direct customers and referrals. There is a separate forecast for each in the inputs.
10 Depending on the strength of his relationship with other businesses and customers, he expects to see a multiplier effect for each country on the base # of referral customers estimated. Where there are no relationships 100%, Minor 110%, Moderate 120%, Established 130%, or a Partner 150%.
Analysis:
1 Jim wants to be able to rank each county by # of available customers.
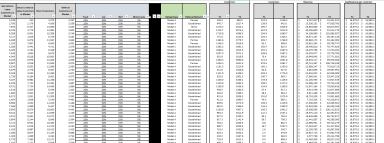
2 In the model, Jim wants to see the # of both direct/referral customers estimated by column for months 1-32 for both electric and gas vehicles.
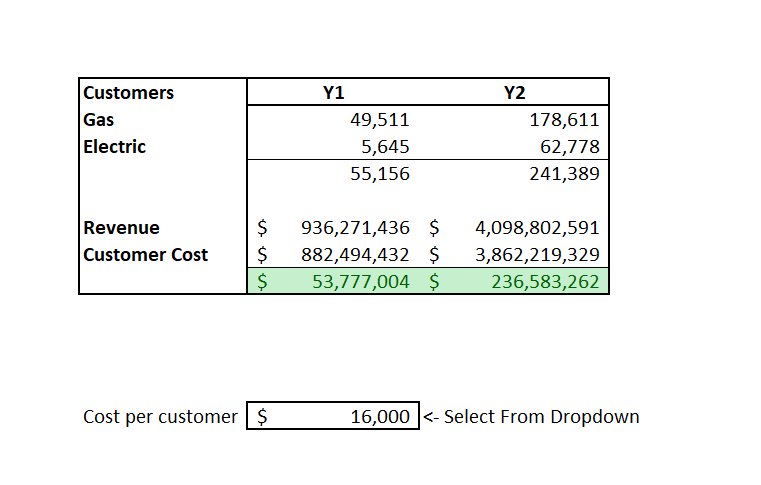
3 In the model, Jim wants to see the combined revenue estimates for direct/referral customers estimated by column for months 1-32 for both electric and gas vehicles.
4 Jim wants to be able to model each country in Pennsylvania separately.
5 Jim is known to change his mind frequently and wants a financial model where all factors described above can be adjusted by him using dropdowns.
Users will learn advanced Excel modeling techniques and functions. The model uses inputs and user drop-downs to create a revenue estimate that is flexible to changing demands.
The Scenario:
Scenario:
1 Famous Entrepreneur, Jim "Jangly Keys" Smith, has a bold new idea to bring leased vehicles to Pennsylvania.
2 He wants to introduce the service in every country in PA in a staggered rollout.
3 Jim wants a financial model that has flexibility in all the dimensions below.
4 Jim has paid for and received market research for market share % projections for months 1-32 for both direct sales and referral sales for each of the 4 types and 4 models of vehicles. A consultant tells him he has the opportunity to win 1/3 of each market by month 32.
Requirements:
1 Jim wants to begin with gas vehicles and also introduce electric vehicles later on into the market after an unknown x # of months. He doesn't know when exactly he will add electric as a choice for each county and wants options to choose from.
2 He plans to start with a small percentage of market share and growth each month until he controls ~1/3 of the market after 32 months. He wants to be able to review and adjust these estimates as needed. He wants a separate set of base estimates for each vehicle format offering.
3 For each of the 4 types of vehicles, he will offer 4 models, A, B, C, D. Each has an individual market share growth %. This is forecasted out by months 1-32. These numbers are reflected in a table but need to be dynamic and shift the model as they are updated.
4 The annual price is fixed for all variety of vehicles offered; truck, car, SUV, and motorcycle @$25k/yr.
5 Jim plans to build in a 3% discount rate and a 1% annual inflation rate to the price. Only the motorcycle price will remain constant and not subject to these % changes.
6 For each county in PA, Jim wants to stagger the rollout into groups. Some will start on month 1, but he wants to choose when each county goes live and adjust as needed.
7 For each vehicle forecast choice, he wants to choose from a base estimate but also has the option to add in a +5%, +10%, +15%, or +20% market share growth for each county.
8 Jim expects that 90% of customers that engage with his salespeople will sign agreements. He estimates that 10% will not work out.
9 There are two customer segments, direct customers and referrals. There is a separate forecast for each in the inputs.
10 Depending on the strength of his relationship with other businesses and customers, he expects to see a multiplier effect for each country on the base # of referral customers estimated. Where there are no relationships 100%, Minor 110%, Moderate 120%, Established 130%, or a Partner 150%.
Analysis:
1 Jim wants to be able to rank each county by # of available customers.
2 In the model, Jim wants to see the # of both direct/referral customers estimated by column for months 1-32 for both electric and gas vehicles.
3 In the model, Jim wants to see the combined revenue estimates for direct/referral customers estimated by column for months 1-32 for both electric and gas vehicles.
4 Jim wants to be able to model each country in Pennsylvania separately.
5 Jim is known to change his mind frequently and wants a financial model where all factors described above can be adjusted by him using dropdowns.
This Best Practice includes
1 Excel Workbook
