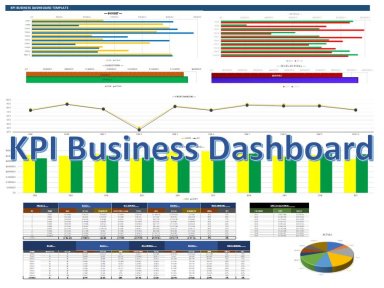
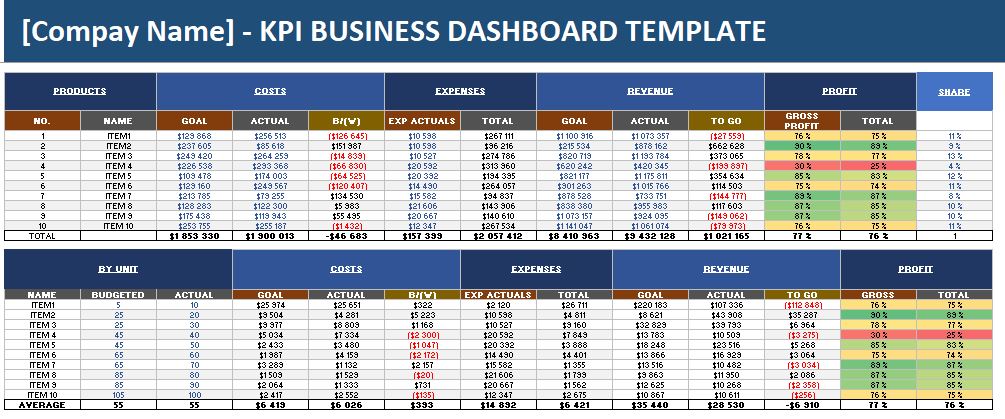
KPI Business Chart

KPI Business Dashboard

Description
This dashboard report is a powerful tool for meeting business objectives, displaying vital company data in a one-page layout. Excel dashboards typically include multiple spreadsheets. This one is simplified to a single one containing the front-facing page which graphically displays information using tables, charts, maps, and gauges (also referred to as speedometers). The abls in the Excel dashboard hold the data that is being tracked and the calculations that are being used to analyze that data.
Excel dashboards can look quite different depending on business needs. This one contains only vital KPI Business data to show Sales performance in terms of revenue and profit at product level. Oce included the total revenue from sales of a determined product together with its costs and direct expenses, the file will automatically update the charts, and the deviation of actuals from the budgeted goals.
By inserting the volumes of sales, both expected and final, in the table at the bottom, the file will autmatically calculate revenue, costs and amrgin at single unit level.
Once you have included the data, you will have yhe most relevant picture of the performance of the performance of your portfolio of products in a single place.

From this very simple dashboard you will se what are the ones that are performing better and the ones performing worse and you can then start performing additional analysis into the details in order to understand the root causes.

This Best Practice includes
One excel file with simple automatic graphics of revenue and profit of a portfolio pf products.

Acquire business license for $12.00

Add to cart

Add to bookmarks

Discuss


0.0 / 5 (0 votes)

please wait...