Self Storage Facility 5-Year Financial Model Excel | Occupancy, Cash Flow, Break-Even, Scenarios & Investor Deck

5-year self storage financial model with occupancy, rental revenue, three statements, break-even, scenarios, sensitivity, funding analysis, deck and PDF guide.

Description

๐Ÿ“Š SELF STORAGE FACILITY โ€“ 5-YEAR FINANCIAL MODEL & INVESTMENT FORECAST


Plan facility revenue, occupancy, rental rates, operating expenses, staffing, CapEx, debt, liquidity, and funding requirements with an integrated financial model built specifically for self storage facilities.


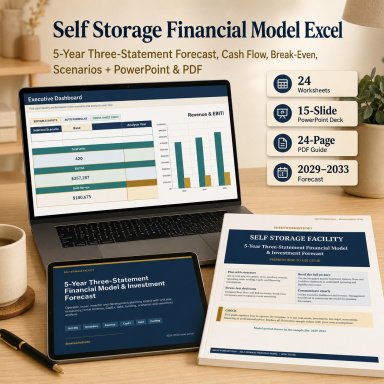
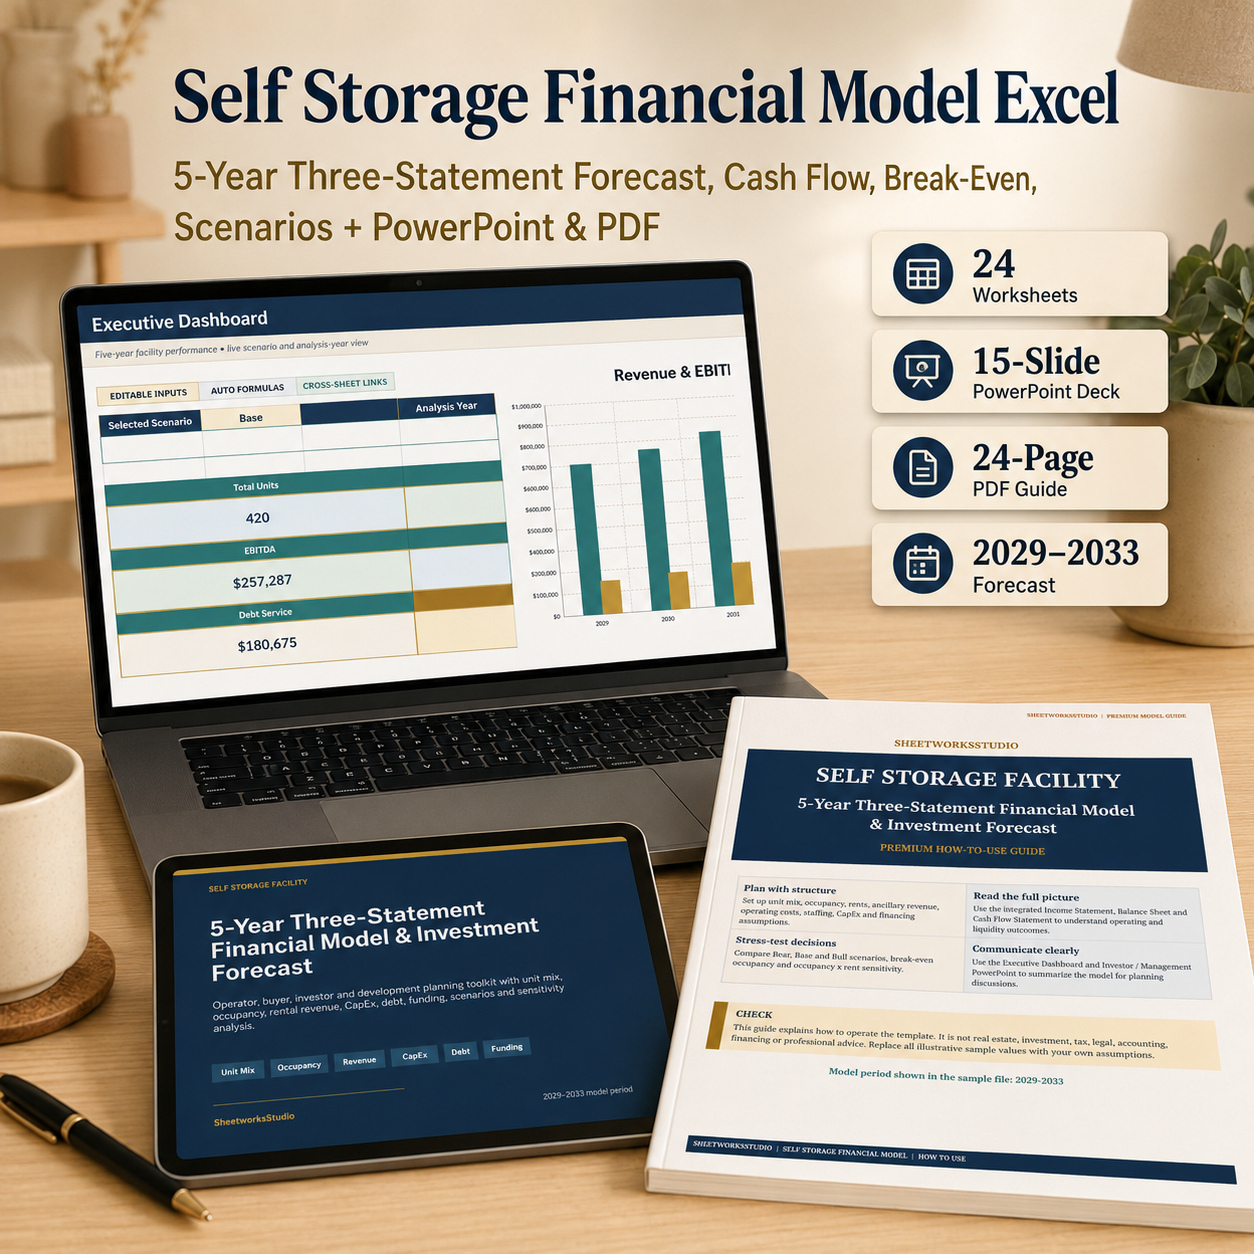
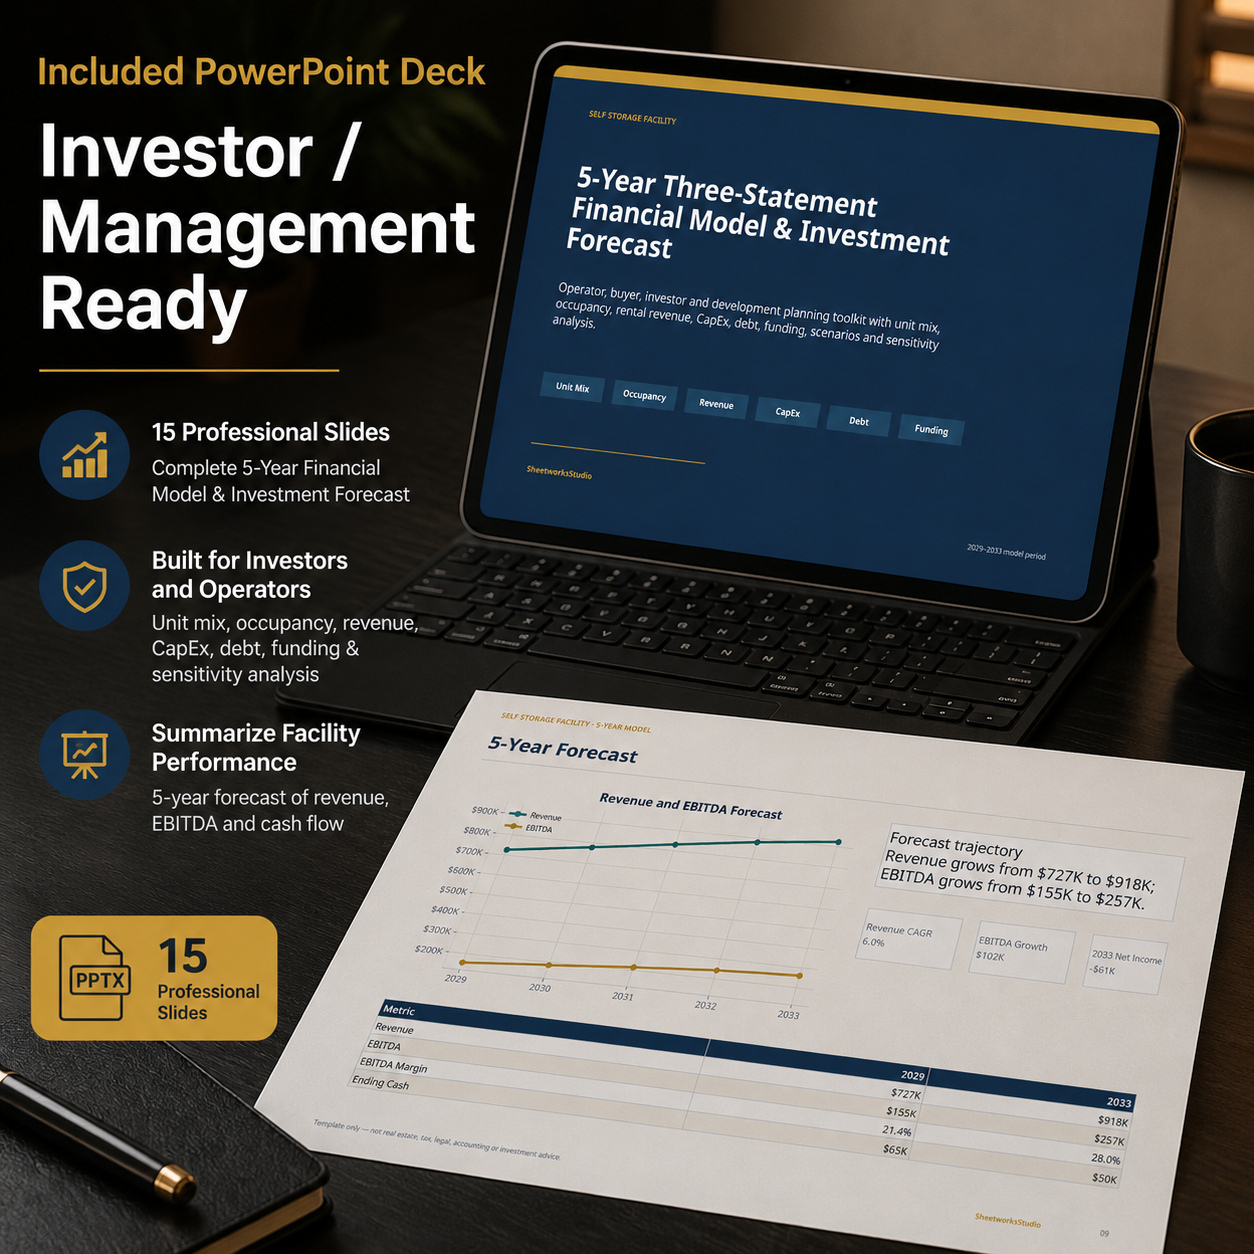
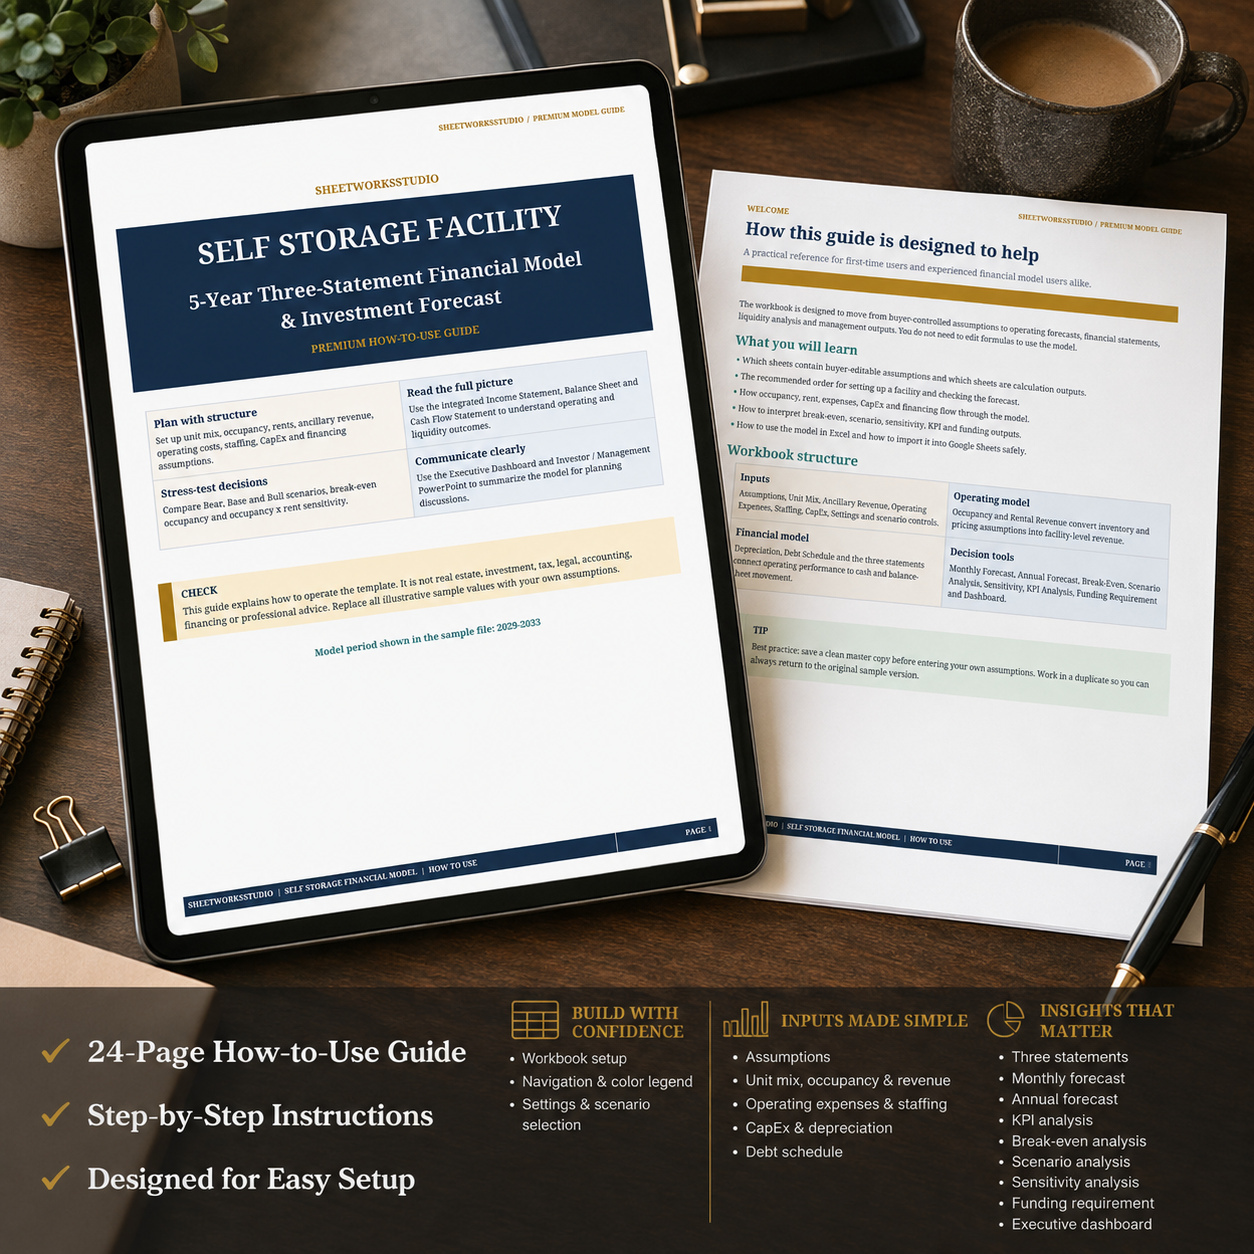
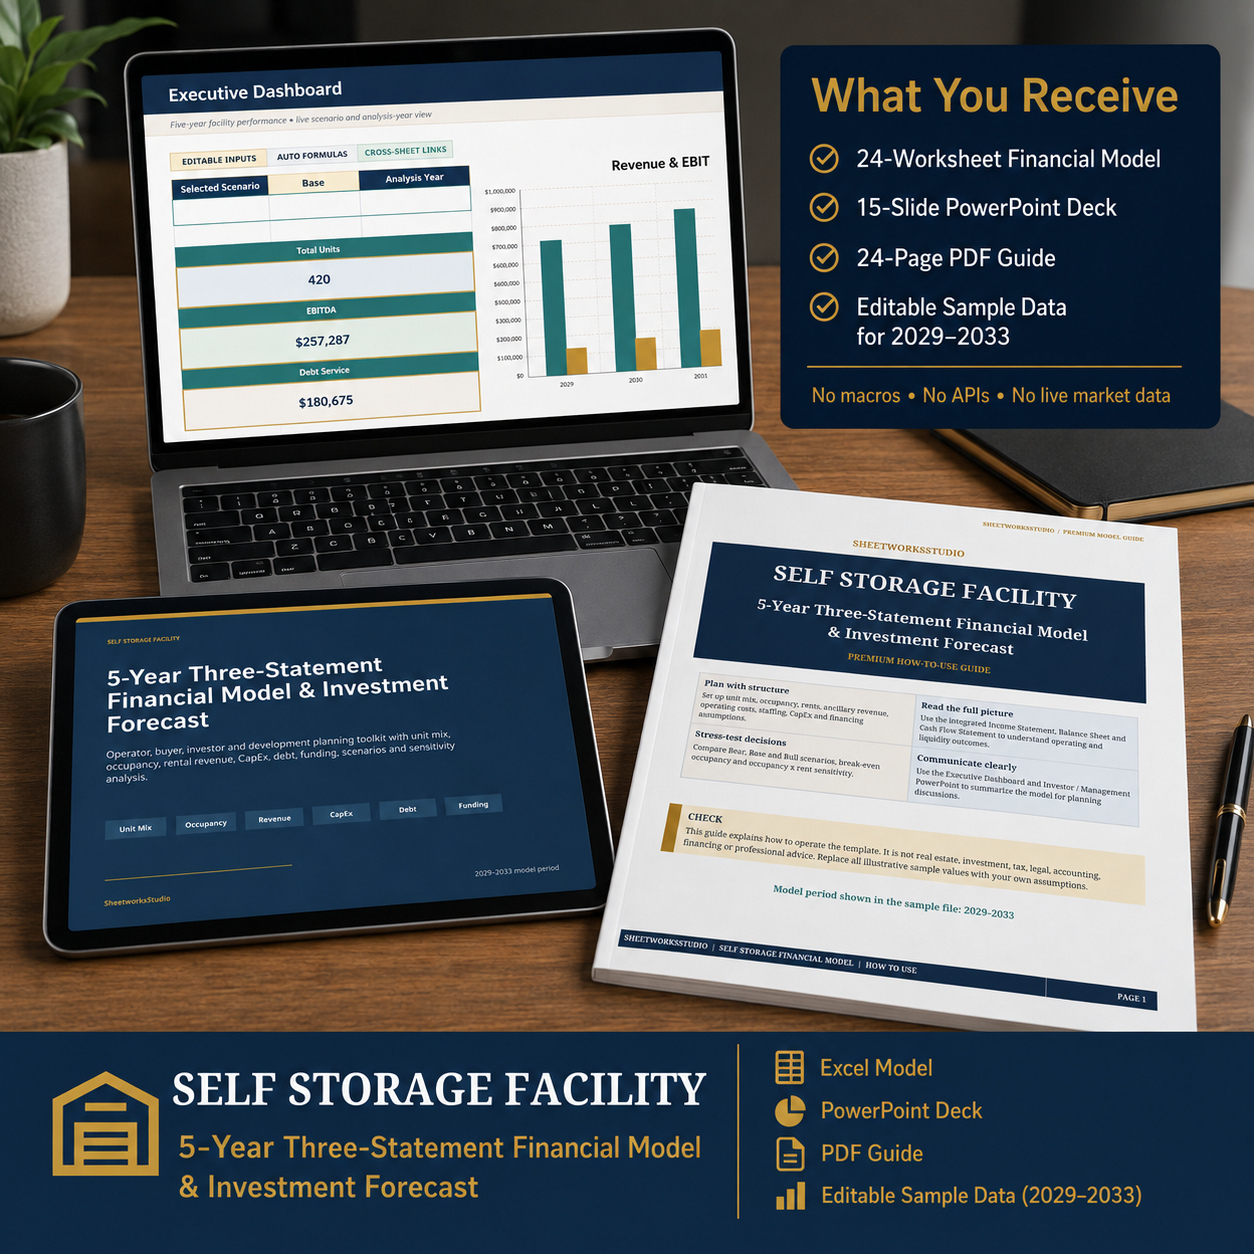
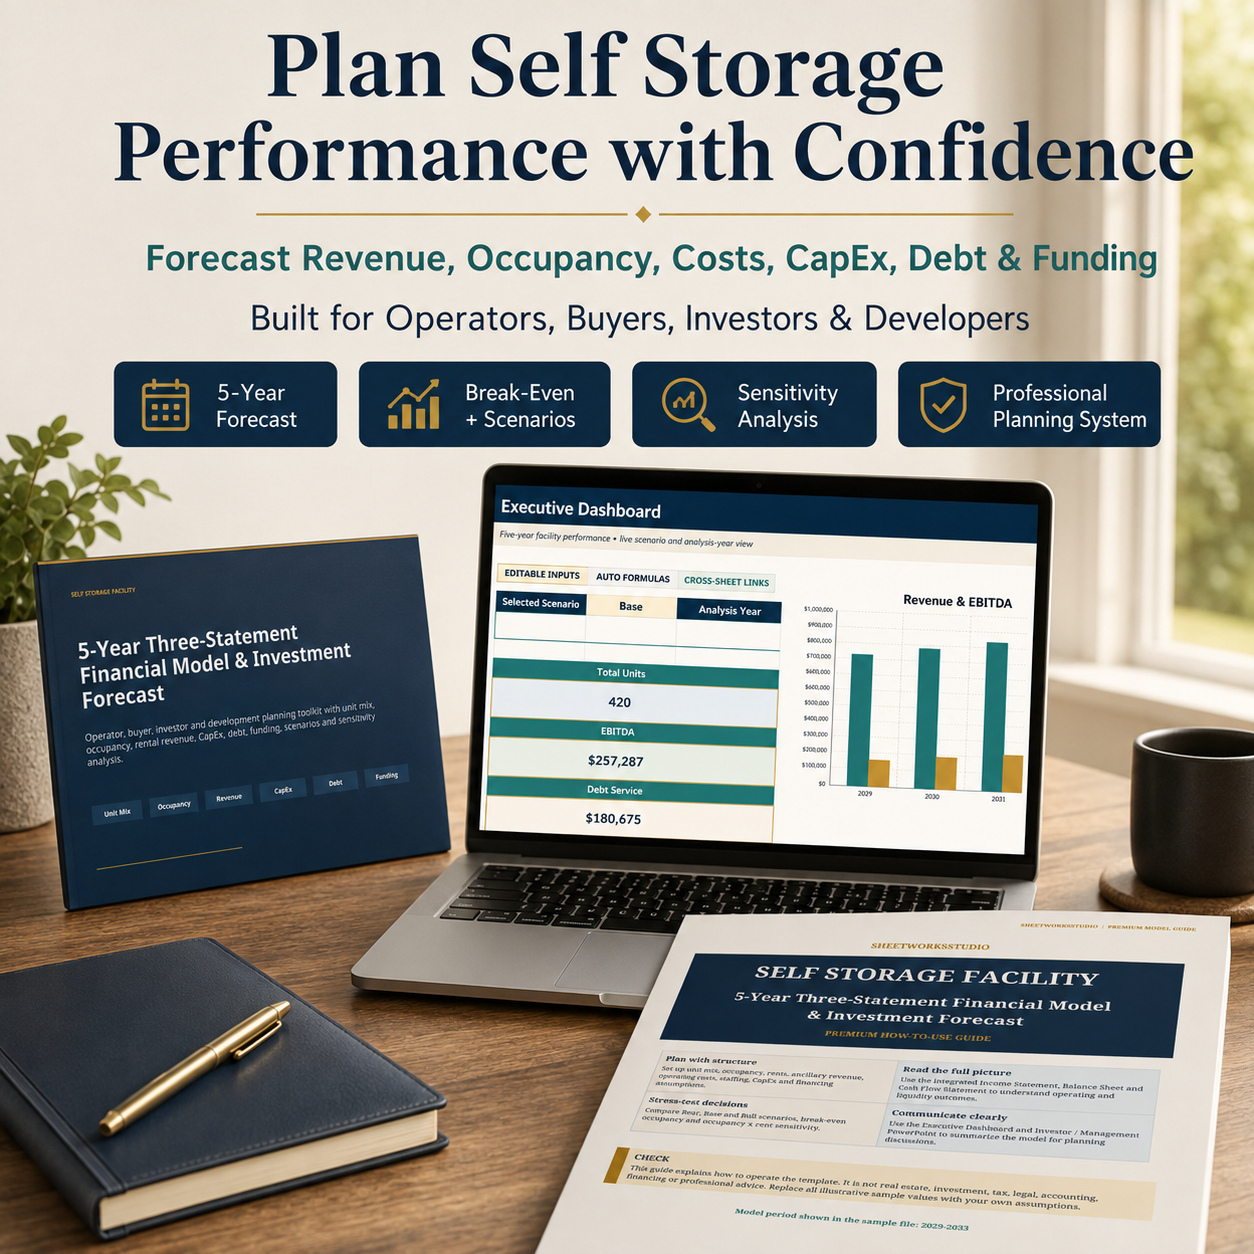
This professional package combines a 24-worksheet Excel Financial Model, a 15-slide Investor / Management PowerPoint Deck, and a detailed 24-page How-to-Use PDF Guide.


The model connects the main operating drivers of a self storage facility with a complete 2029โ€“2033 Three-Statement Forecast, allowing operators, buyers, investors, developers, consultants, and management teams to evaluate facility performance within one structured framework.


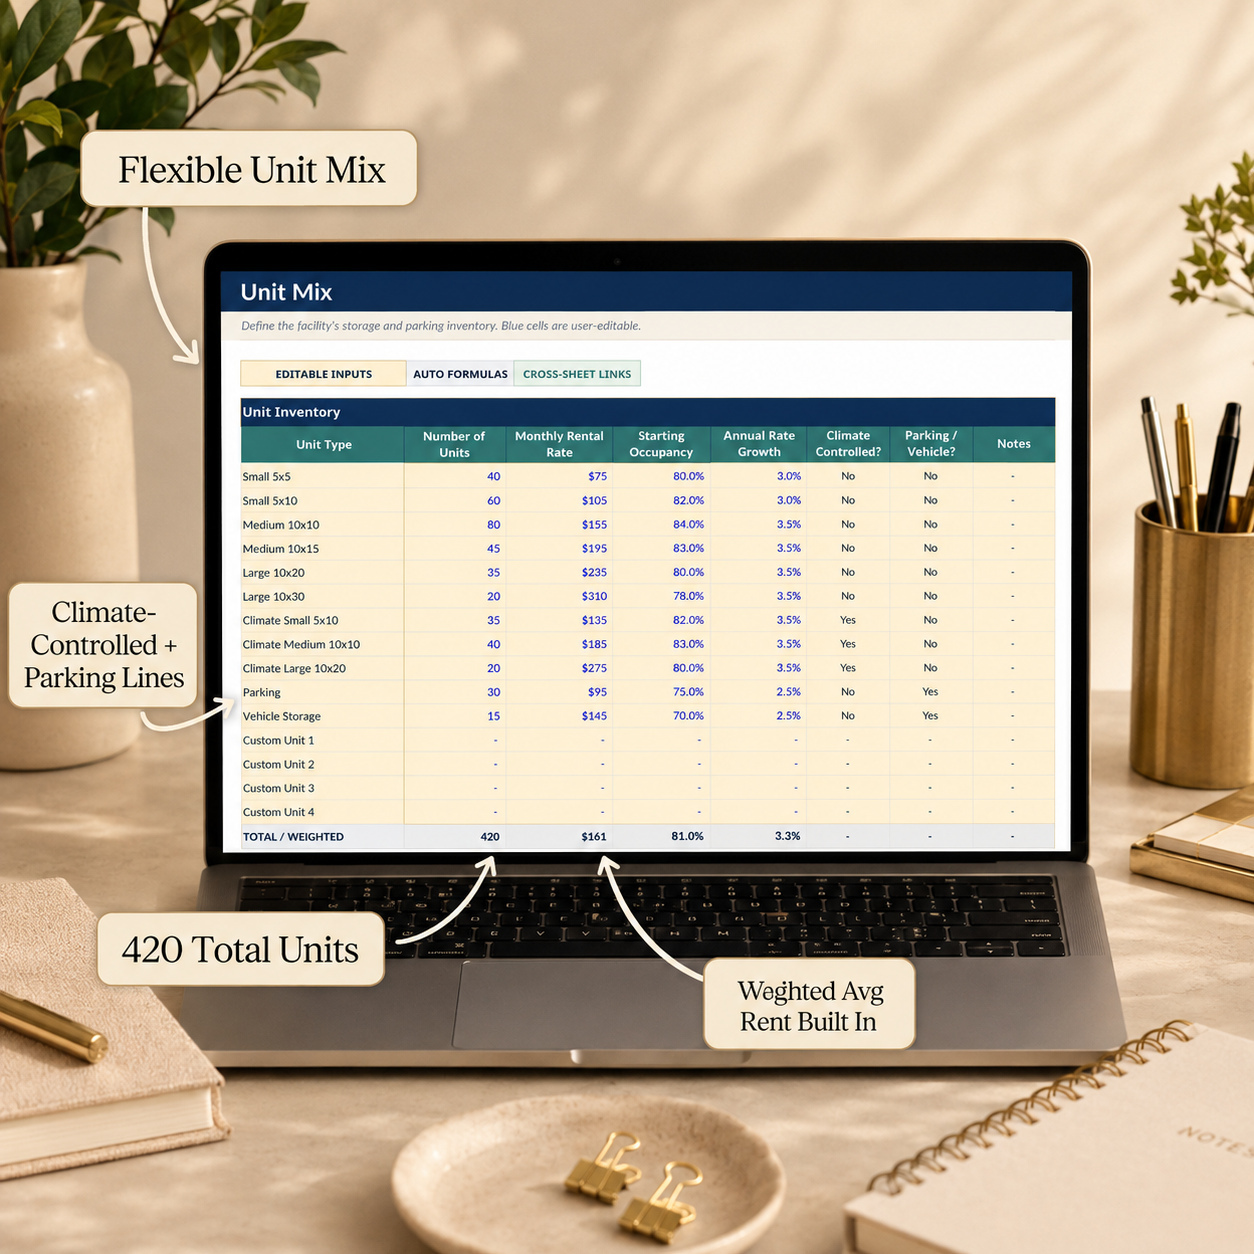
๐Ÿ  UNIT MIX & FACILITY CAPACITY

Build a flexible facility configuration covering:

โœ… Small Units โœ… Medium Units โœ… Large Units โœ… Climate-Controlled Units โœ… Parking โœ… Vehicle Storage โœ… User-defined custom unit types

For each unit type, users can configure unit count, monthly rental rate, starting occupancy, annual rate growth, climate-control status, and parking / vehicle classification.


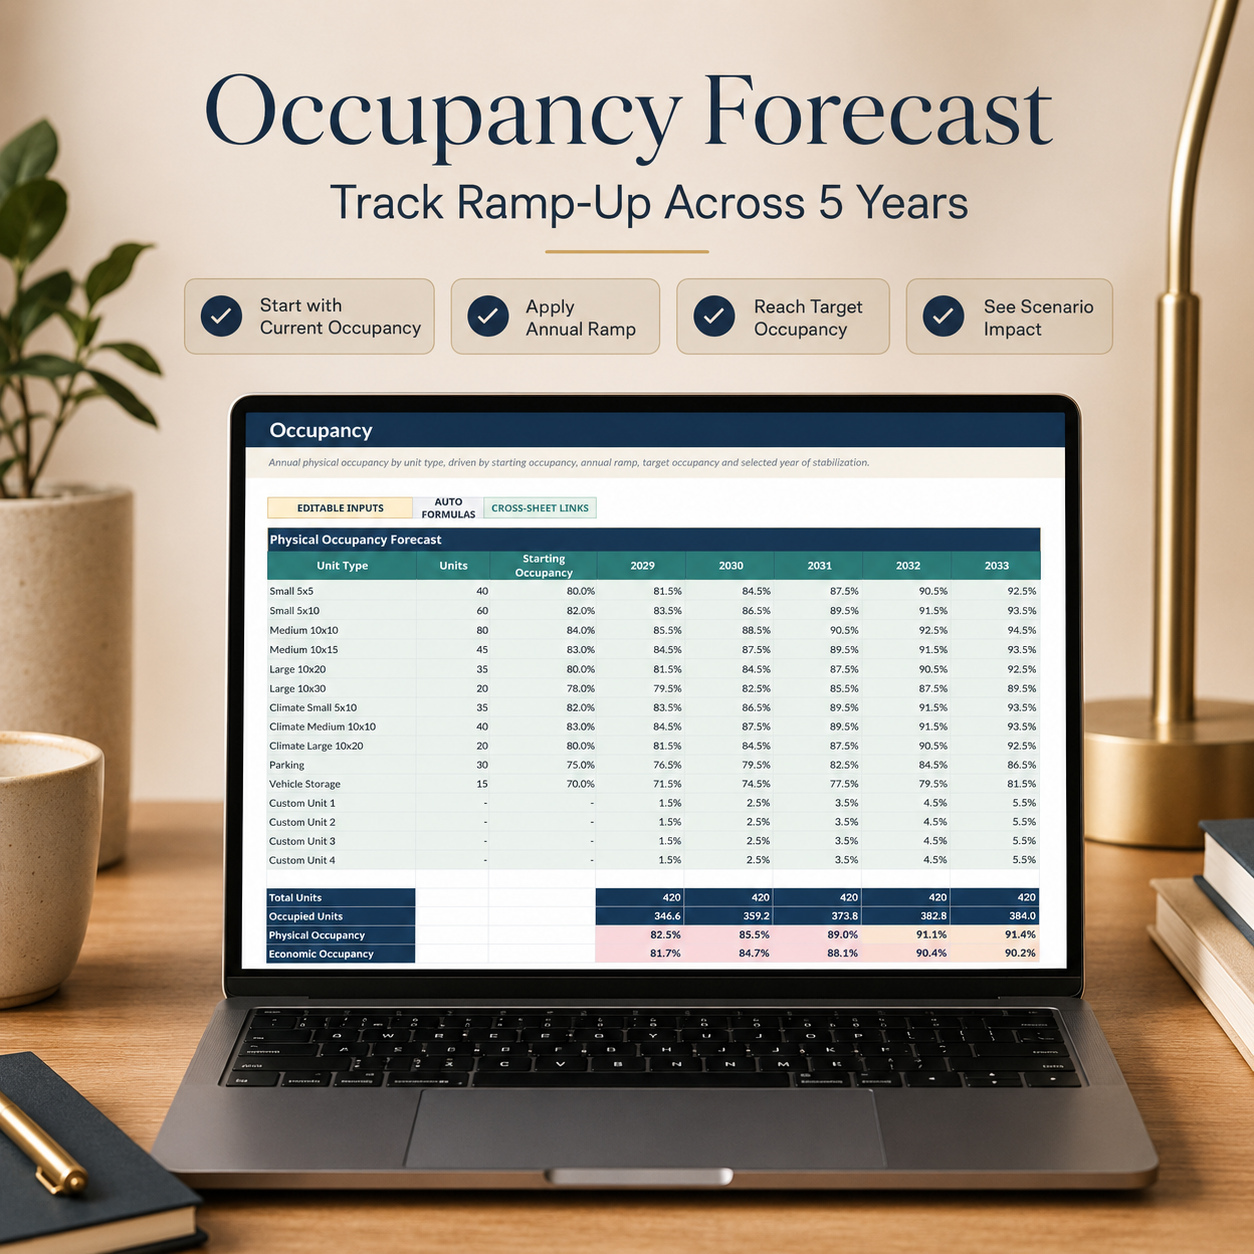
๐Ÿ“ˆ PHYSICAL & ECONOMIC OCCUPANCY

The occupancy model links unit inventory with:

โœ… Starting Occupancy โœ… Annual Occupancy Ramp โœ… Target Occupancy โœ… Scenario Adjustments โœ… Occupied Units โœ… Physical Occupancy

Economic Occupancy is calculated separately by comparing net rental revenue with potential gross rental revenue, providing an additional view of facility performance.


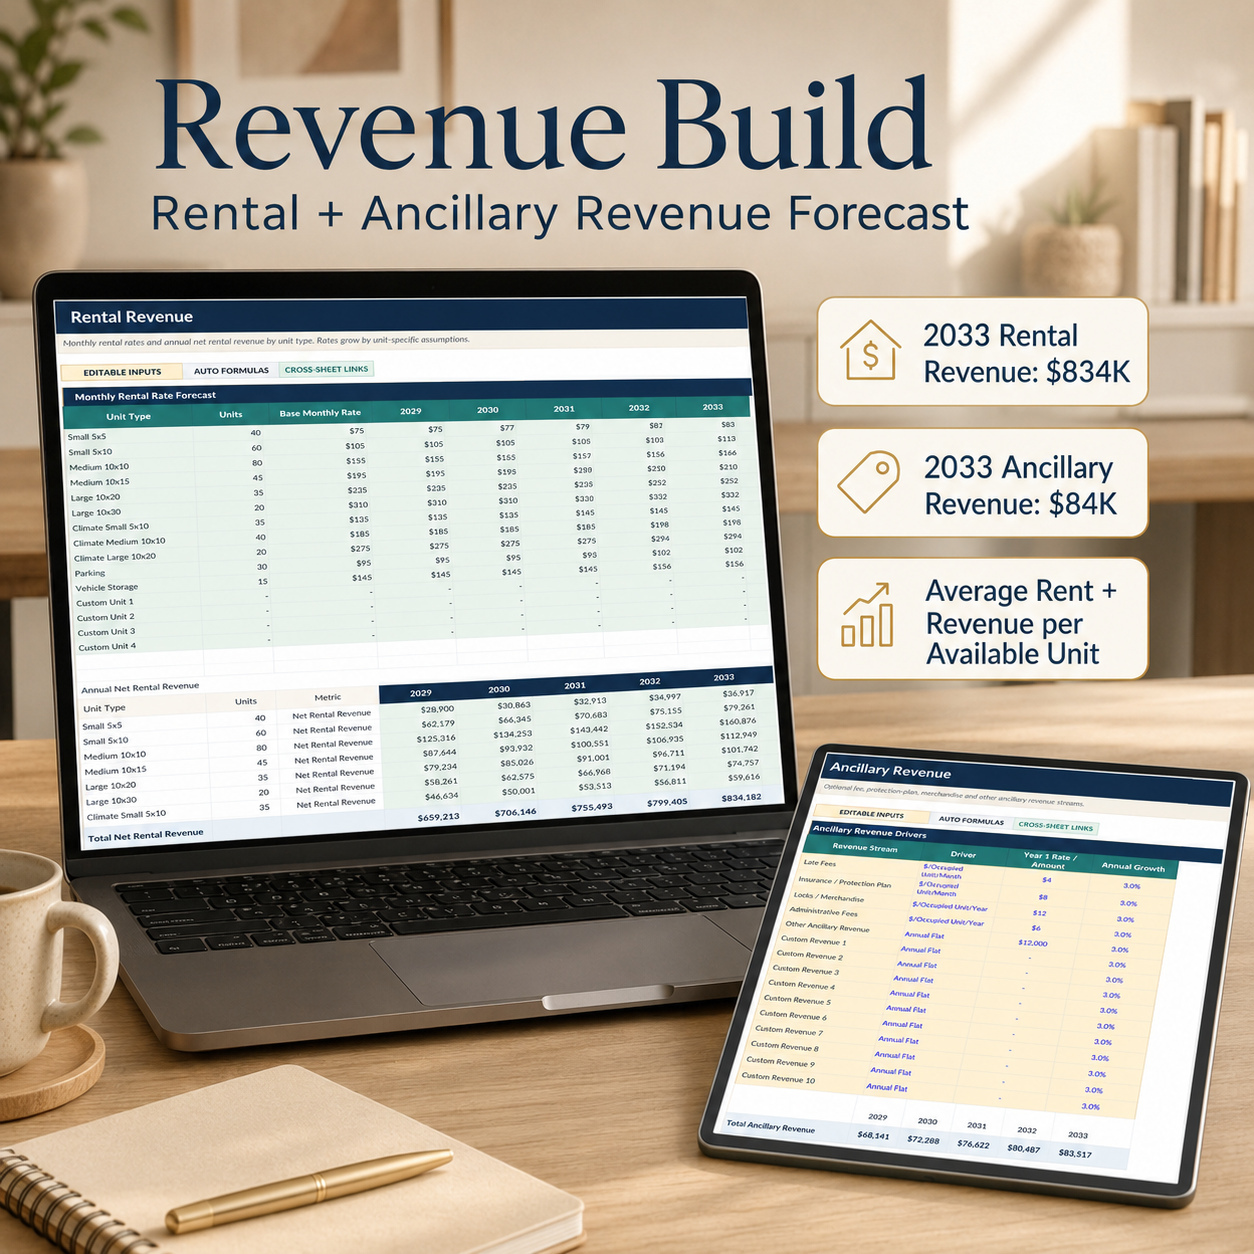
๐Ÿ’ฐ RENTAL & ANCILLARY REVENUE

Rental revenue is modeled by unit type using monthly rental rates, occupancy, rate growth, and concessions / bad-debt assumptions.

Optional ancillary revenue streams include:

โœ… Late Fees โœ… Insurance / Protection Plans โœ… Locks / Merchandise โœ… Administrative Fees โœ… Other Ancillary Revenue โœ… Custom Revenue Lines

This provides a transparent separation between core rental revenue and additional facility income.


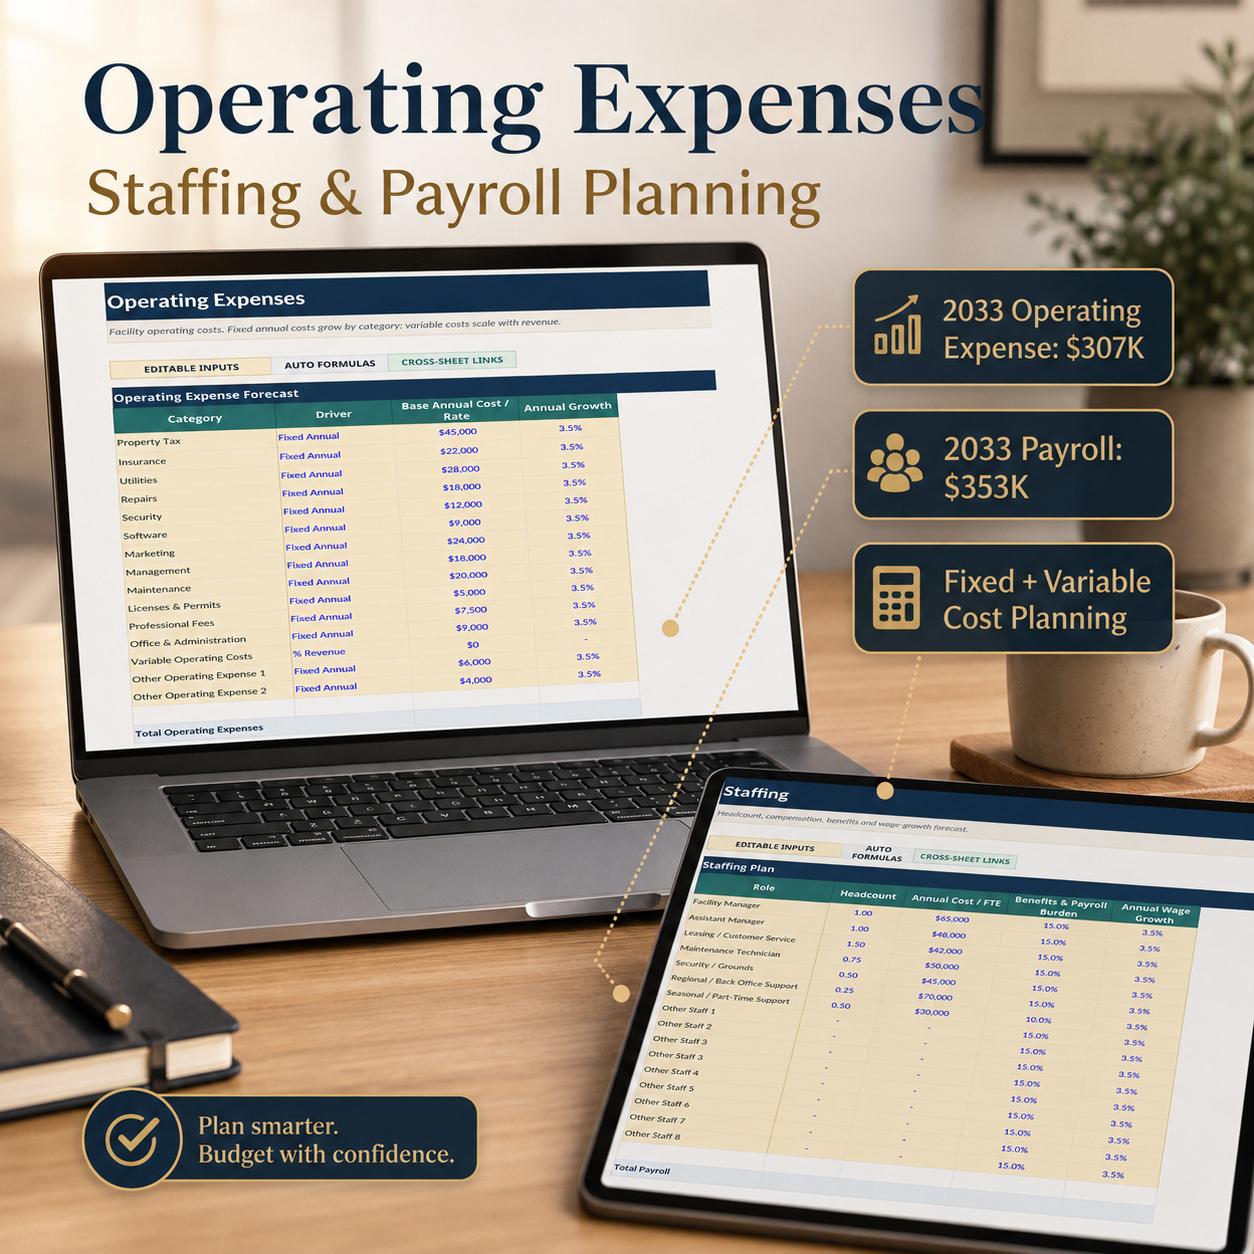
๐Ÿ’ผ OPERATING EXPENSES & STAFFING

Plan facility operating costs including:

โœ… Property Tax โœ… Insurance โœ… Utilities โœ… Repairs โœ… Security โœ… Software โœ… Marketing โœ… Management โœ… Maintenance โœ… Licenses & Permits โœ… Professional Fees โœ… Office & Administration โœ… Variable Operating Costs

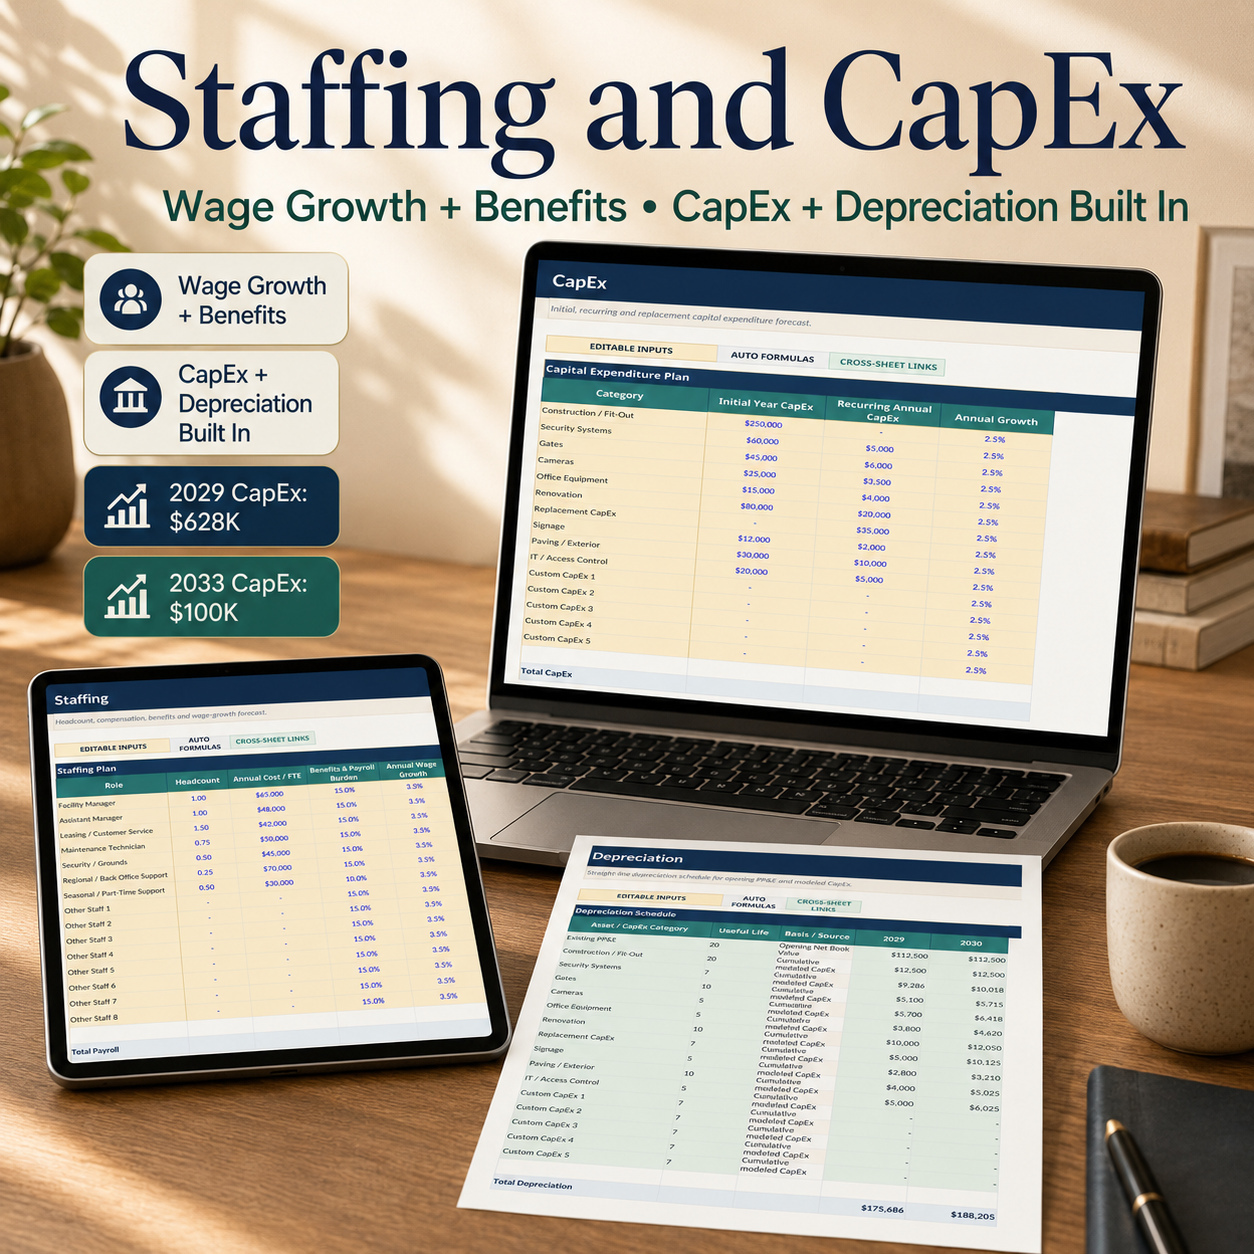
Staffing logic includes headcount, compensation, payroll burden, benefits, and wage growth across facility management, customer service, maintenance, security, support, and additional customizable roles.


๐Ÿ—๏ธ CAPEX, DEPRECIATION & DEBT

Build a structured capital plan covering areas such as:

โœ… Construction / Fit-Out โœ… Security Systems โœ… Gates โœ… Cameras โœ… Office Equipment โœ… Renovation โœ… Replacement CapEx โœ… Signage โœ… Paving / Exterior โœ… IT / Access Control

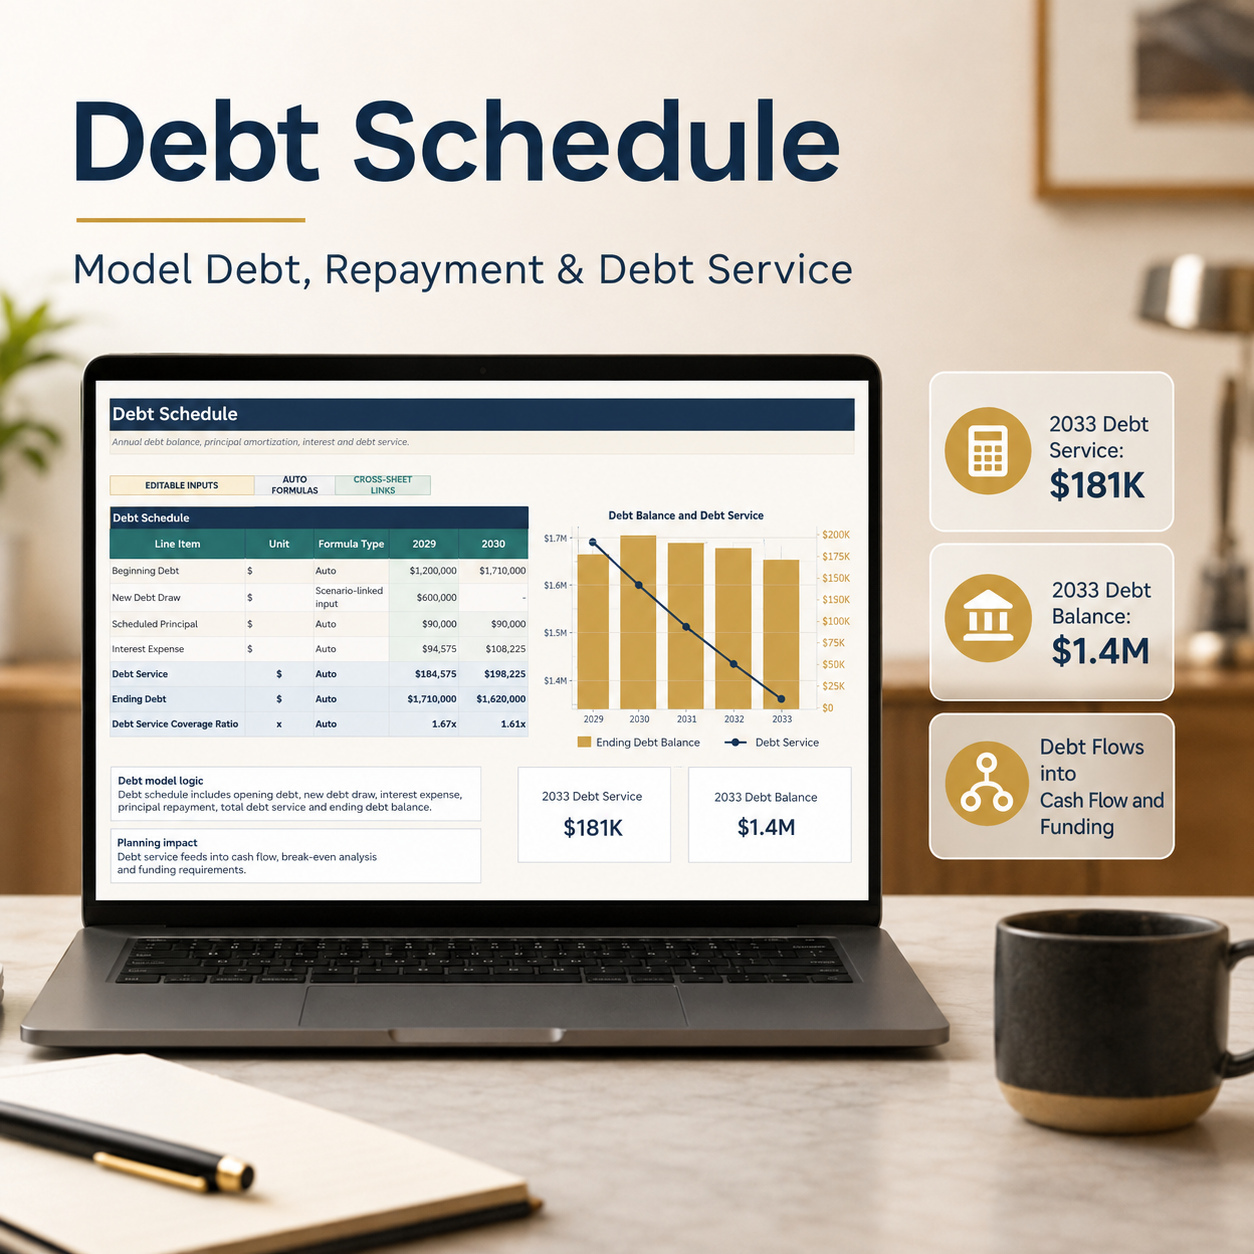
CapEx feeds into depreciation, while the Debt Schedule calculates new borrowing, principal repayments, interest expense, total debt service, ending debt, and Debt Service Coverage Ratio.


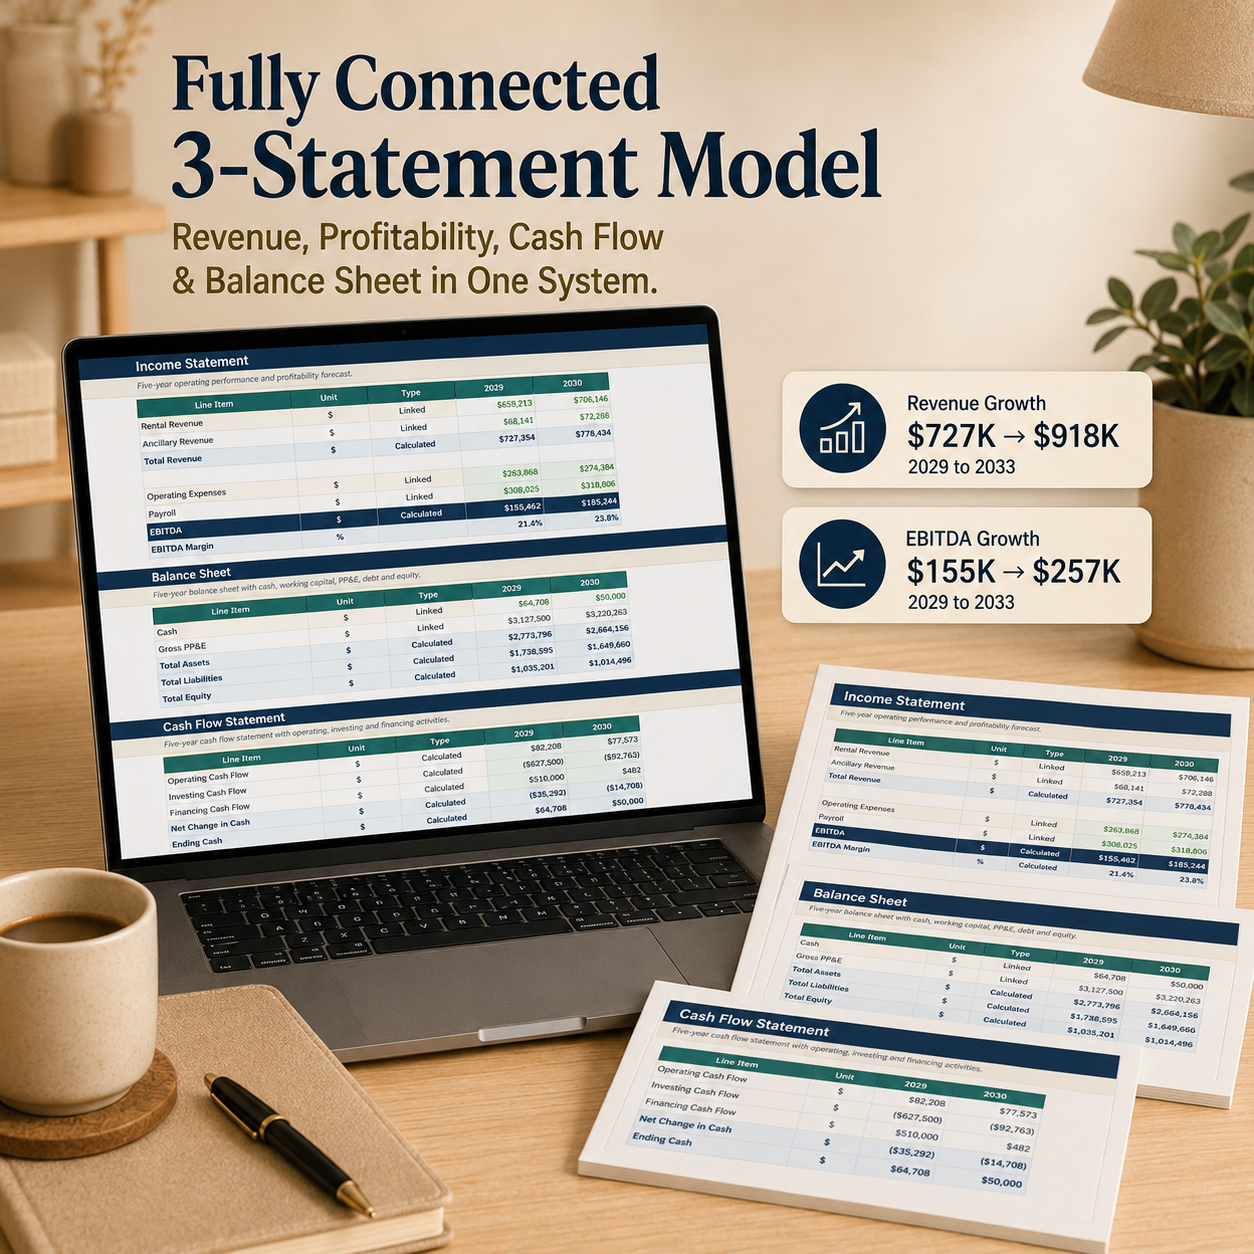
๐Ÿงพ FULL THREE-STATEMENT FINANCIAL MODEL

The workbook integrates:

โœ… Income Statement โœ… Balance Sheet โœ… Cash Flow Statement

Operating performance, CapEx, depreciation, financing, working capital, and funding requirements are connected throughout the model.


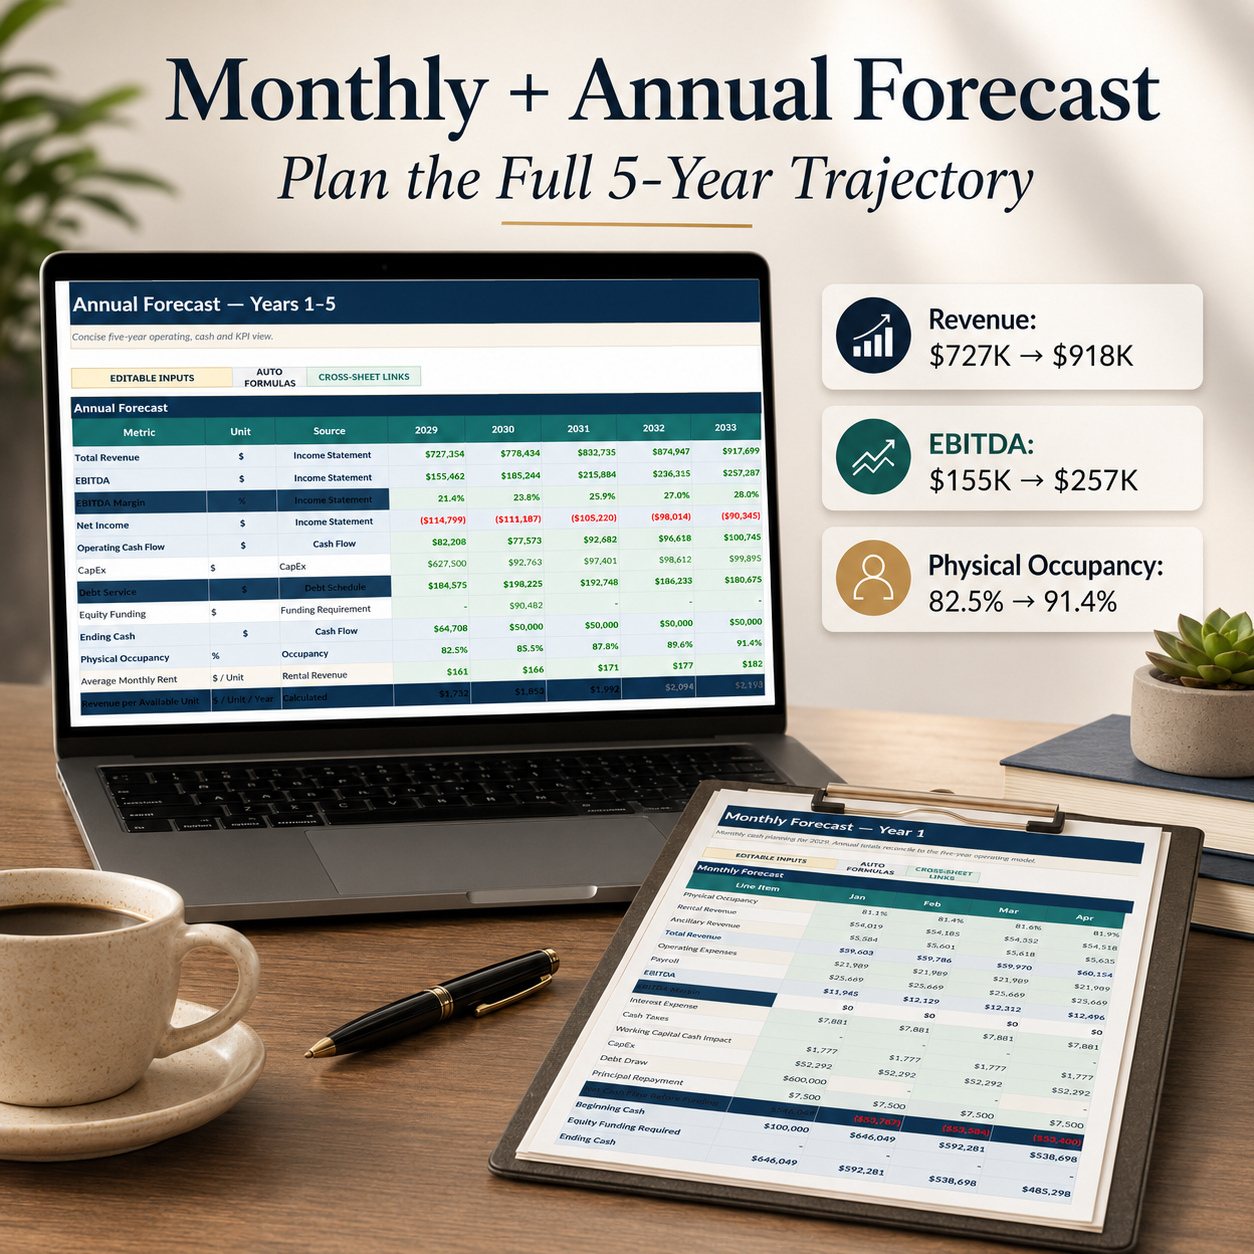
๐Ÿ“… MONTHLY + FIVE-YEAR FORECAST

The system includes:

โœ… Detailed Monthly Forecast โ€” Year 1 โœ… Annual Forecast โ€” Years 1โ€“5 โœ… Illustrative forecast period 2029โ€“2033

The five-year view consolidates Revenue, EBITDA, EBITDA Margin, Net Income, Operating Cash Flow, CapEx, Debt Service, Funding Required, Ending Cash, Physical Occupancy, Average Monthly Rent, and Revenue per Available Unit.


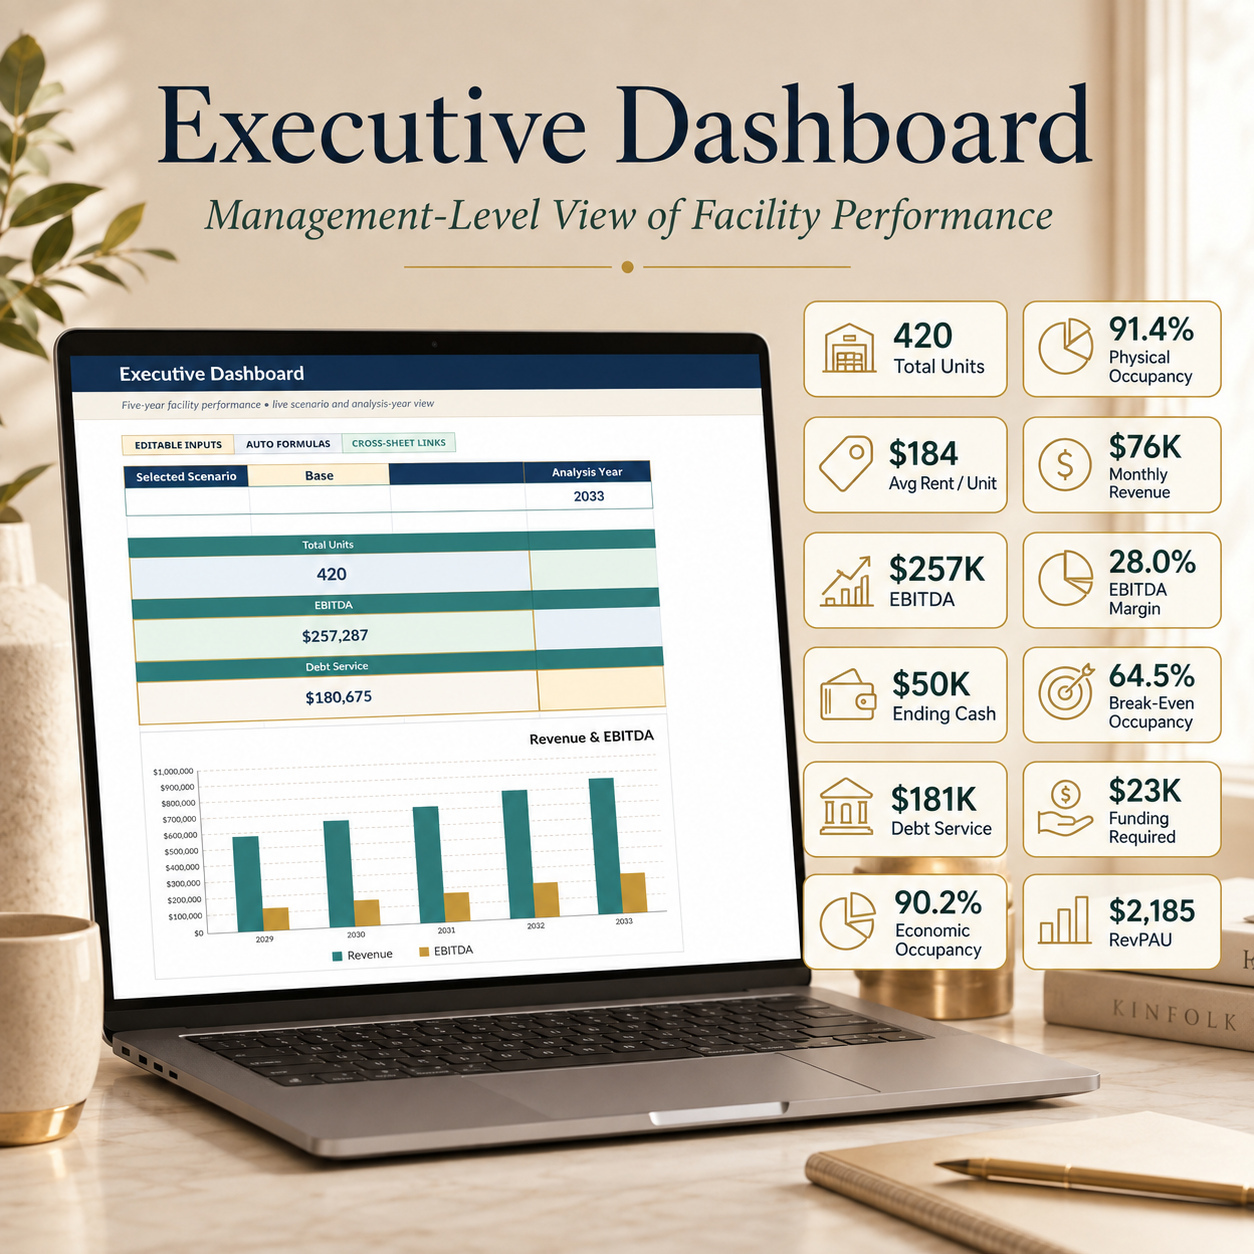
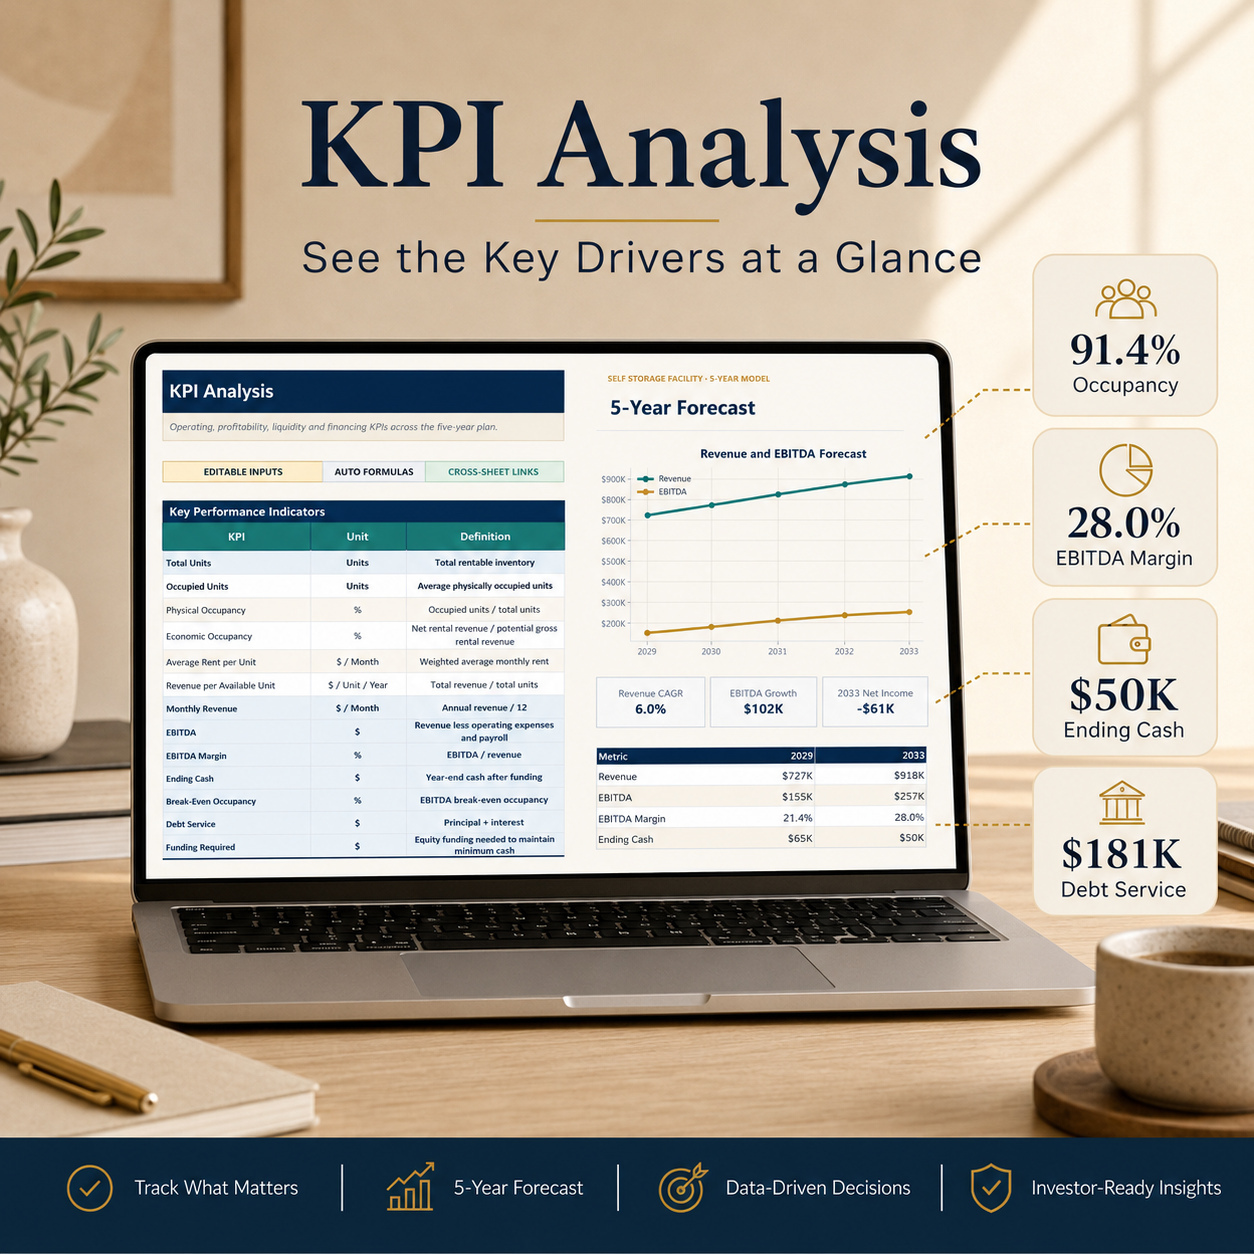
๐Ÿ“Š EXECUTIVE DASHBOARD

The management dashboard provides an immediate overview of:

โœจ Total Units โœจ Physical Occupancy โœจ Economic Occupancy โœจ Average Rent per Unit โœจ Monthly Revenue โœจ Revenue per Available Unit โœจ EBITDA โœจ EBITDA Margin โœจ Ending Cash โœจ Break-Even Occupancy โœจ Debt Service โœจ Funding Required

Four integrated charts visualize:

๐Ÿ“ˆ Revenue & EBITDA ๐Ÿ  Physical Occupancy ๐Ÿ’ต Ending Cash & Funding ๐Ÿ’ฐ Rental vs Ancillary Revenue


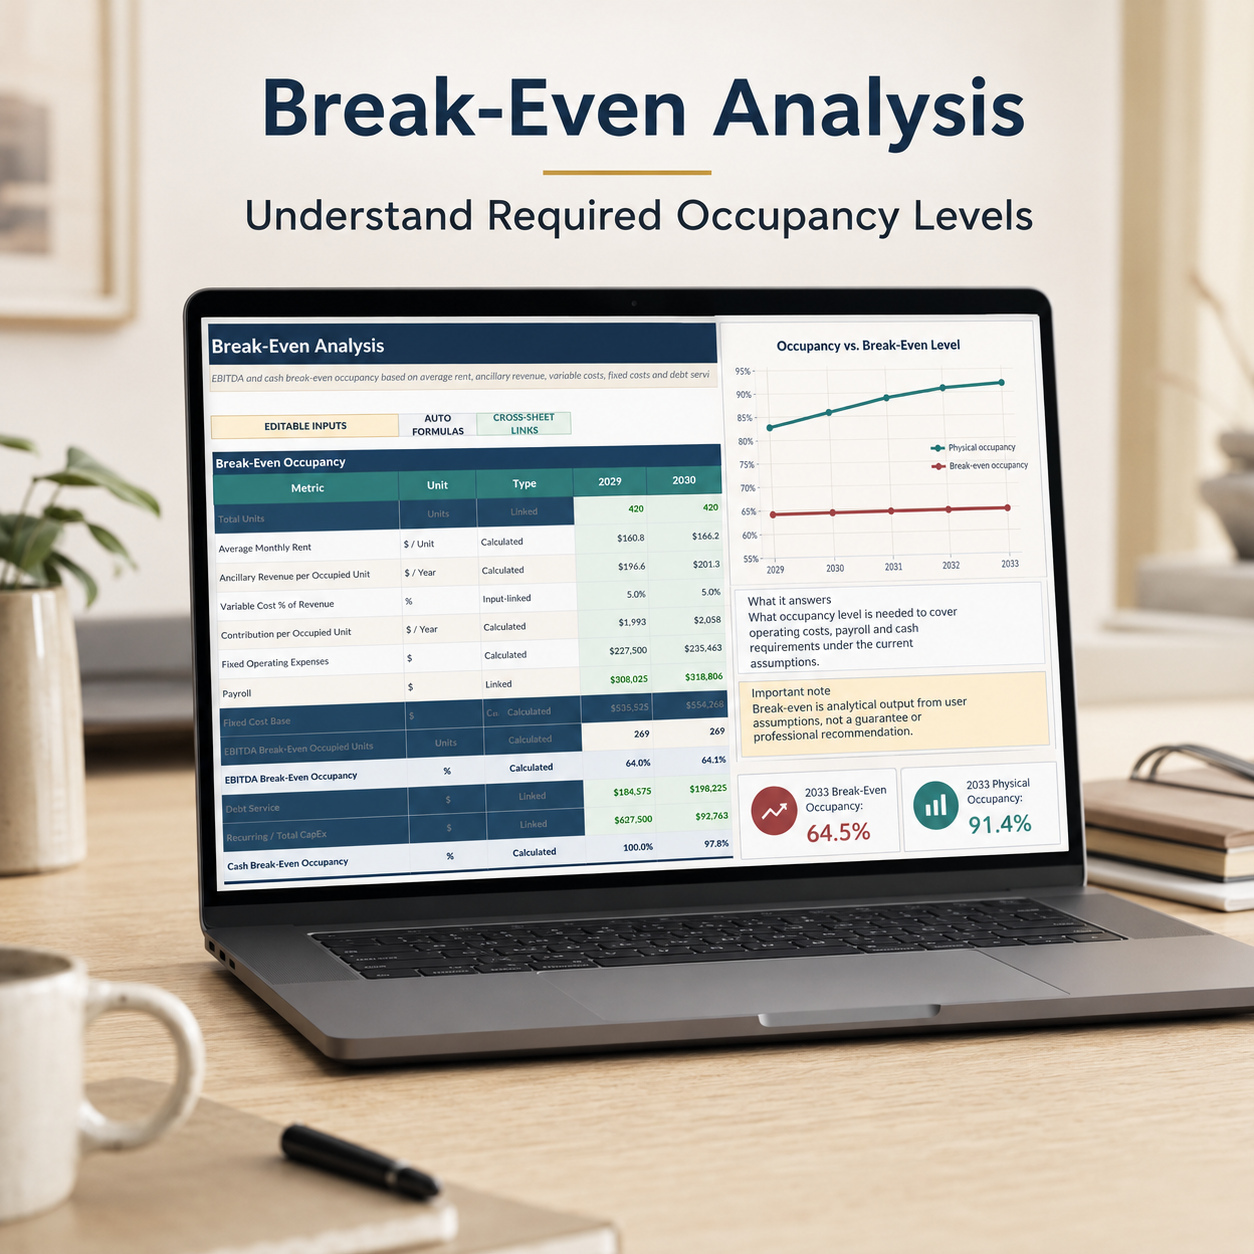
๐ŸŽฏ BREAK-EVEN ANALYSIS

Evaluate both operating and liquidity requirements through:

โœ… EBITDA Break-Even Occupied Units โœ… EBITDA Break-Even Occupancy โœ… Cash Break-Even Occupancy โœ… Fixed Cost Base โœ… Contribution per Occupied Unit โœ… Debt Service โœ… CapEx

This helps users understand the occupancy level required under their own rent, cost, payroll, debt, and capital assumptions.


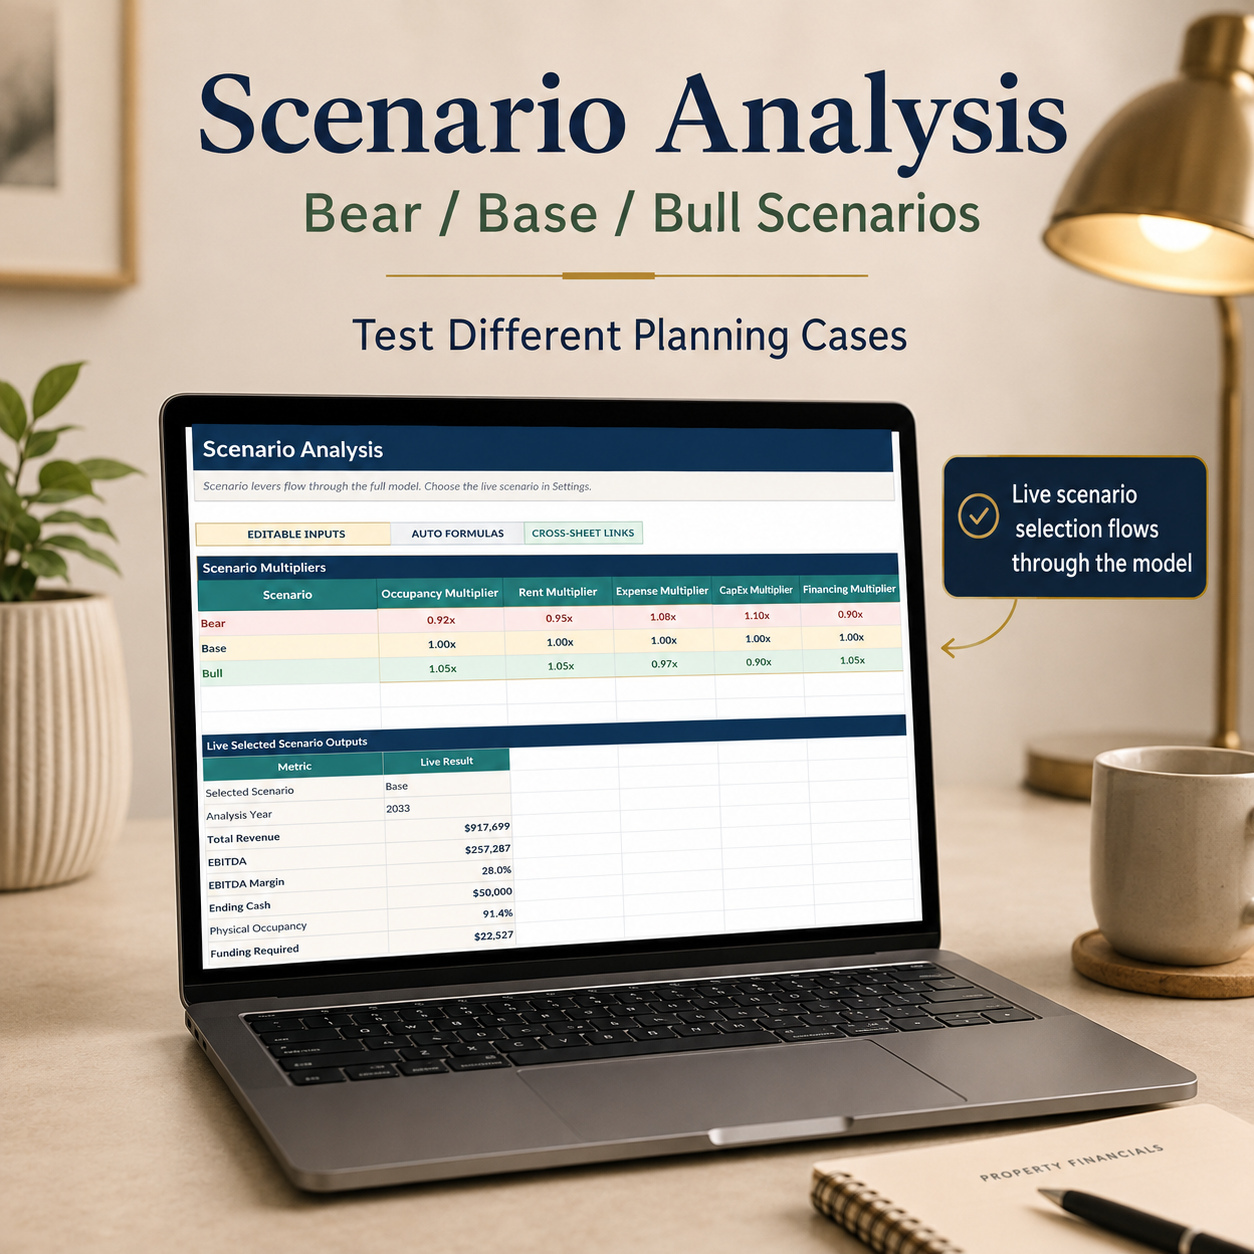
๐Ÿ”„ BEAR โ€ข BASE โ€ข BULL SCENARIOS

Compare three transparent planning cases:

๐Ÿ”ด Bear ๐Ÿ”ต Base ๐ŸŸข Bull

Scenario multipliers can flex:

โœ… Occupancy โœ… Rental Rates โœ… Operating Expenses โœ… CapEx โœ… Financing

The selected scenario flows through the connected model and updates Revenue, EBITDA, Ending Cash, Occupancy, and Funding Required.


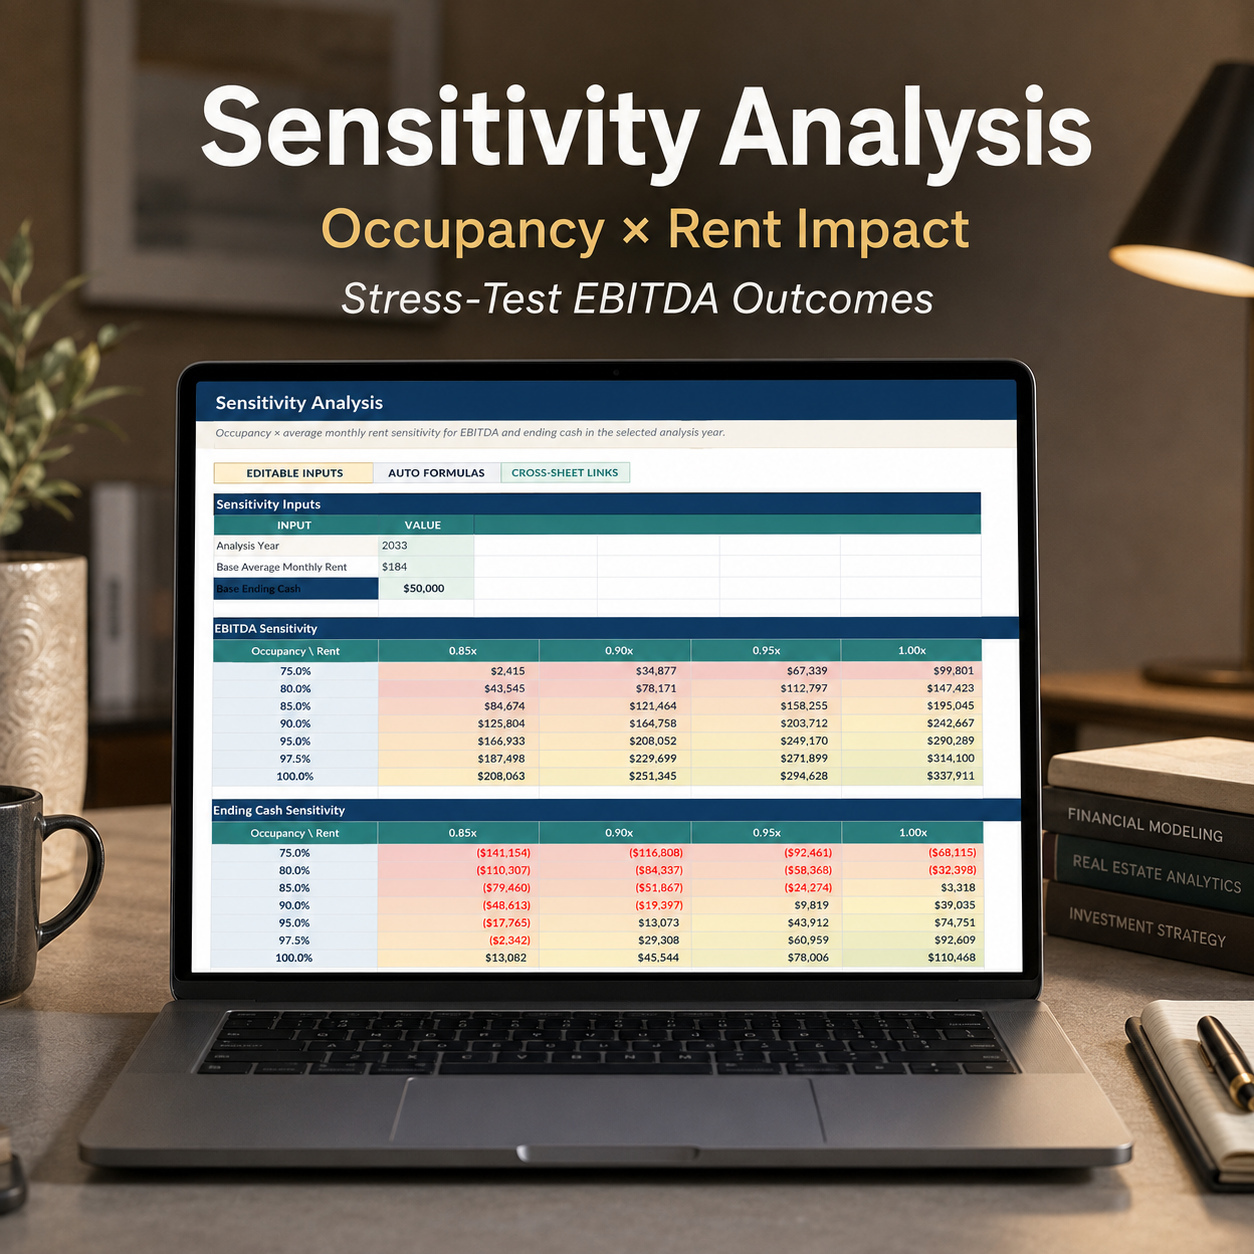
๐Ÿ”ฅ OCCUPANCY ร— RENT SENSITIVITY

The integrated sensitivity analysis evaluates how different combinations of:

Occupancy ร— Average Monthly Rent

may affect:

โœ… EBITDA โœ… Ending Cash

This provides a focused view of two of the most important economic drivers of a self storage facility while holding other assumptions constant.


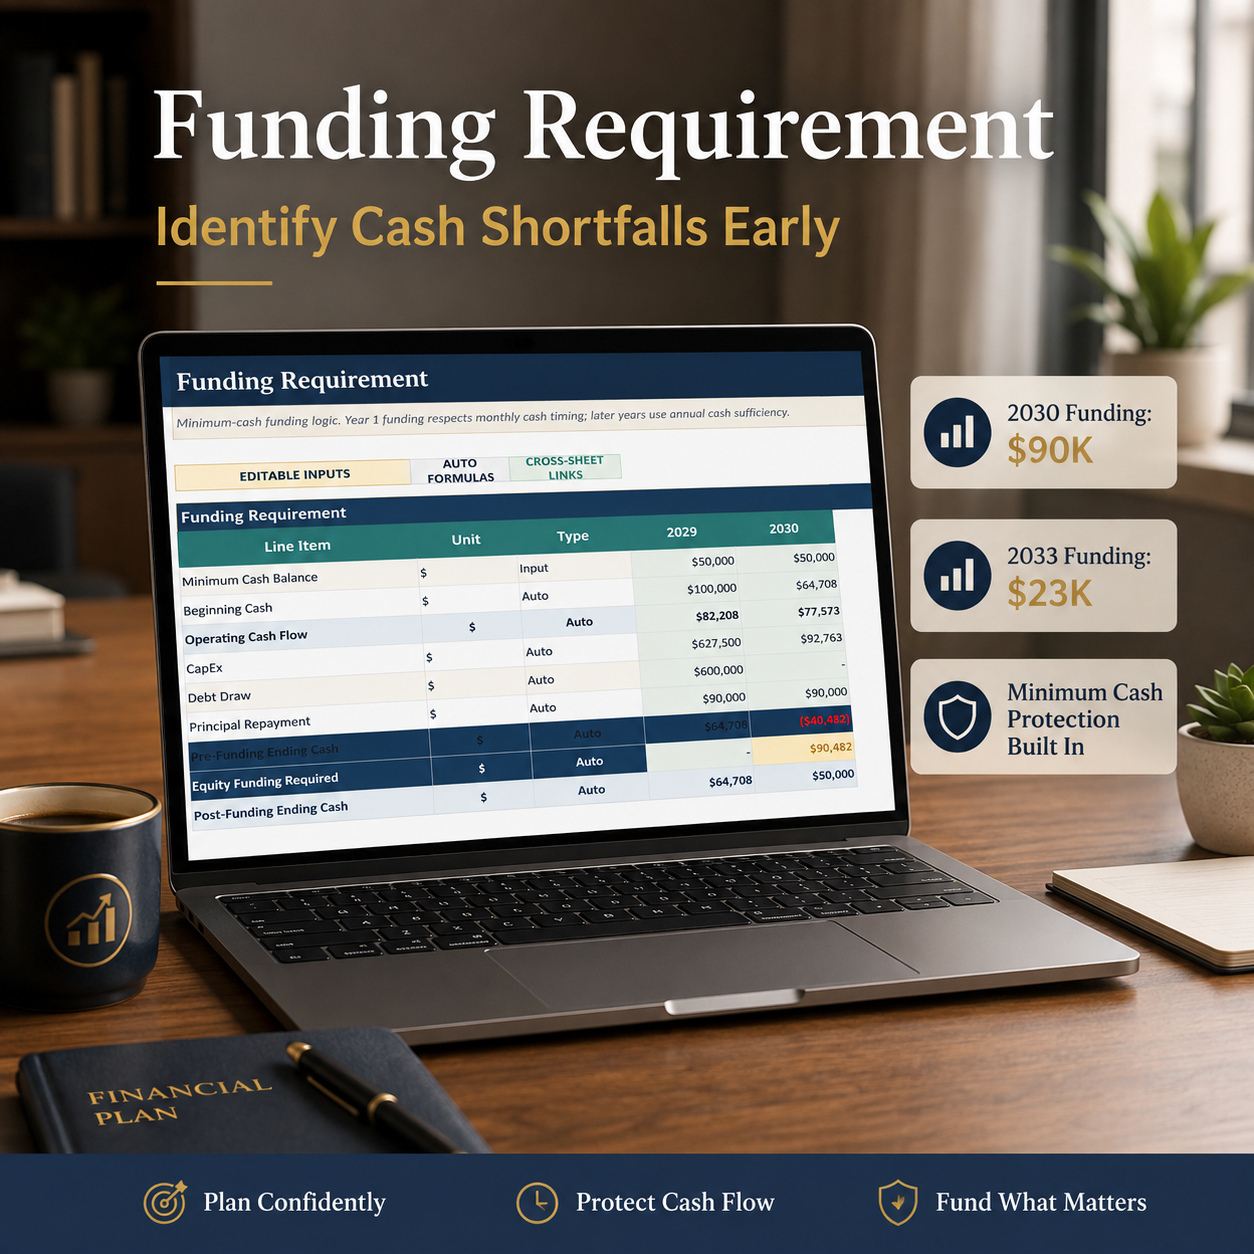
๐Ÿฆ FUNDING REQUIREMENT

The model evaluates:

โœ… Minimum Cash Balance โœ… Beginning Cash โœ… Operating Cash Flow โœ… CapEx โœ… Debt Draws โœ… Principal Repayment โœ… Pre-Funding Ending Cash โœ… Equity Funding Required โœ… Post-Funding Ending Cash

Year 1 funding logic also considers monthly cash timing before flowing into the annual forecast.


๐ŸŽค 15-SLIDE INVESTOR / MANAGEMENT POWERPOINT

The included professional presentation summarizes the model through sections covering:

๐Ÿข Executive Snapshot & Facility Overview ๐Ÿ  Unit Mix ๐Ÿ“ˆ Occupancy ๐Ÿ’ฐ Revenue Build ๐Ÿ’ผ Operating Expenses ๐Ÿ‘ฅ Staffing & CapEx ๐Ÿ“Š 5-Year Forecast ๐Ÿ’ต Cash & Funding Requirement ๐Ÿฆ Debt Schedule ๐ŸŽฏ Break-Even Analysis ๐Ÿ”„ Scenario Analysis ๐Ÿ”ฅ Sensitivity Analysis โš ๏ธ Risks & Use Notes

It is designed for structured management reviews, facility planning, consulting work, financing preparation, and investor discussions.


๐Ÿ“˜ 24-PAGE HOW-TO-USE GUIDE

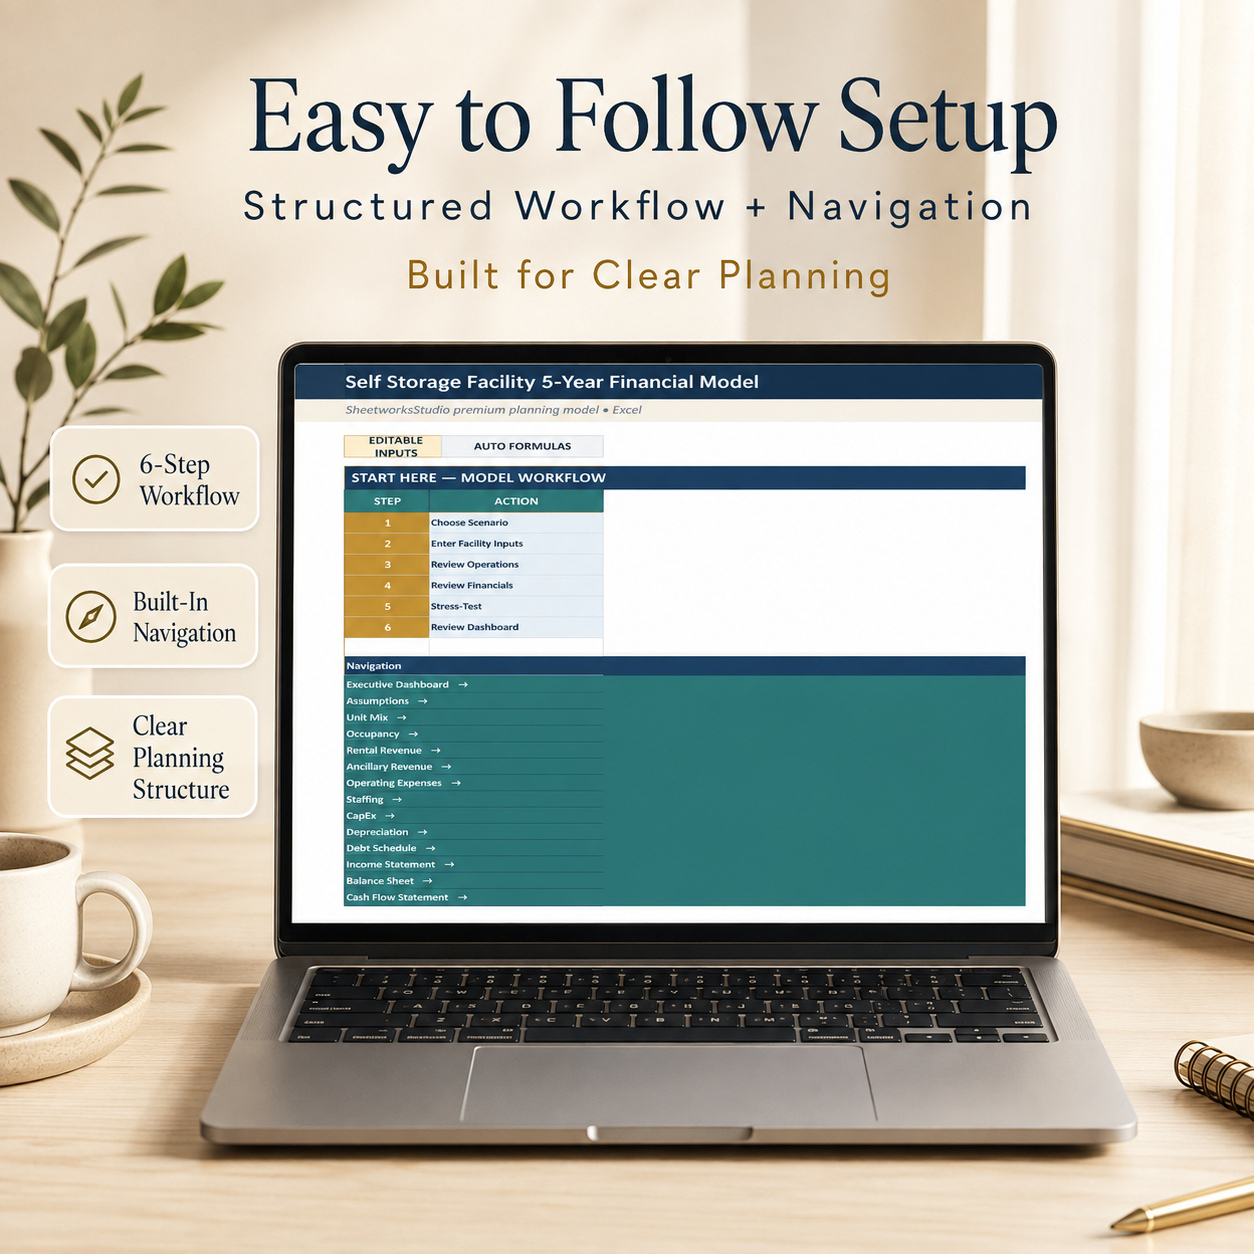
The detailed guide explains the complete workflow, including:

โœ… Quick Start โœ… Navigation & Color Legend โœ… Settings & Scenario Selection โœ… Assumptions โœ… Unit Mix โœ… Occupancy โœ… Rental Revenue โœ… Ancillary Revenue โœ… Operating Expenses โœ… Staffing โœ… CapEx & Depreciation โœ… Debt Schedule โœ… Three Statements โœ… Monthly Forecast Year 1 โœ… Annual Forecast & KPI Analysis โœ… Break-Even Analysis โœ… Scenario Analysis โœ… Sensitivity Analysis โœ… Funding Requirement โœ… Executive Dashboard โœ… Google Sheets Workflow & Troubleshooting


๐Ÿ’ป TECHNICAL COMPATIBILITY

โœ… Microsoft Excel (.xlsx) โœ… Microsoft PowerPoint (.pptx) โœ… PDF Guide โœ… Google Sheets import possible โœ… No macros or VBA โœ… No APIs โœ… No live market data โœ… No external Excel data connections


๐Ÿ“Œ Microsoft Excel remains the reference environment. When imported into Google Sheets, formatting or chart appearance may vary, although the core workbook structure and calculation logic remain usable.


โš–๏ธ IMPORTANT DISCLAIMER

This product is an editable financial planning and modeling template intended for informational, organizational, and decision-support purposes only. It does not constitute real estate, investment, valuation, financing, tax, legal, accounting, or other professional advice. No market values, investment returns, cap rates, funding approvals, or future operating results are guaranteed or represented.


All included sample data and assumptions are illustrative and should be replaced with facility-specific information before real-world use.


๐Ÿ“Š This complete planning system brings facility operations, occupancy, rental economics, financial forecasting, break-even analysis, debt, liquidity, and funding requirements into one connected framework. It is designed to help operators, investors, developers, consultants, and finance professionals evaluate assumptions more clearly, compare alternative scenarios, and prepare more structured management and financing discussions.

This Best Practice includes
1 Self Storage Facility Financial Model (.xlsx), 1 Investor / Management Deck (.pptx), 1 How-to-Use Guide (.pdf)

Acquire business license for $79.90

Add to cart

Add to bookmarks

Discuss

Further information

The objective of this model is to provide self storage operators, buyers, investors, developers, consultants, and management teams with a structured framework for connecting facility-level operating assumptions with financial performance, cash flow, debt service, and funding requirements.

Users can model unit inventory, physical and economic occupancy, rental rates, ancillary income, operating expenses, staffing, CapEx, depreciation, debt, working capital, and financing assumptions within one connected system.

The model is designed to help users evaluate how occupancy and rental rates influence revenue and EBITDA, understand operating and cash break-even requirements, compare alternative facility scenarios, and identify potential liquidity or funding requirements.

The integrated financial statements, KPI Analysis, Dashboard, scenarios, sensitivity tools, and PowerPoint presentation also provide a consistent framework for management reviews and structured financing or investor discussions.

This model is particularly suitable for:

Self storage facility operators
Existing self storage businesses
Buyers evaluating operating assumptions
Self storage investors
Developers
Facility owners
Finance managers
Business planners
Management consultants
Real estate consultants
Fractional CFOs
Management teams

It is especially useful when developing or reviewing a five-year facility plan, testing occupancy and rental-rate assumptions, planning operating costs and staffing, reviewing CapEx and debt requirements, evaluating break-even occupancy, comparing scenarios, or estimating future liquidity and funding requirements.

This model does not replace professional property valuation, acquisition underwriting, appraisal software, accounting systems, property-management systems, specialist FP&A platforms, or formal investment due diligence.

It does not calculate or guarantee market value, investment returns, IRR, cap rates, regional rental benchmarks, future occupancy, financing approval, or market demand.

It does not include automatic market data, APIs, live accounting feeds, bank connections, or external data integrations.

The template does not constitute real estate, investment, valuation, accounting, tax, legal, financing, or business advice. Facility-specific market conditions and important financial decisions should be independently reviewed with appropriately qualified professionals where necessary.


0.0 / 5 (0 votes)

please wait...