Utility-Scale Solar PV Model | P50 Bias & Debt Sizing
Originally published: 19/08/2026 16:33
Publication number: ELQ-28548-1
View all versions & Certificate
certified

Utility-Scale Solar PV Model | P50 Bias & Debt Sizing

Size solar project debt like a lender, then test it against what plants really produce: US fleets run 8.6% below their own P50. Excel + Google Sheets.

Description
Contracted solar debt is sized on the P50, not the P90 - and the P50 itself is optimistic. Lenders size contracted solar against a single constraint: a DSCR floor of 1.25-1.30x on the P50. The P99 test sits at 1.00x and rarely binds. Most models get that convention wrong. But the convention is not where the risk is.
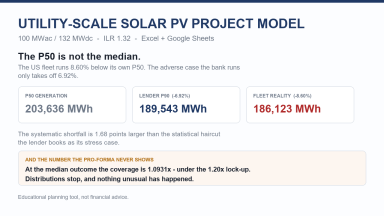
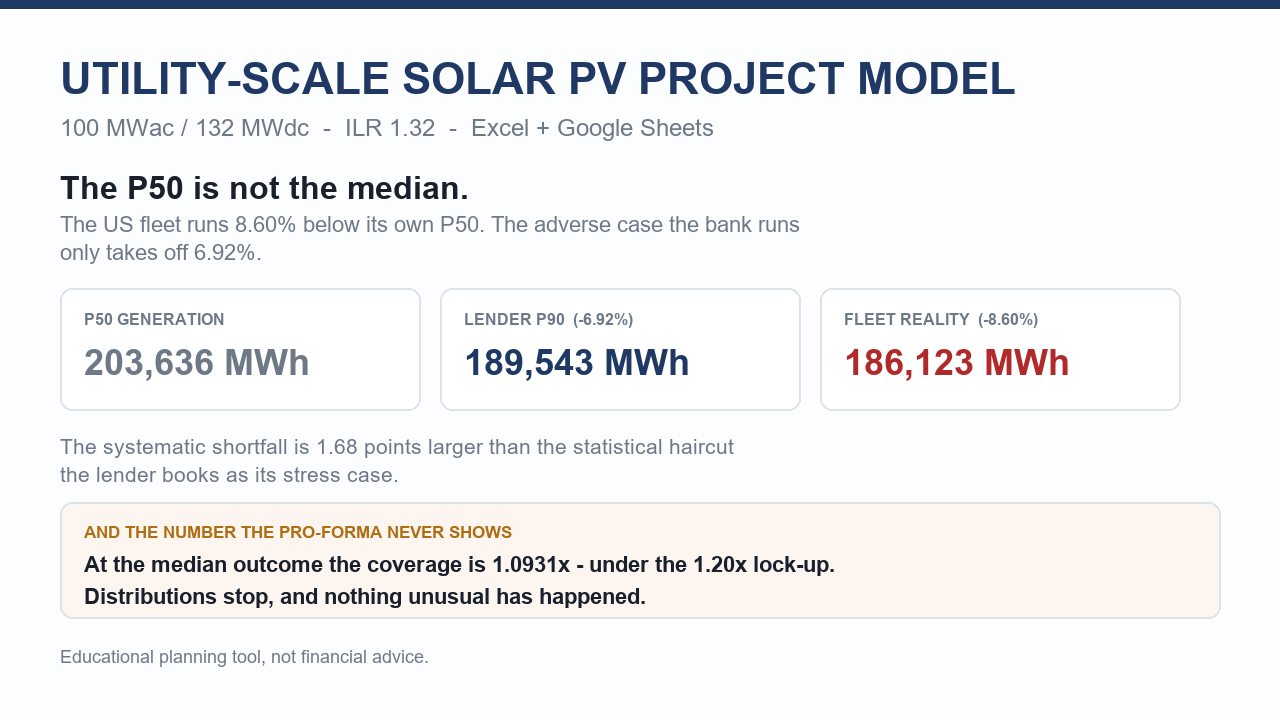
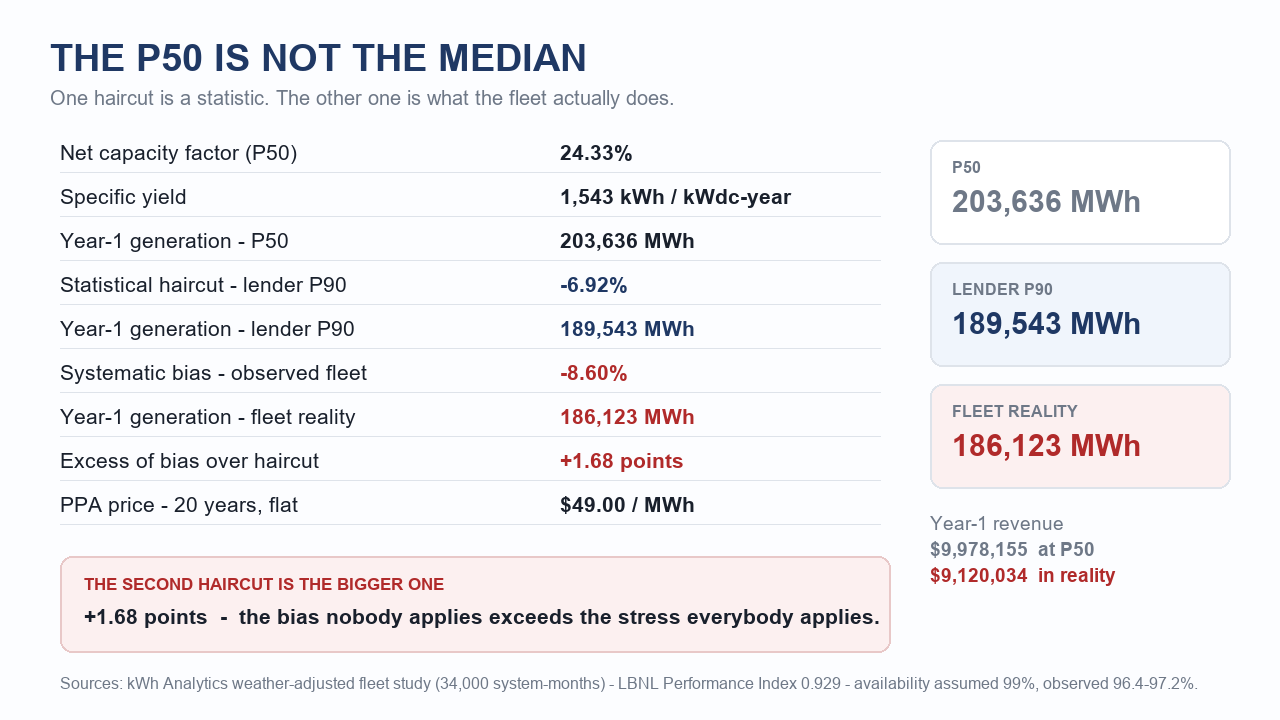
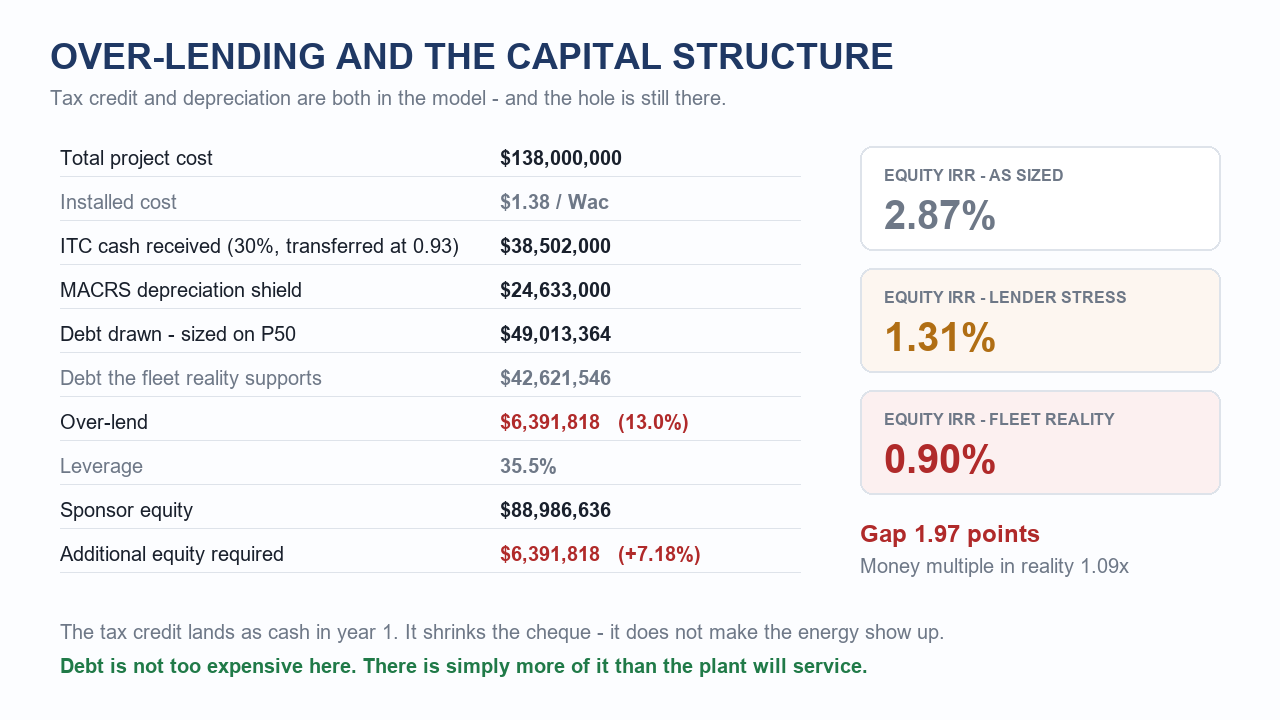
Measured against their own P50, US plants come in 8.60% short. That figure is weather-adjusted, drawn from tens of thousands of system-months, and corroborated by a national-laboratory first-year performance index of 0.929 and by observed availability of 96.4-97.2% against the 99% every pro forma assumes. It is larger than the 6.92% haircut the bank applies as its adverse case.

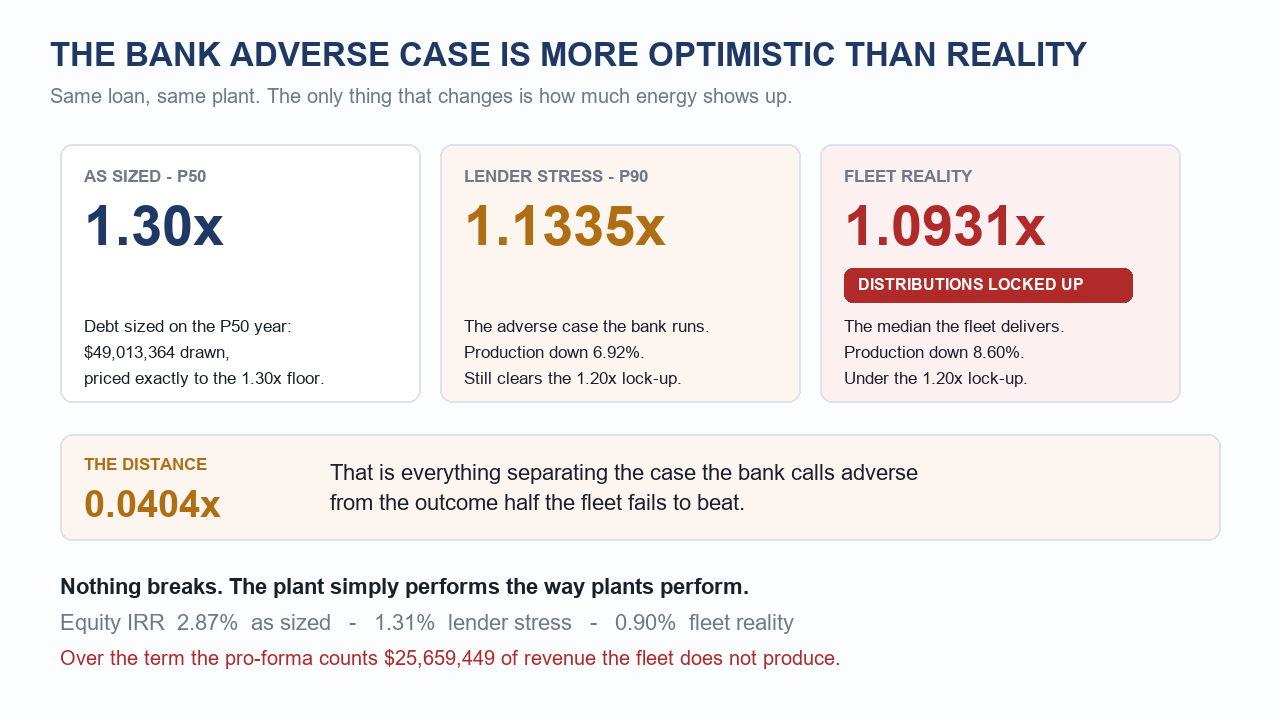
On the same loan, on the same 100 MWac plant:
  • As sized (P50): minimum DSCR 1.30x, exactly at the floor. The pro forma.
  • Lender stress (P90): 1.1335x. The bank adverse case.
  • Observed fleet median: 1.0931x - below the bank's own stress case and below a 1.20x distribution lock-up, with nothing unusual having happened.

Priced as debt: $49,013,364 advanced against $42,621,546 that the observed median supports - $6,391,818 of over-lending, 13.0% of the advance, and 7.2% more equity than the pro forma asked for.

What is in the engine. Bias and variability are kept apart: the P90 prices variability, the fleet index prices bias. Set the index to 100% and the over-lending figure collapses to $0.00 exactly - a check that ships with the model. Debt service is sculpted: each year the payment follows that year's cash flow, so coverage sits at the floor for the life of the loan, the way project finance actually sizes.

Conventions corrected, and sourced. PPA prices are flat nominal - the 1-3% escalator is a residential convention. System degradation is 1.3% a year for plants above 25 MWac, not the 0.5% module figure. The merchant capture rate is 83% and falling. Tax attributes are modelled in full: a 30% ITC with a transfer discount, the standard 50%-of-credit basis reduction, 5-year MACRS and a 21% federal rate, with the ITC treated as cash received in year 1, not a discount on the equity cheque at closing.

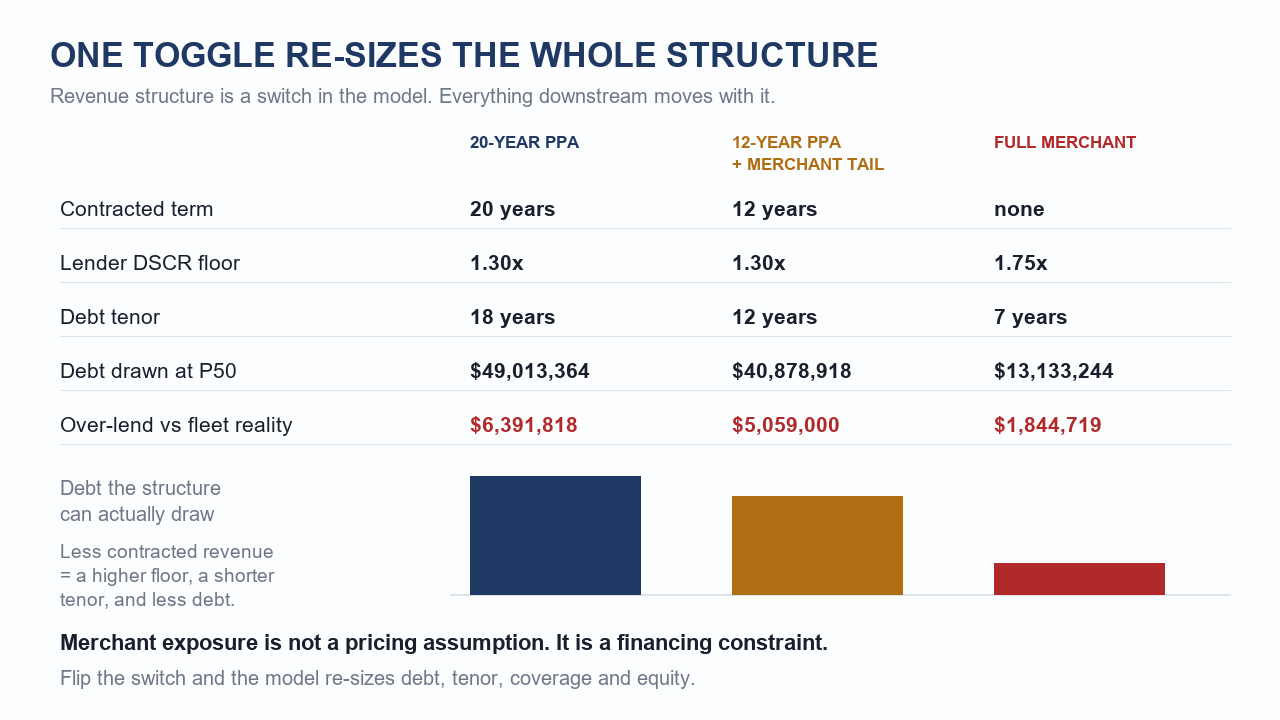
10 sheets, 35-year cash flows, three revenue structures that reload the whole model, and 22 declared inputs with sourced reference bands. Excel and Google Sheets compatible. Includes a 21-page user guide.

This Best Practice includes
model.xlsx (10 sheets, 35-year cash flows, sculpted debt, ITC + MACRS) + 21-page user guide (PDF) + README

Acquire business license for $99.00

Add to cart

Add to bookmarks

Discuss

Further information

Size the debt on a utility-scale solar project the way a lender does, then test that sizing against what operating plants actually deliver, and quantify the gap in dollars of over-lending and extra equity.

You are a solar developer, IPP, project-finance lender or investor underwriting a utility-scale PV project and you need a DSCR-driven, sculpted debt sizing with ITC and MACRS modelled properly.

You need a residential or commercial rooftop model, an engineering yield simulation such as PVsyst, or a portfolio-level corporate model - this is a single-project finance model.


0.0 / 5 (0 votes)

please wait...