Publication number: ELQ-93486-1
View all versions & Certificate

Synthetic Biology & Biofoundry Financial Model
Model DBTL, strain learning, scale-up, COGS, revenue, funding, three statements, valuation, and scenarios through 2050.
🧬 TURN SYNTHETIC-BIOLOGY ASSUMPTIONS INTO A COMPLETE INVESTMENT CASEBioForge™ is a fully editable, formula-driven financial and production-economics model for synthetic-biology platforms, biofoundries, precision-fermentation companies, and bio-based manufacturers. It connects the scientific and engineering drivers that determine commercial viability—Design-Build-Test-Learn cycles, strain titer, scale-up efficiency, downstream recovery, purity, reactor configuration, and cost per kilogram—to revenue, capital requirements, three-statement forecasts, cash flow, and investment returns.
This is not a generic startup forecast with biological terminology added on top. The workbook follows a bio-manufacturing venture from laboratory development and strain improvement through pilot, demonstration, and commercial-scale production. Users can evaluate Platform, Vertical, or Hybrid strategies across 26 annual periods from 2025 through 2050.
🎯 WHAT THE MODEL HELPS YOU ANSWER
• How much could DBTL development cost, and when could the target titer be reached?
• How do starting titer, learning, genetic drift, scale-up penalties, reactor configuration, and DSP affect capacity and COGS?
• What batch economics and annual capacity result at Pilot, Demo, and Commercial scales?
• How do Commodity, Specialty, and Pharmaceutical purity requirements change recovery, product loss, and unit economics?
• How much capital could laboratory, pilot, demo, DSP, utility, and commercial infrastructure require—and when?
• Can access fees, milestones, royalties, product sales, grants, co-development, and optional carbon credits support the plan?
• What are the projected financial statements, funding needs, NPV, IRR, MOIC, and terminal value?
• Which technical, commercial, operating, and financial assumptions create the greatest valuation risk?
⚙️ CENTRALIZED TECHNICAL-TO-FINANCIAL ENGINE
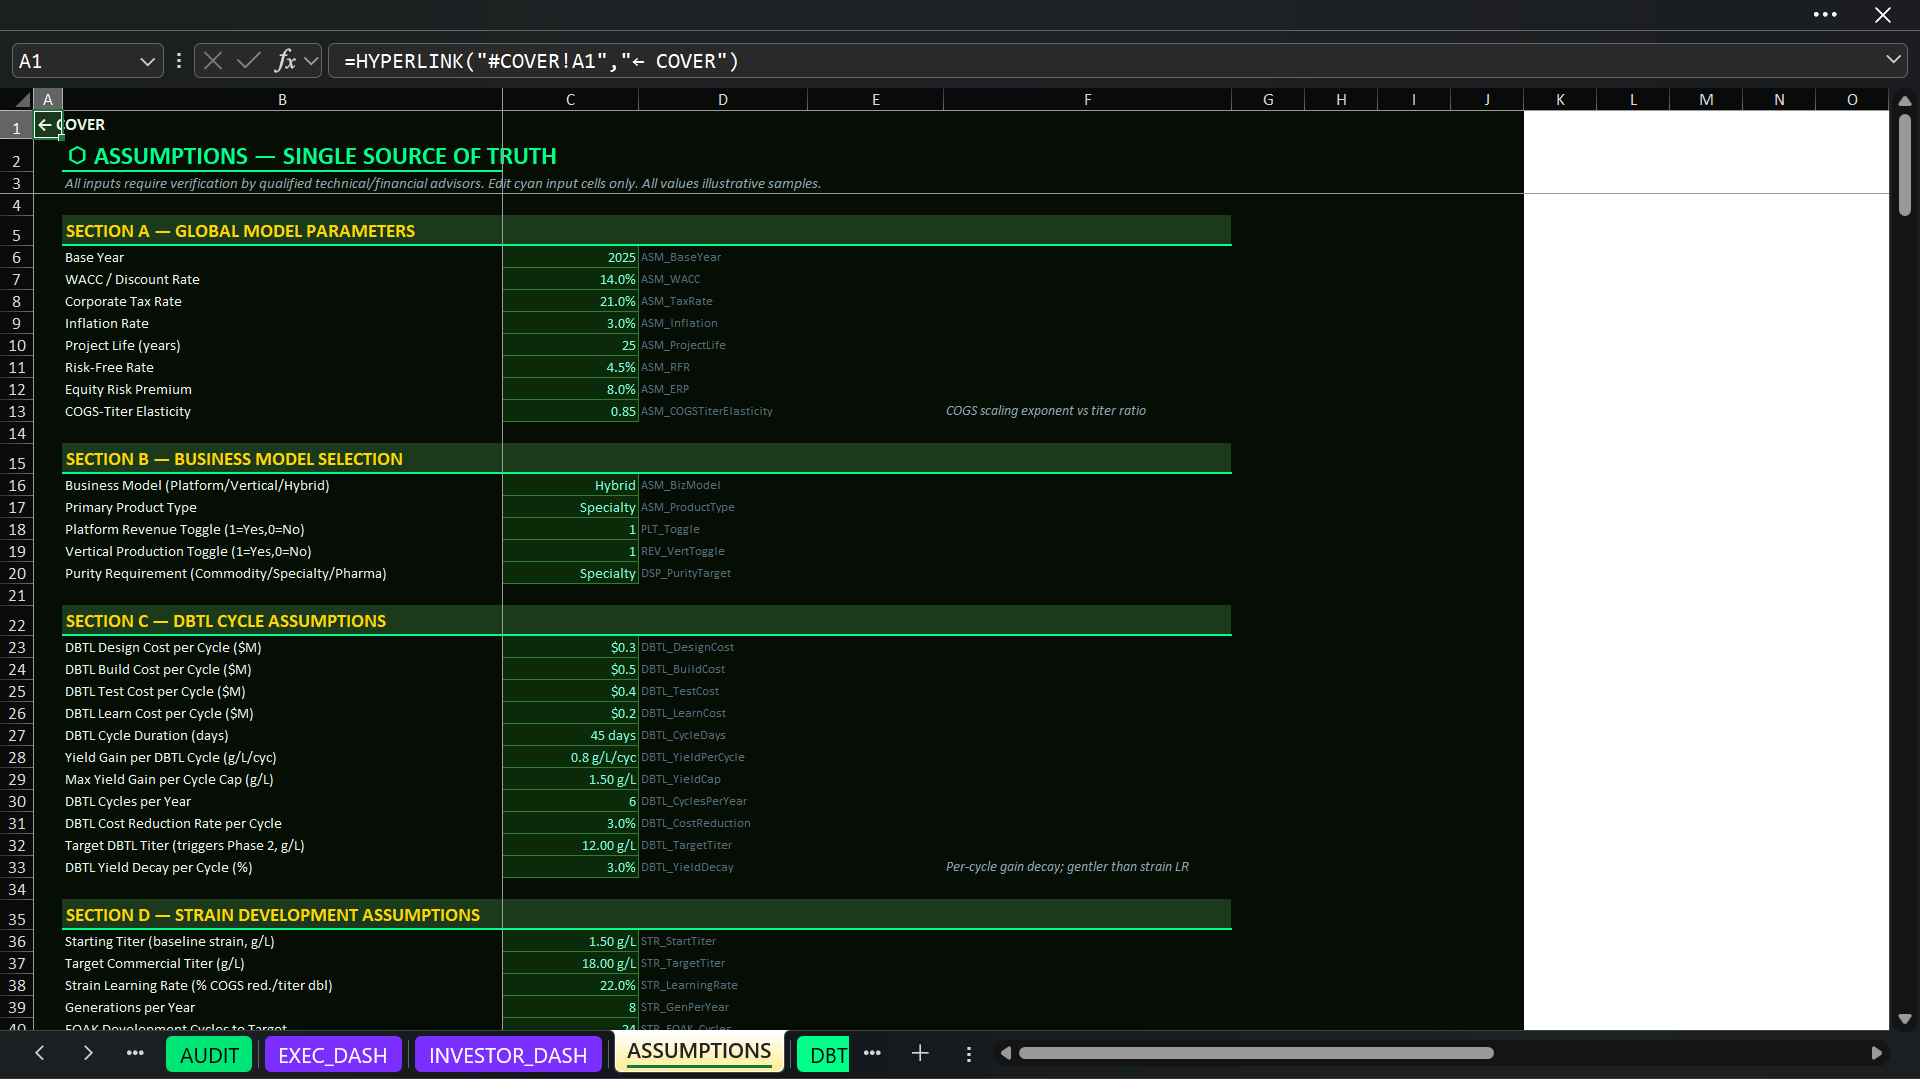
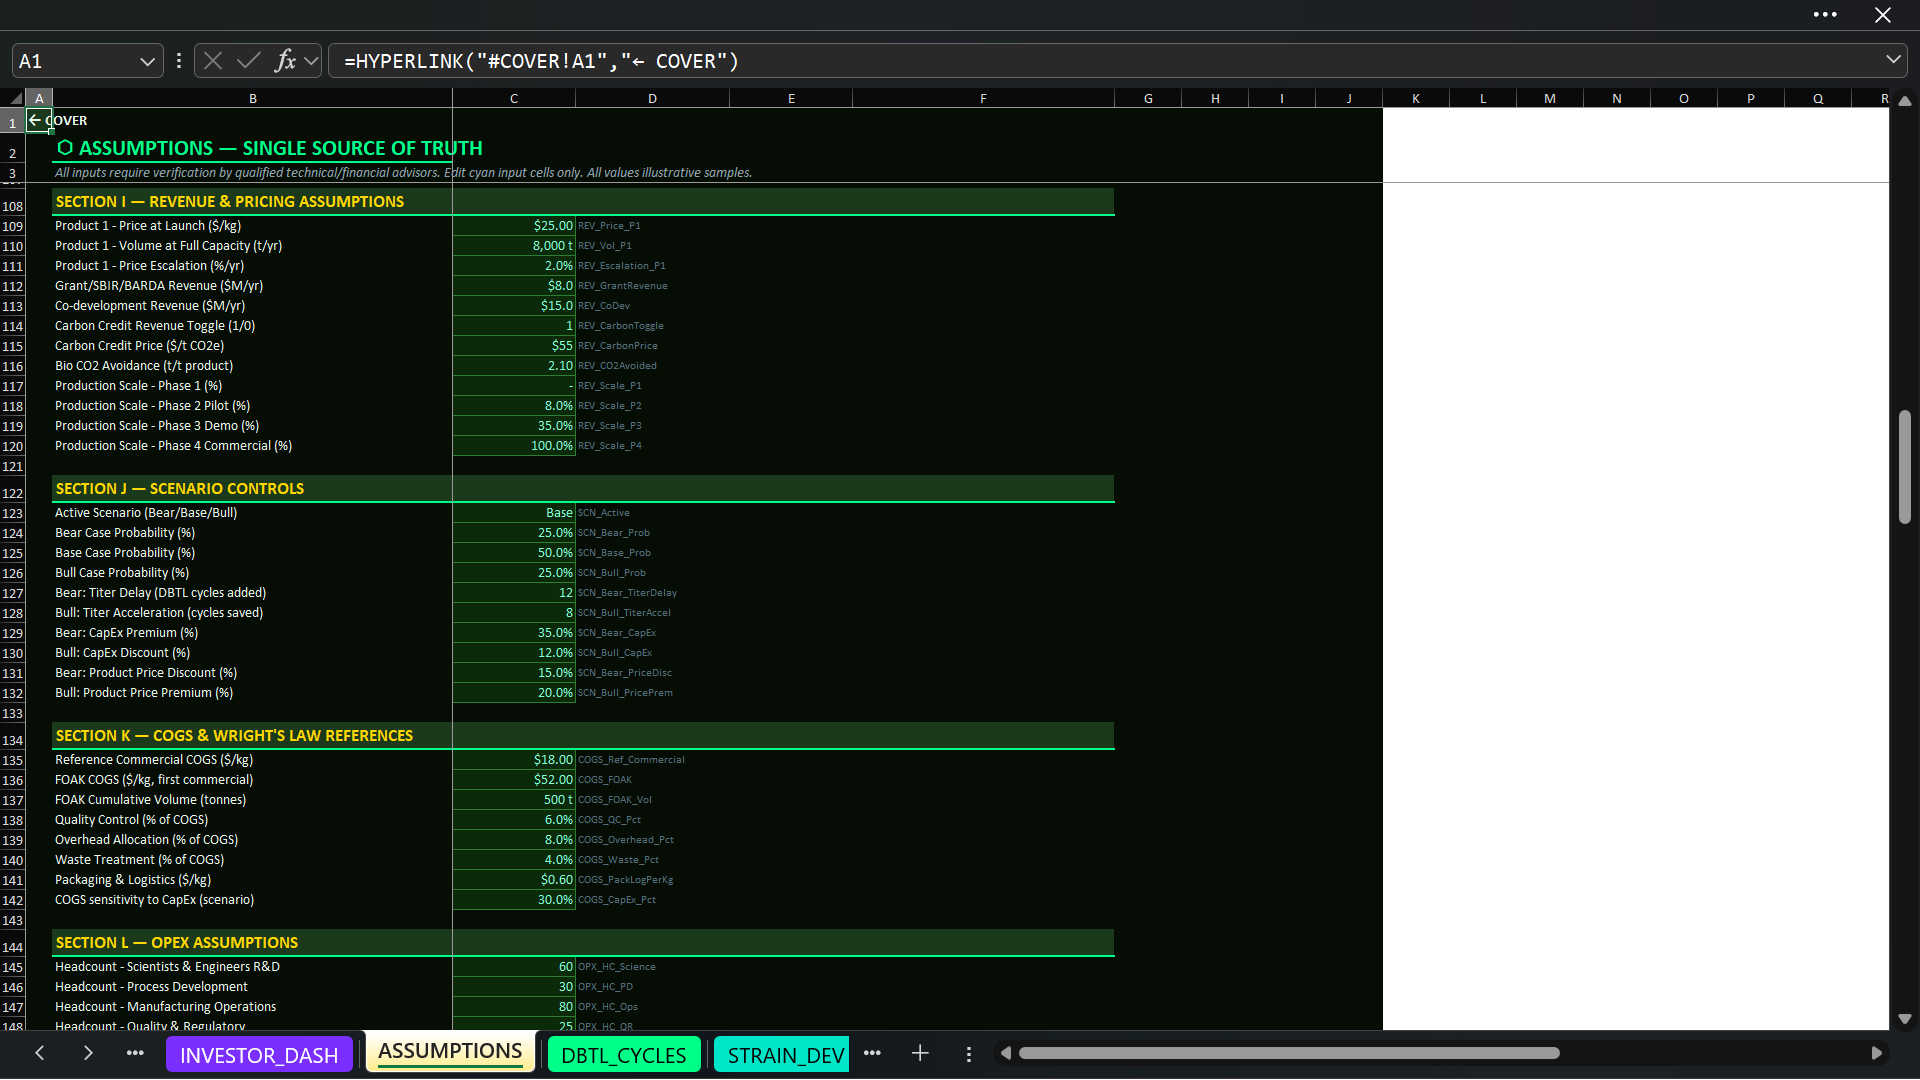
The ASSUMPTIONS sheet acts as the single source of truth. Editable inputs are organized into finance parameters, business-model selection, DBTL economics, strain development, fermentation scale-up, CapEx, DSP, platform economics, revenue and pricing, scenarios, COGS and Wright’s Law references, OPEX, working capital, and financing.
The model supports three commercialization structures:
• Platform — partner access fees, development milestones, and royalty income.
• Vertical — internally manufactured product sales and related revenue streams.
• Hybrid — combines platform partnerships with owned production.
Users can enable or disable platform and vertical revenue, select a product and purity profile, and choose a Bear, Base, or Bull scenario without rebuilding the architecture.
🔬 DBTL CYCLES AND STRAIN DEVELOPMENT
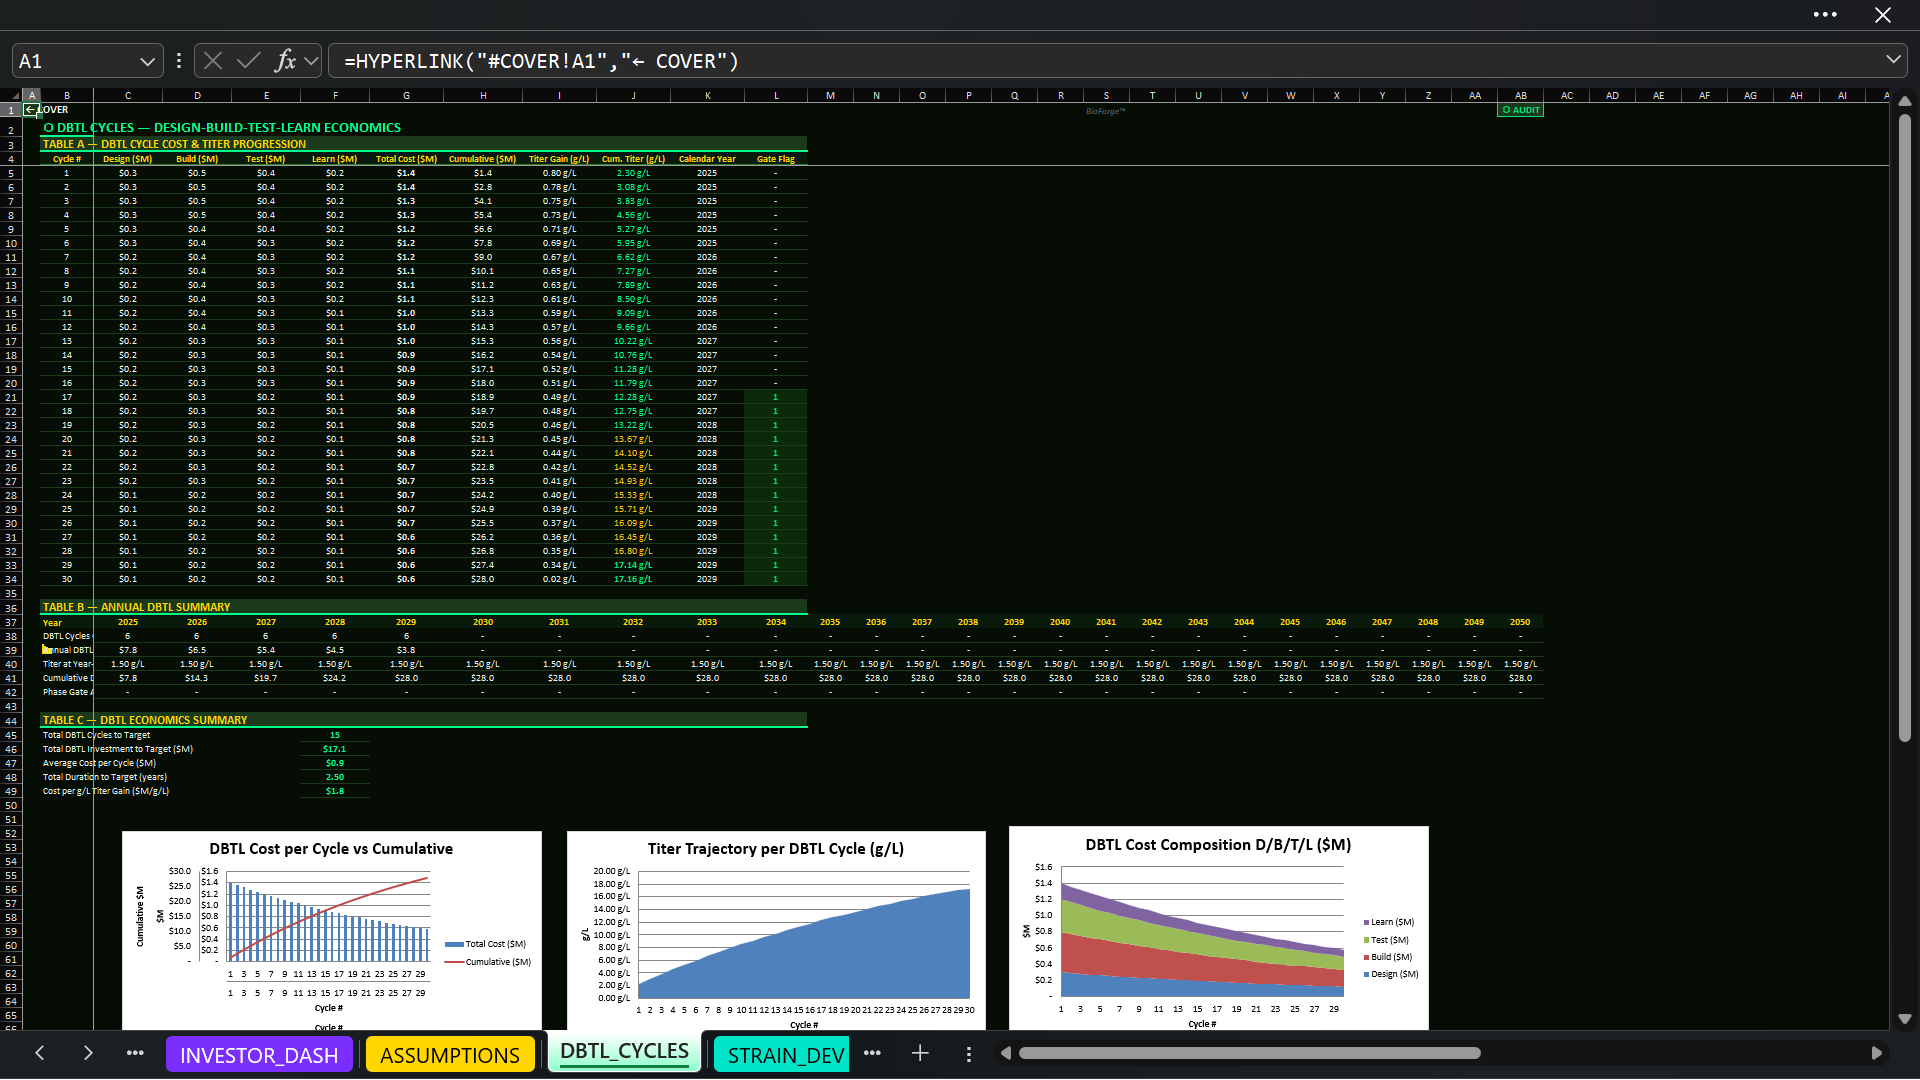
DBTL_CYCLES models Design, Build, Test, and Learn costs at the individual-cycle level. It calculates total and cumulative DBTL investment, cycle duration, declining cost, titer gain, cumulative titer, calendar-year mapping, and phase-gate achievement.
Annual summaries show completed cycles, yearly spend, year-end titer, cumulative investment, and gate status. An economics summary reports cycles and investment to target, average cycle cost, duration, and cost per unit of titer gain.
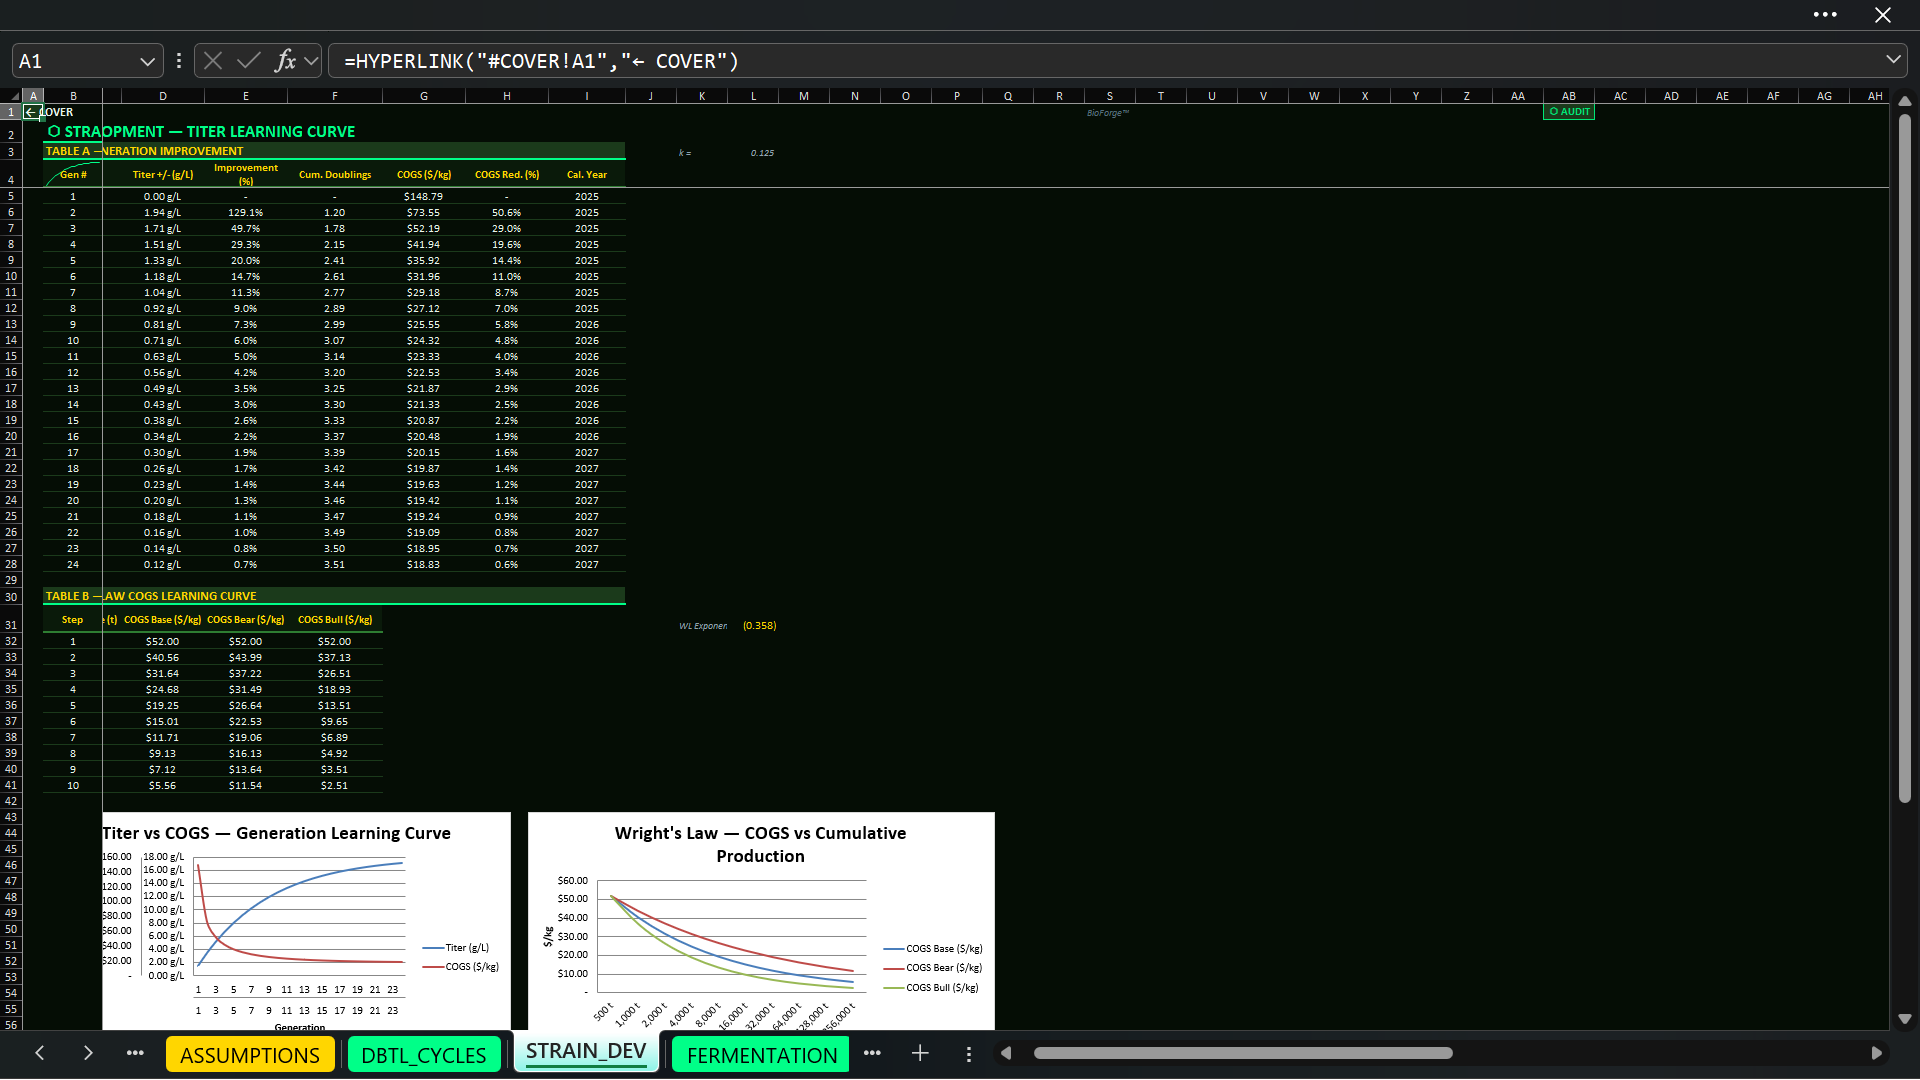
STRAIN_DEV adds a generation-by-generation learning curve covering starting and target titer, improvement by generation, cumulative doublings, calendar timing, scale-up penalties, genetic-stability drift, and the effect of titer development on COGS. A Wright’s Law table compares Base, Bear, and Bull COGS trajectories as cumulative volume increases.
🏭 FERMENTATION, CAPACITY, AND SCALE-UP
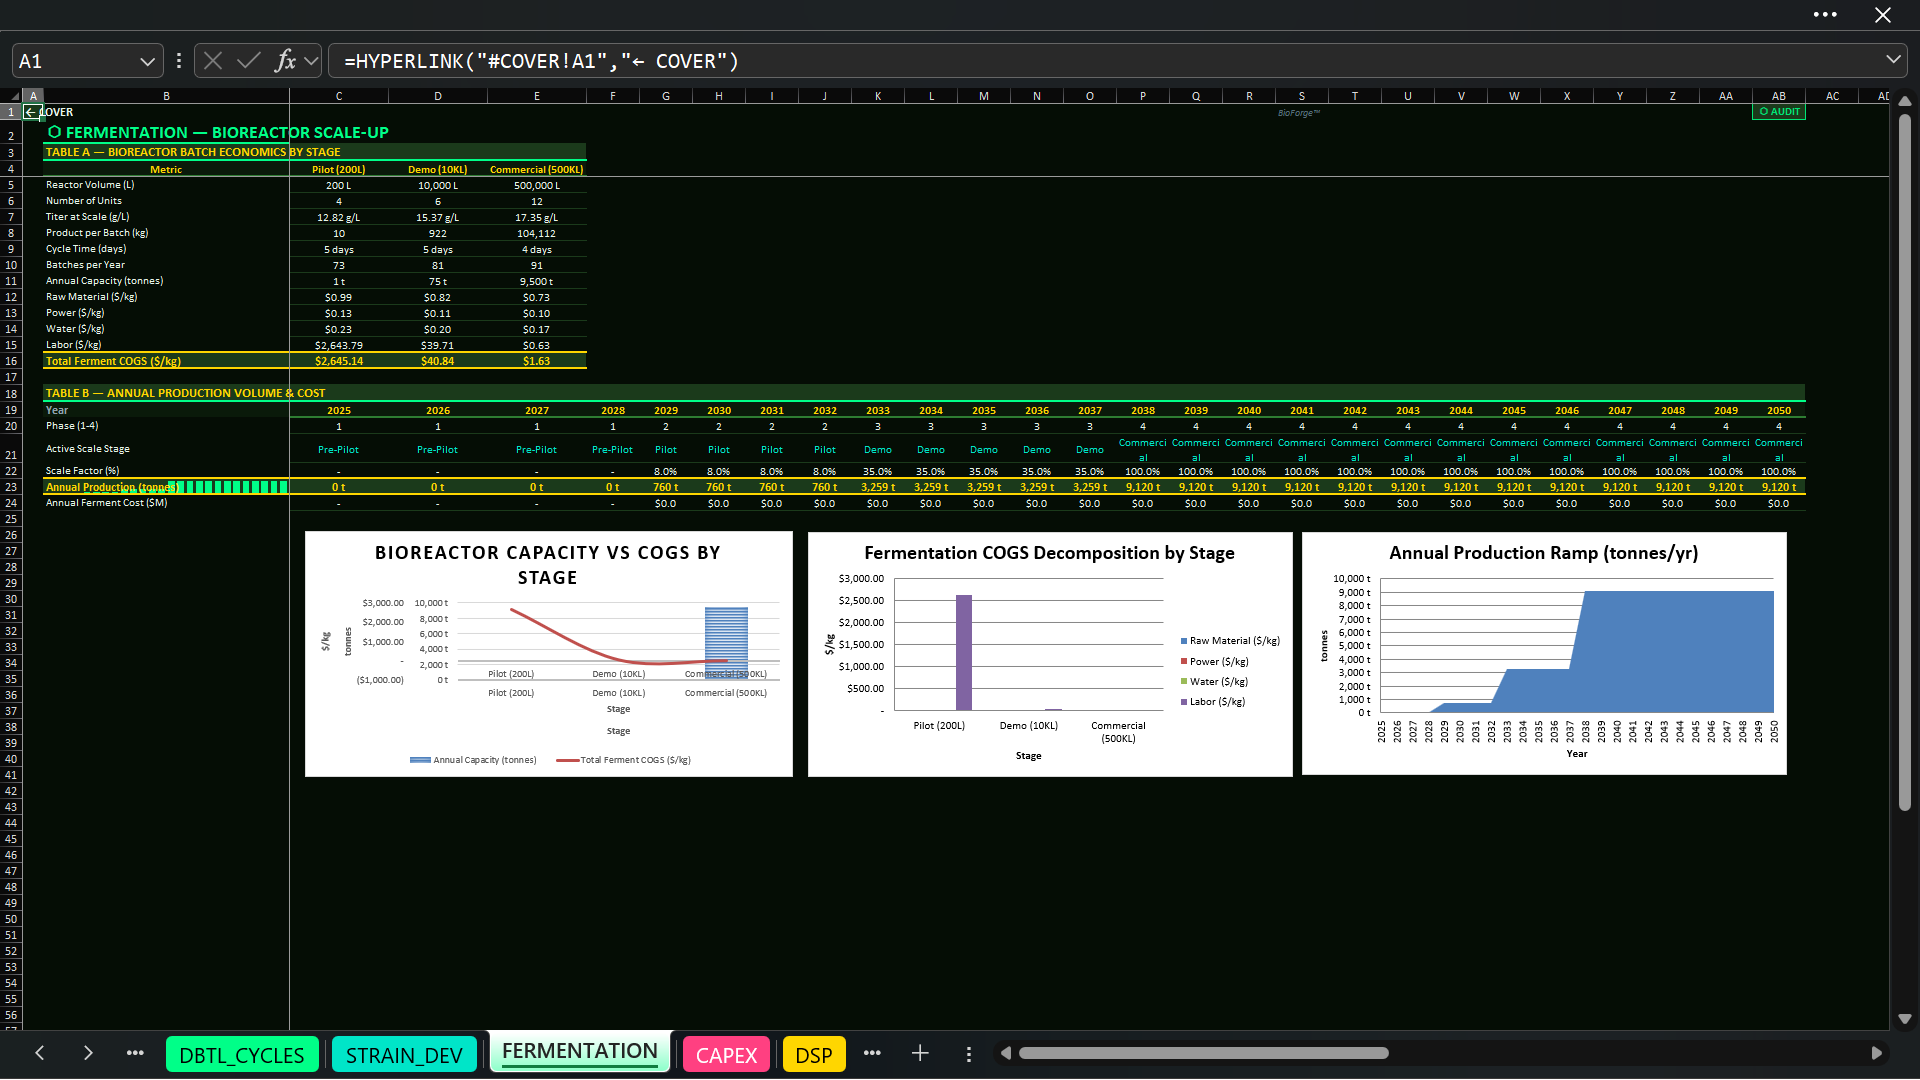
FERMENTATION compares Pilot, Demo, and Commercial bioreactor economics. It models:
• Reactor volume and number of units.
• Titer achieved at each scale.
• Product per batch and annual capacity.
• Cycle time and annual batches.
• Glucose, nitrogen, media, antifoam, power, water, and labor economics.
• Total fermentation cost per kilogram.
Annual production is driven by development phase and scale factor, allowing the model to move from pre-pilot activity through commercial operations. Editable scale-up efficiencies and laboratory-to-plant yield loss prevent commercial output from being treated as a simple multiple of lab results and make scale-up risk part of the financial analysis.
🏗️ FOAK CAPITAL EXPENDITURE AND PROJECT PHASING
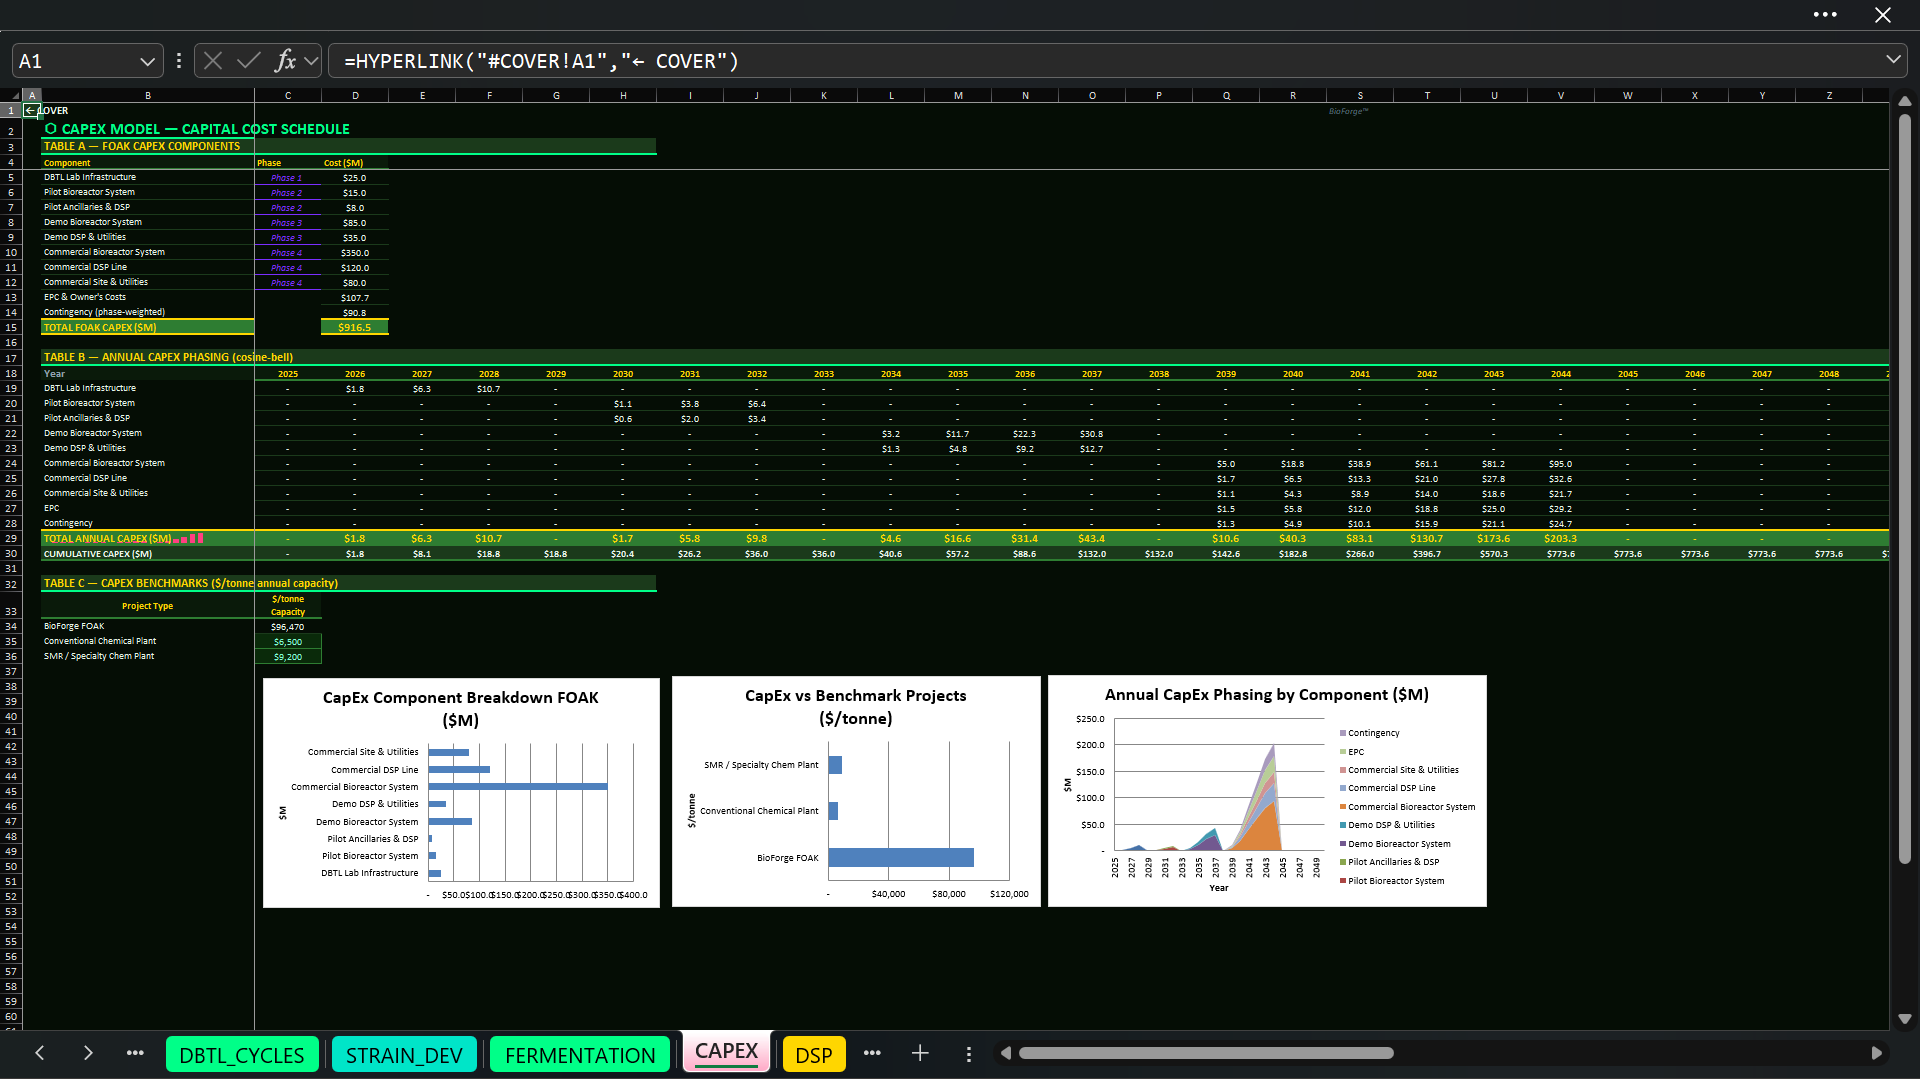
CAPEX builds first-of-a-kind requirements for the DBTL laboratory, pilot bioreactors, pilot ancillaries and DSP, demo bioreactors, demo DSP and utilities, commercial bioreactors, commercial DSP, site utilities, EPC and owner’s costs, and phase-specific contingency.
The annual schedule phases spending and calculates cumulative investment. Capacity benchmarks provide conventional chemical and specialty-manufacturing reference points, supporting financing, facility strategy, and capital-overrun analysis.
🧪 DOWNSTREAM PROCESSING AND PURITY ECONOMICS
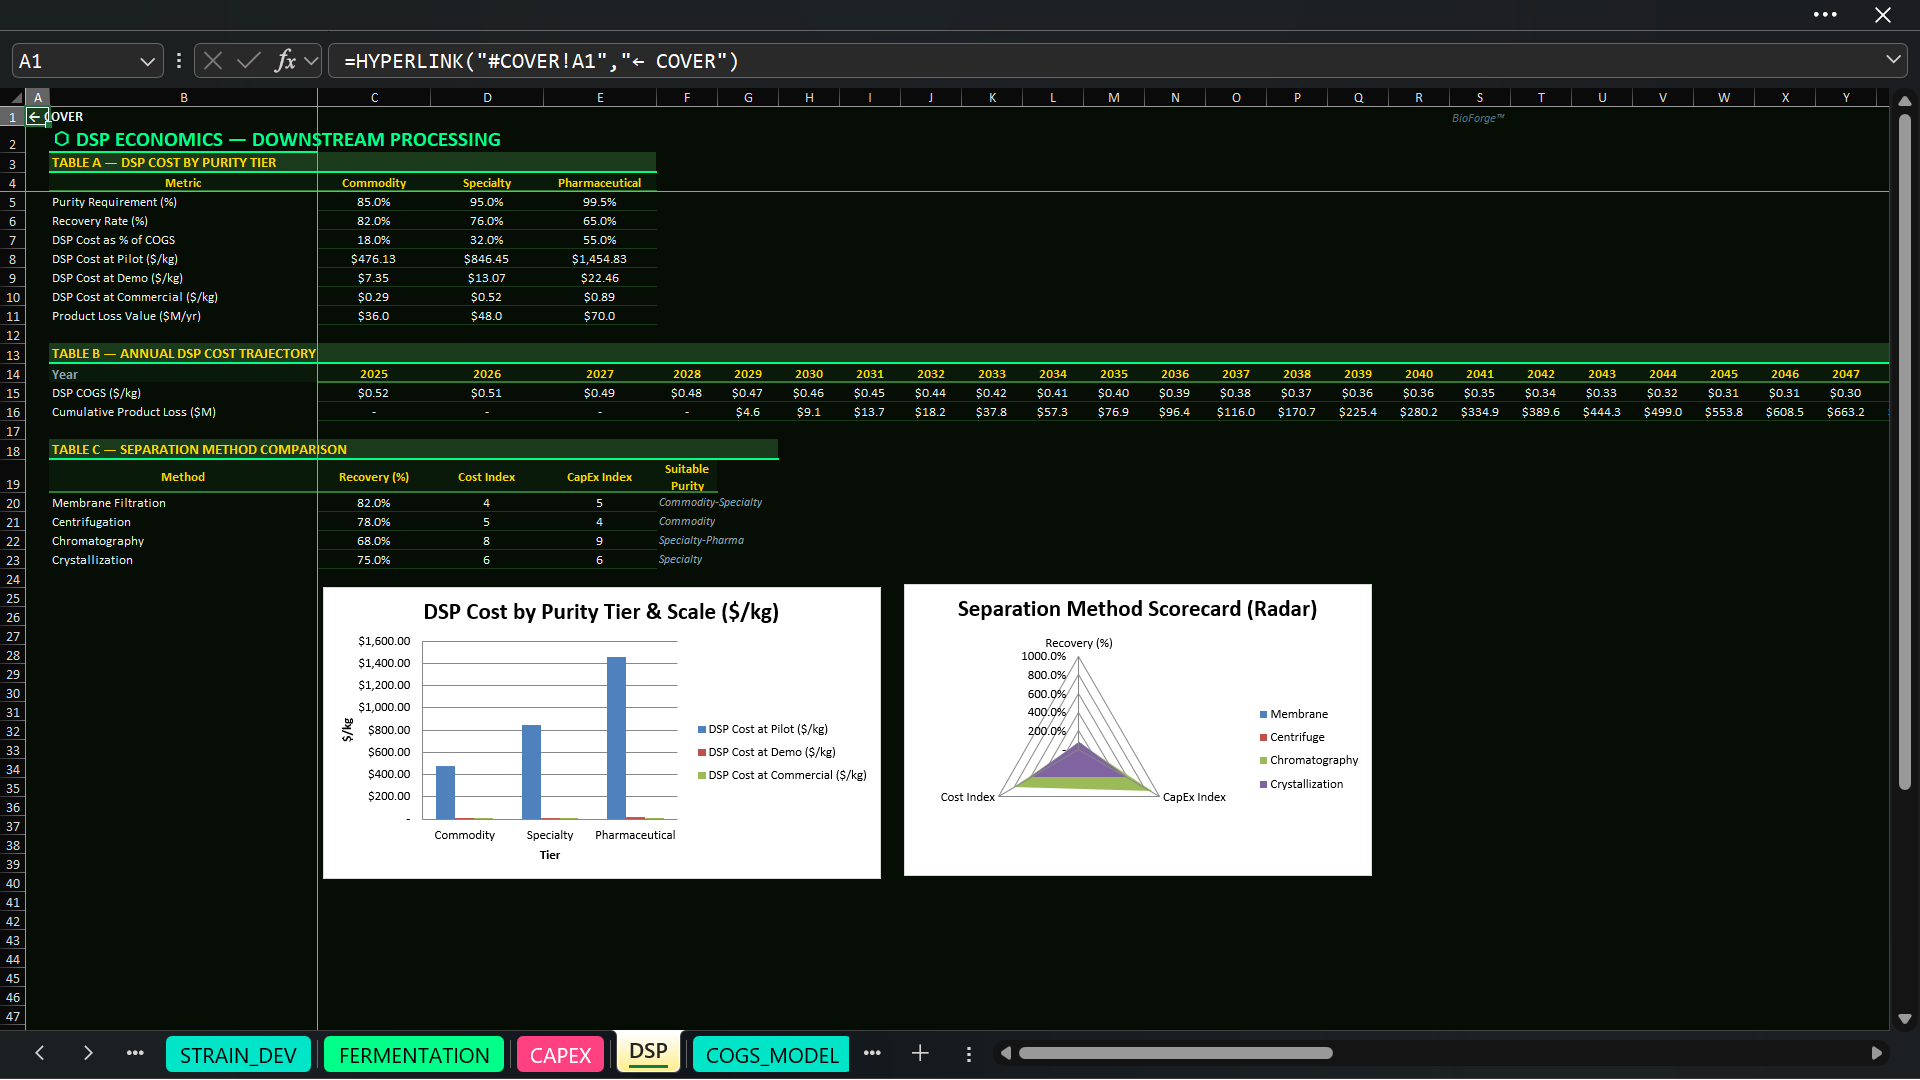
DSP compares Commodity, Specialty, and Pharmaceutical processing requirements using different purity targets, recovery rates, cost percentages, product-loss assumptions, and annual cost-reduction factors.
A high-level comparison covers membrane filtration, centrifugation, chromatography, and crystallization. These are analytical references rather than engineering recommendations.
💵 STAGE-BASED COGS MODEL
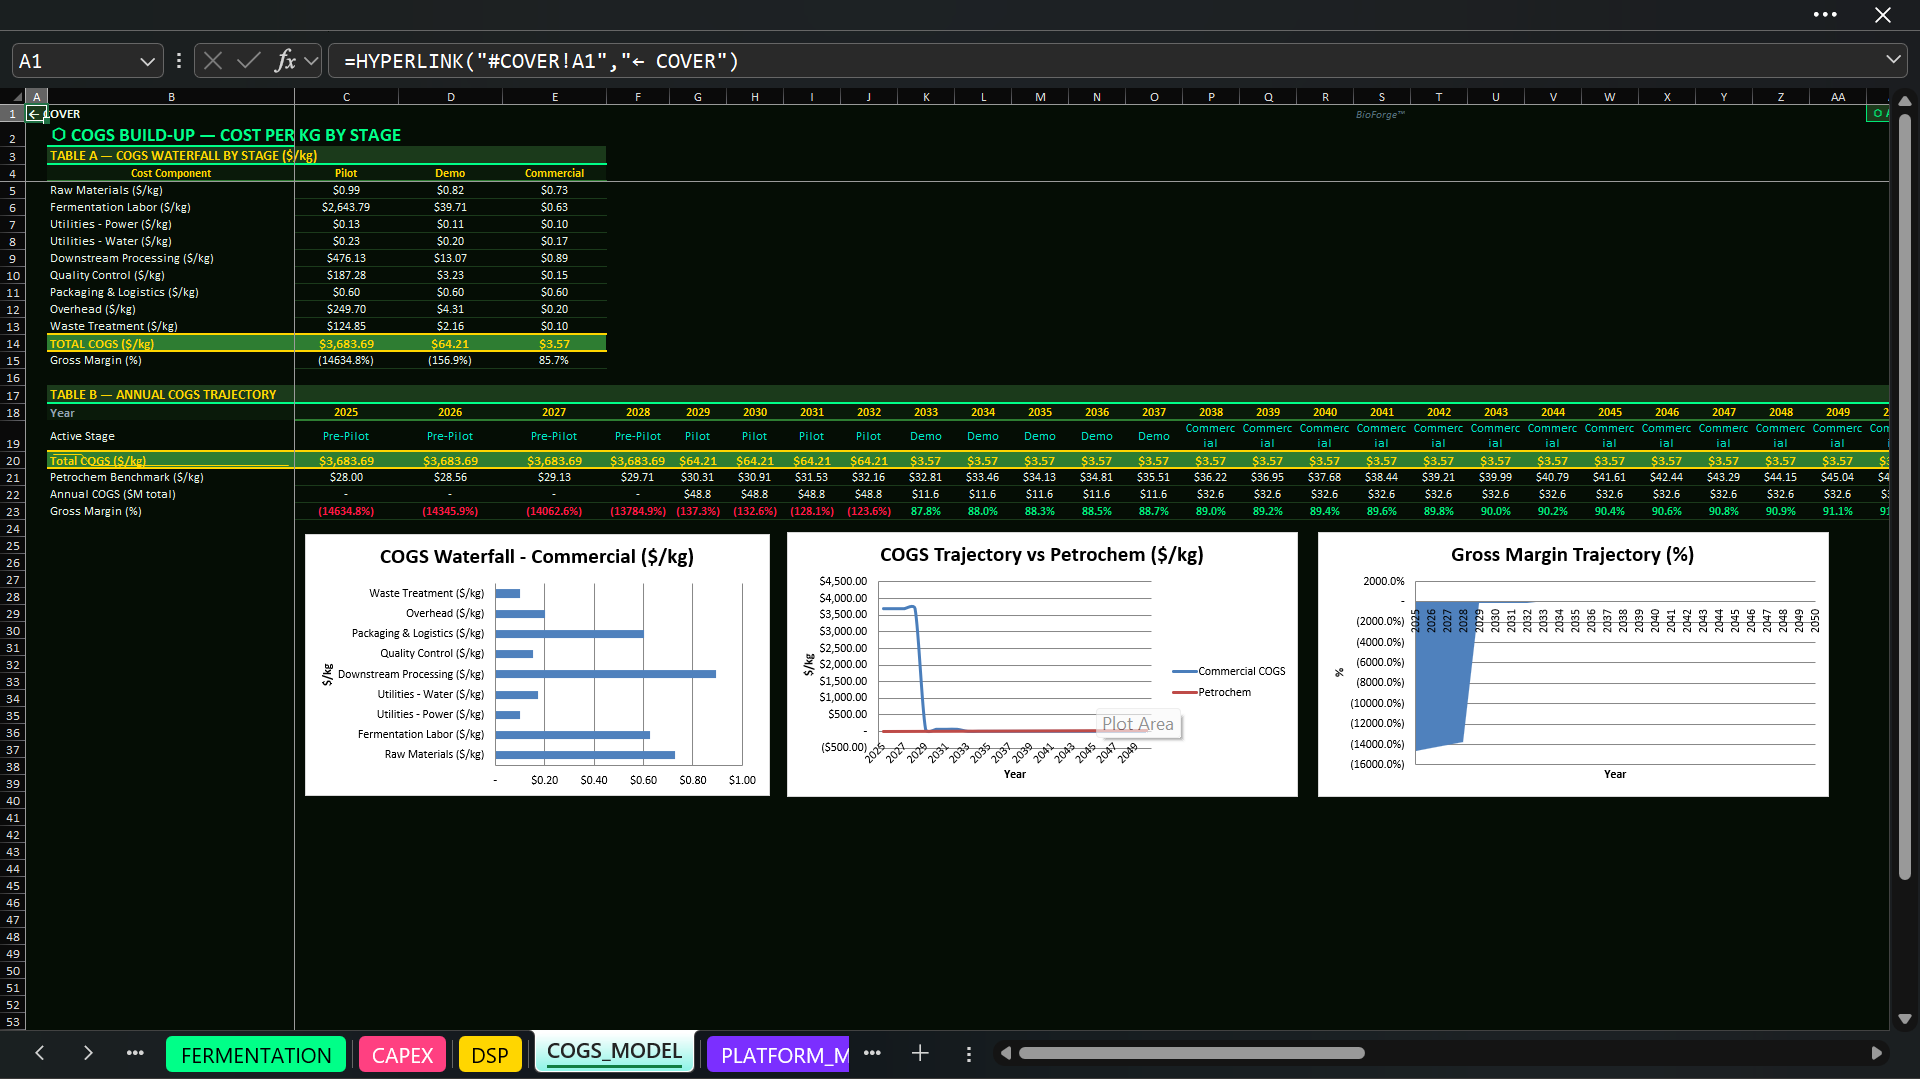
COGS_MODEL creates a cost-per-kilogram waterfall across Pilot, Demo, and Commercial stages. It covers:
• Raw materials and fermentation inputs.
• Fermentation labor, power, and water.
• Downstream processing and quality control.
• Packaging, logistics, overhead, and waste treatment.
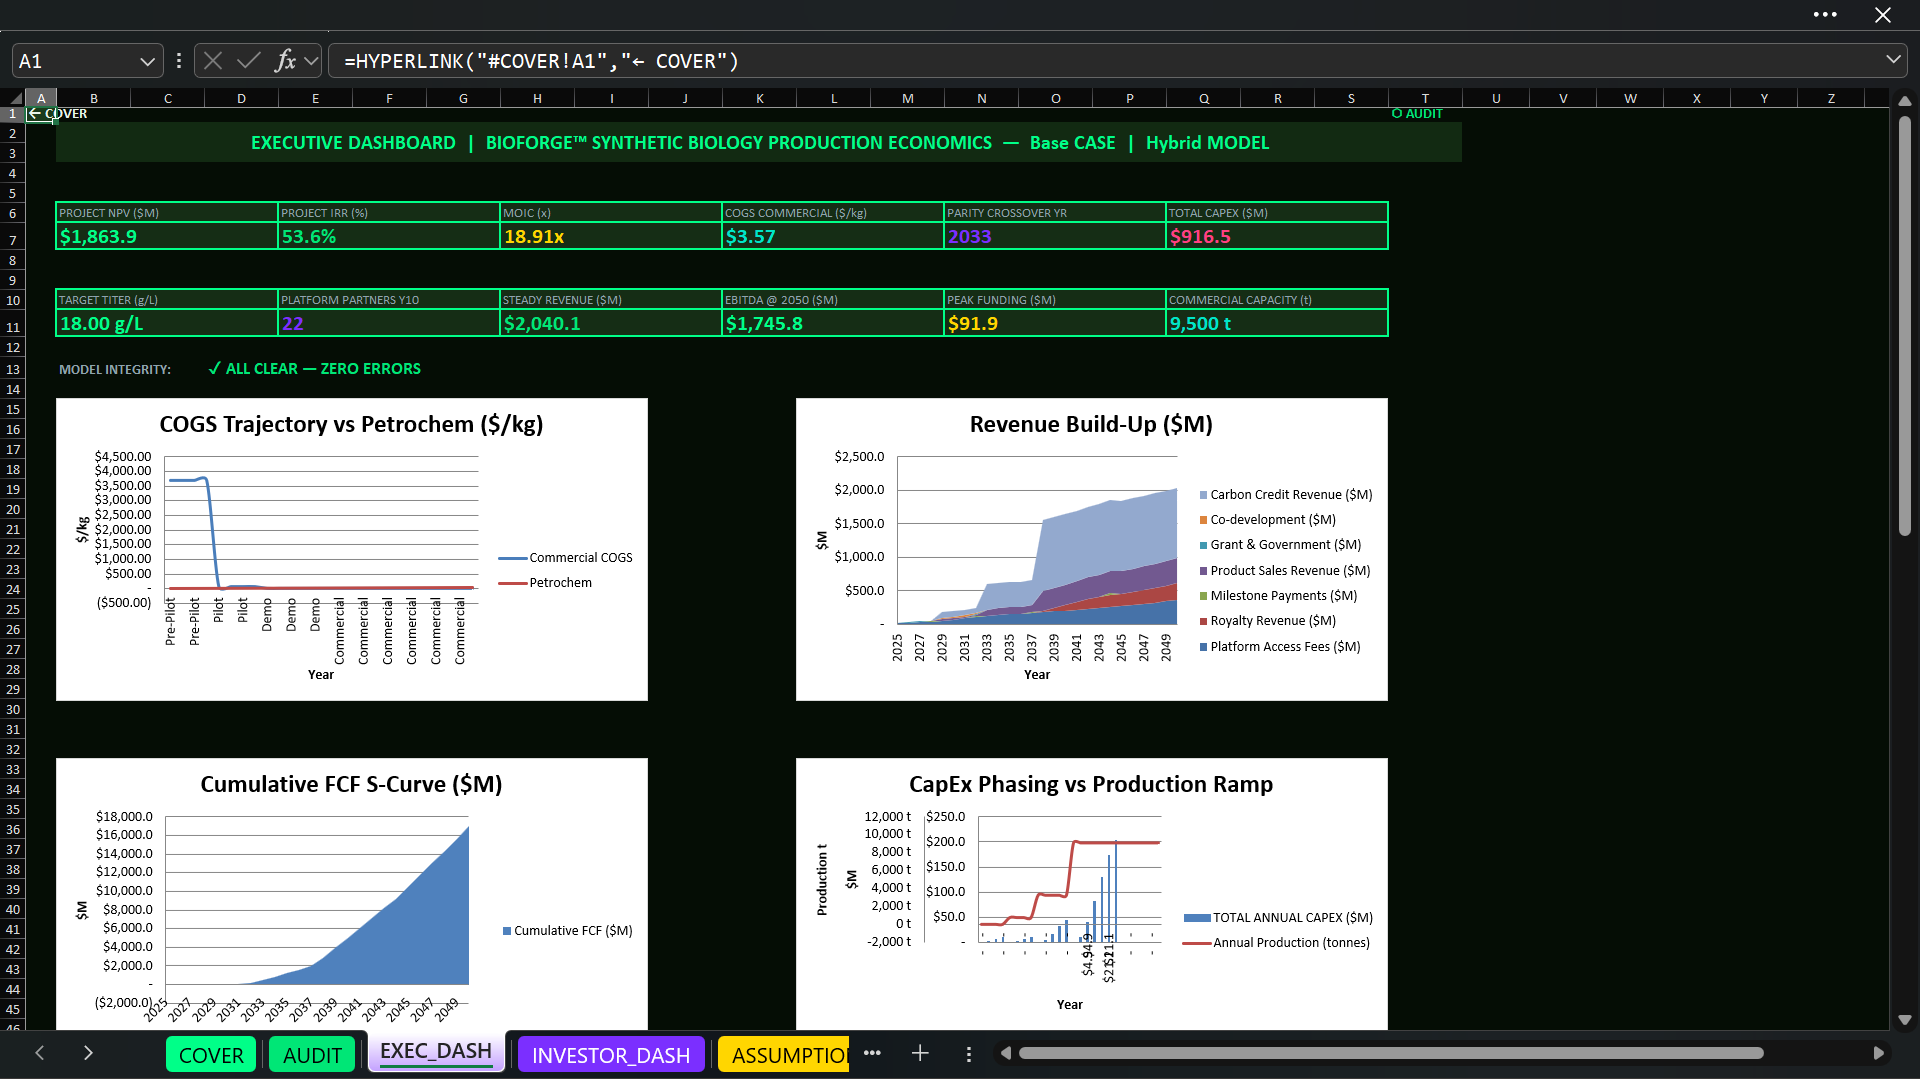
The module calculates total COGS and gross margin by stage and shows the annual cost trajectory through scale-up. Bio-based production costs are compared with petrochemical and specialty-chemical benchmarks. Buyers can test whether improvements in titer, scale, recovery, learning, and utilization create competitive unit economics.
💰 MULTI-STREAM REVENUE AND COMMERCIALIZATION MODEL
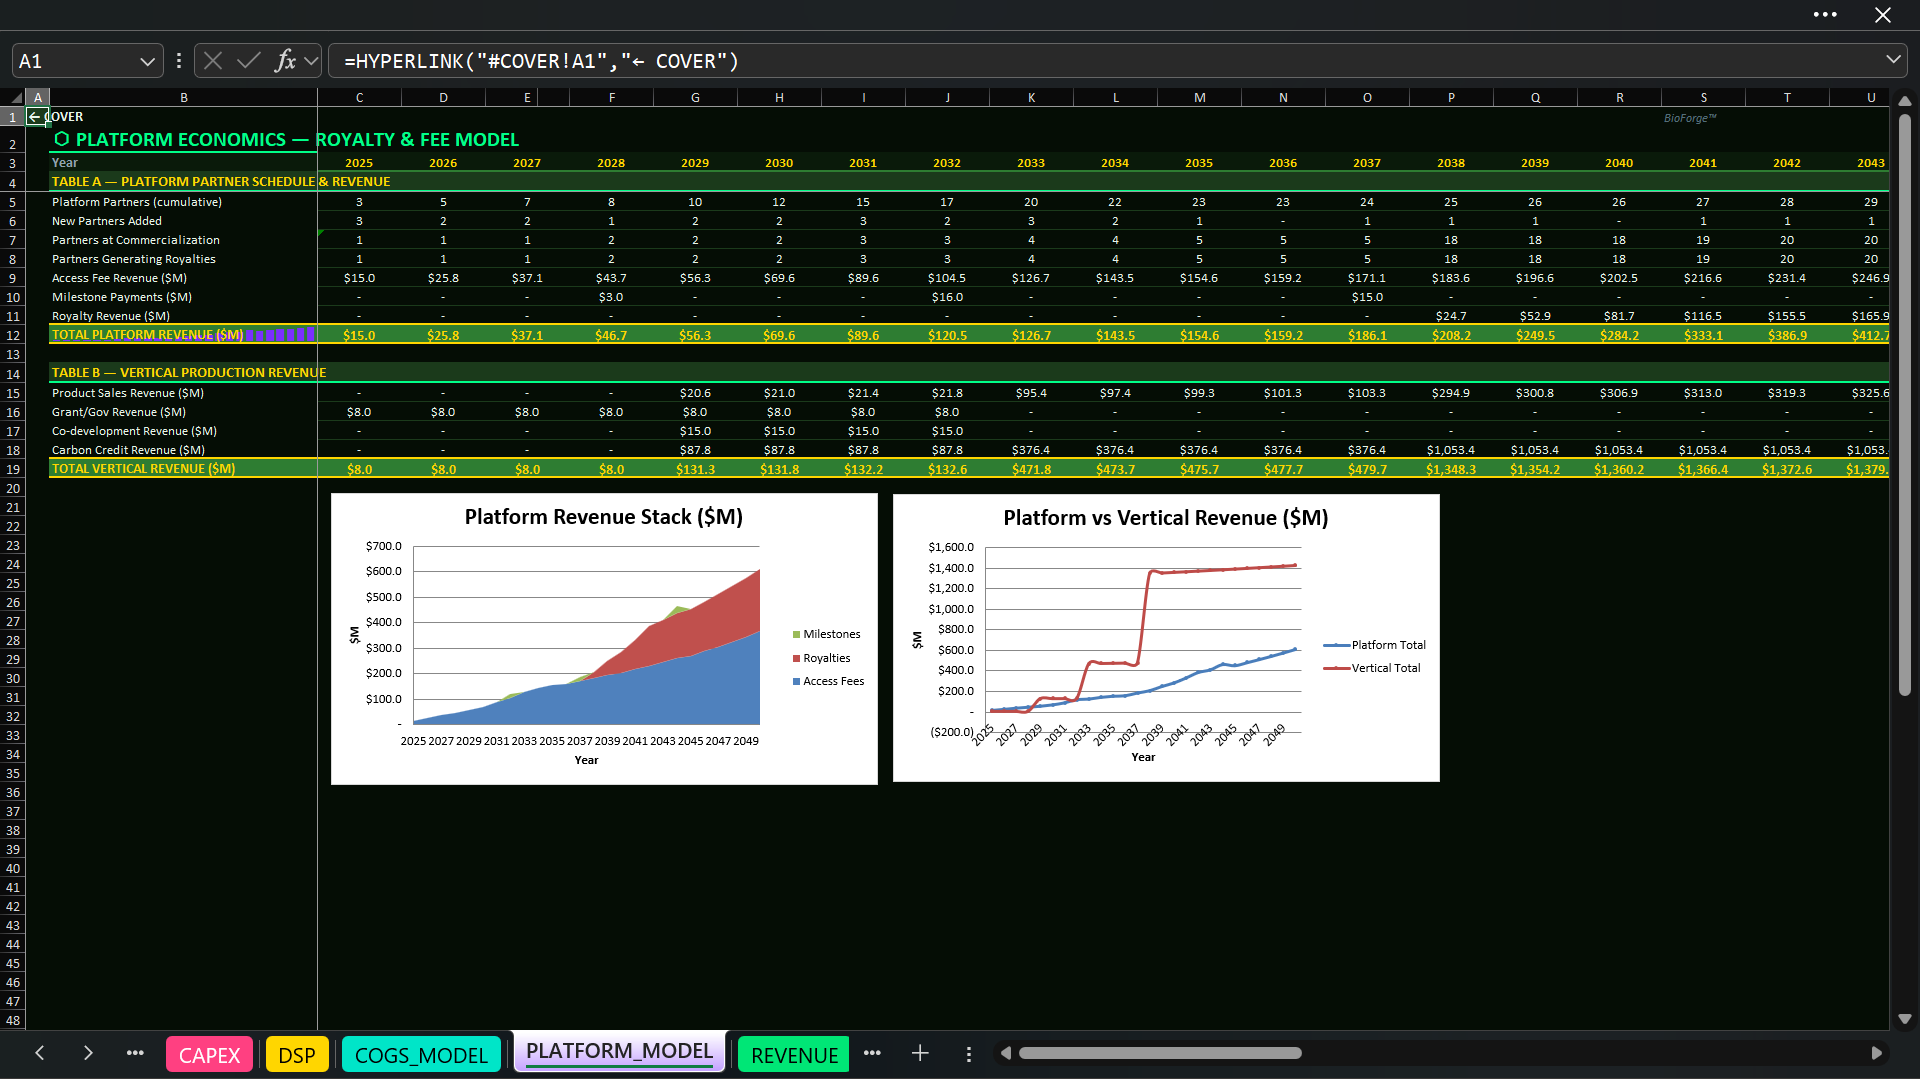
Platform economics cover partners, commercialization timing, access fees, milestone payments, royalties, partner revenue, and revenue ramps. The model distinguishes development-period income from royalty revenue generated after partner commercialization.
Vertical economics cover product pricing, volume, price escalation, product sales, grants and government revenue, co-development, and optional carbon credits. Carbon-credit revenue can be switched off so it is not automatically treated as a guaranteed benefit.
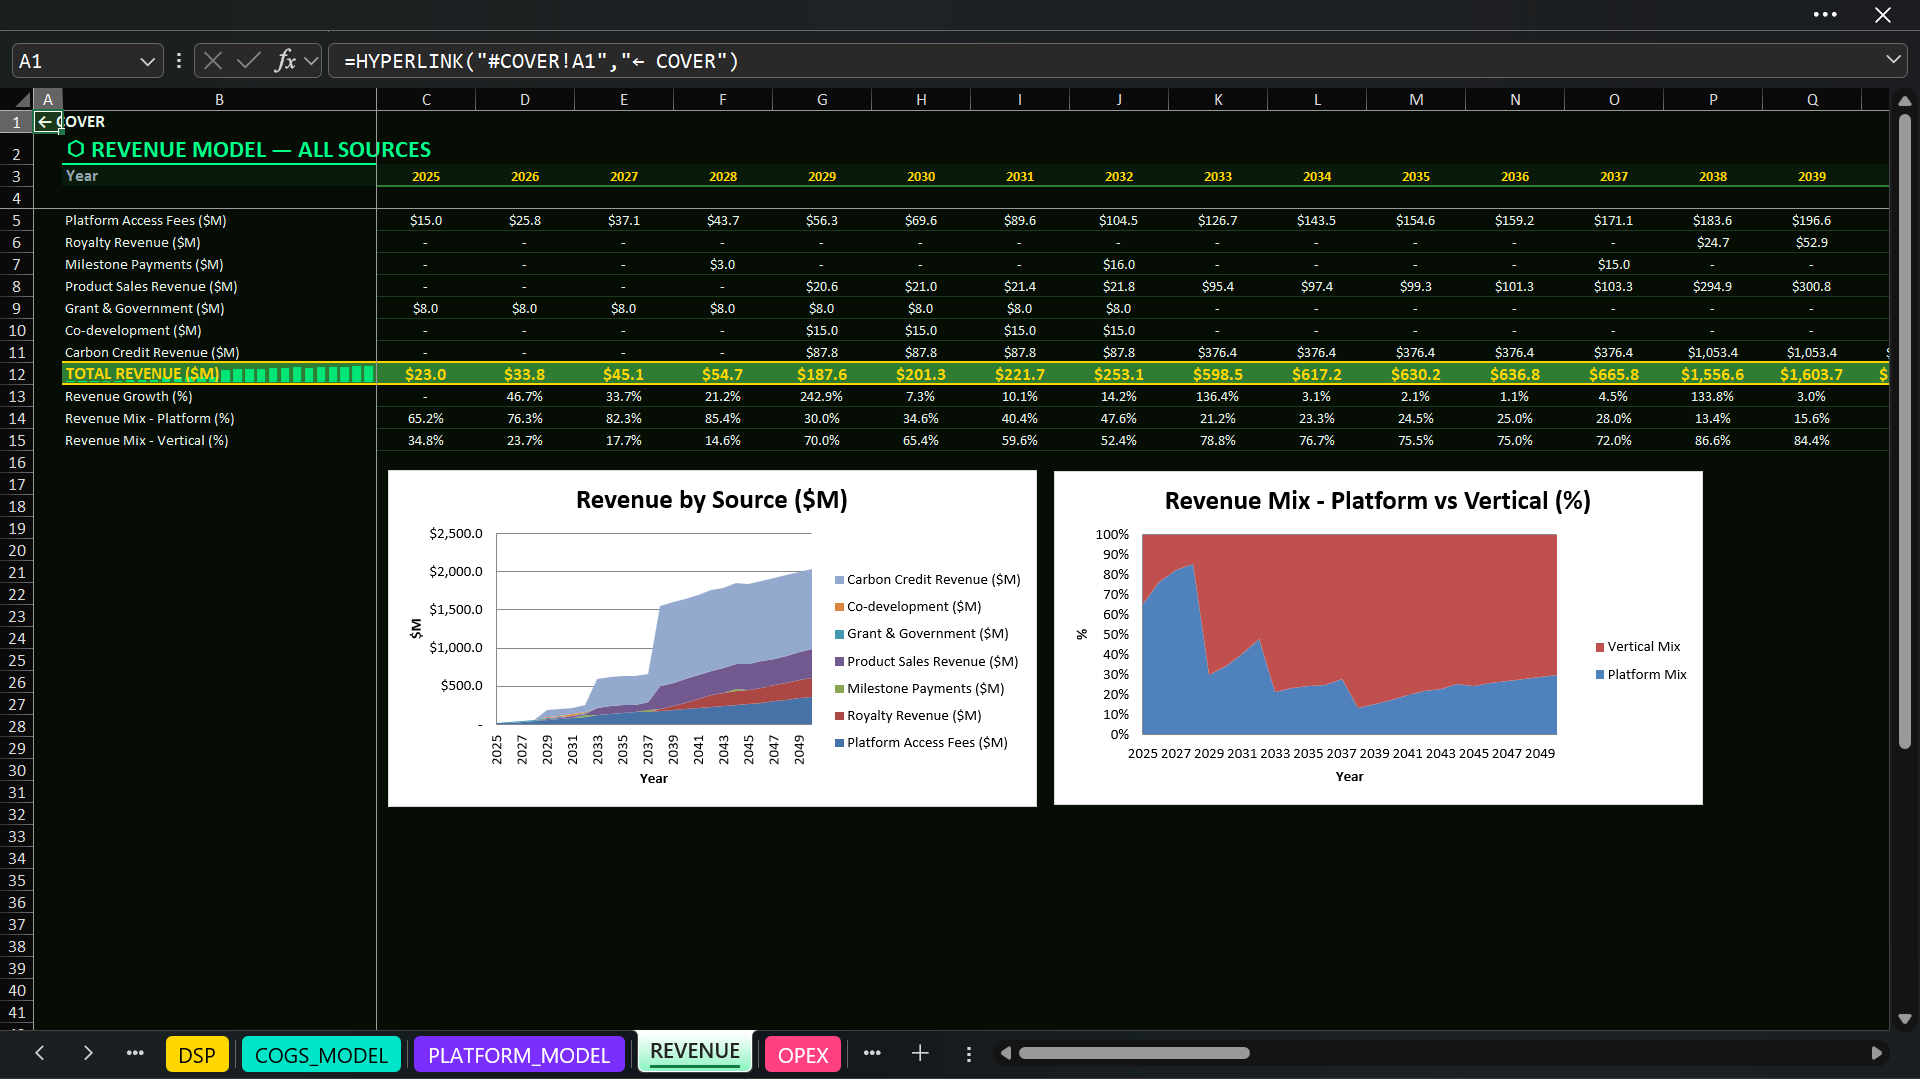
REVENUE consolidates enabled sources, calculates growth, and displays the Platform-versus-Vertical mix for comparison with a Hybrid approach.
👥 OPERATING COSTS AND ORGANIZATIONAL BUILD-OUT
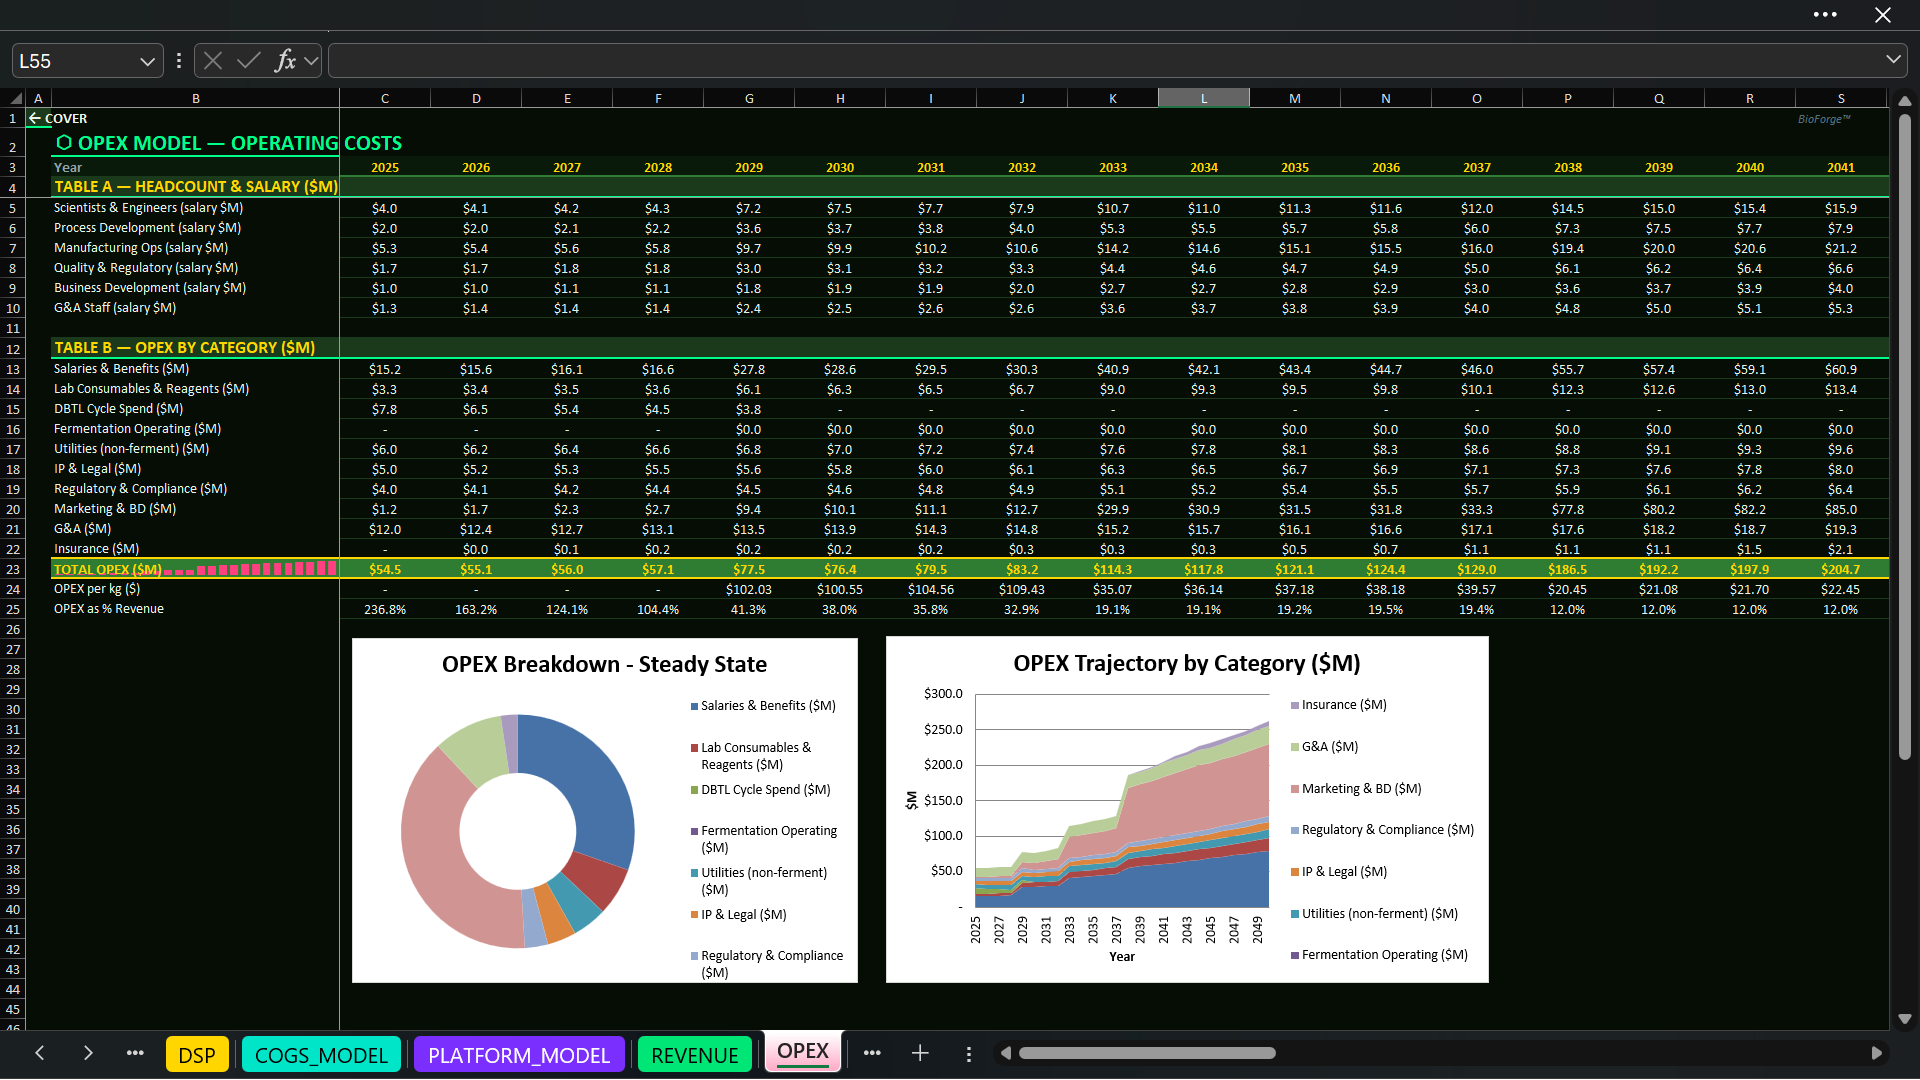
OPEX models headcount and fully loaded salaries for scientists and engineers, process development, manufacturing operations, quality and regulatory personnel, business development, and G&A. It also includes laboratory consumables, DBTL spend, fermentation costs, utilities, IP and legal, regulatory and compliance, marketing, corporate overhead, and insurance.
🏦 FINANCING, DEBT, AND WORKING CAPITAL
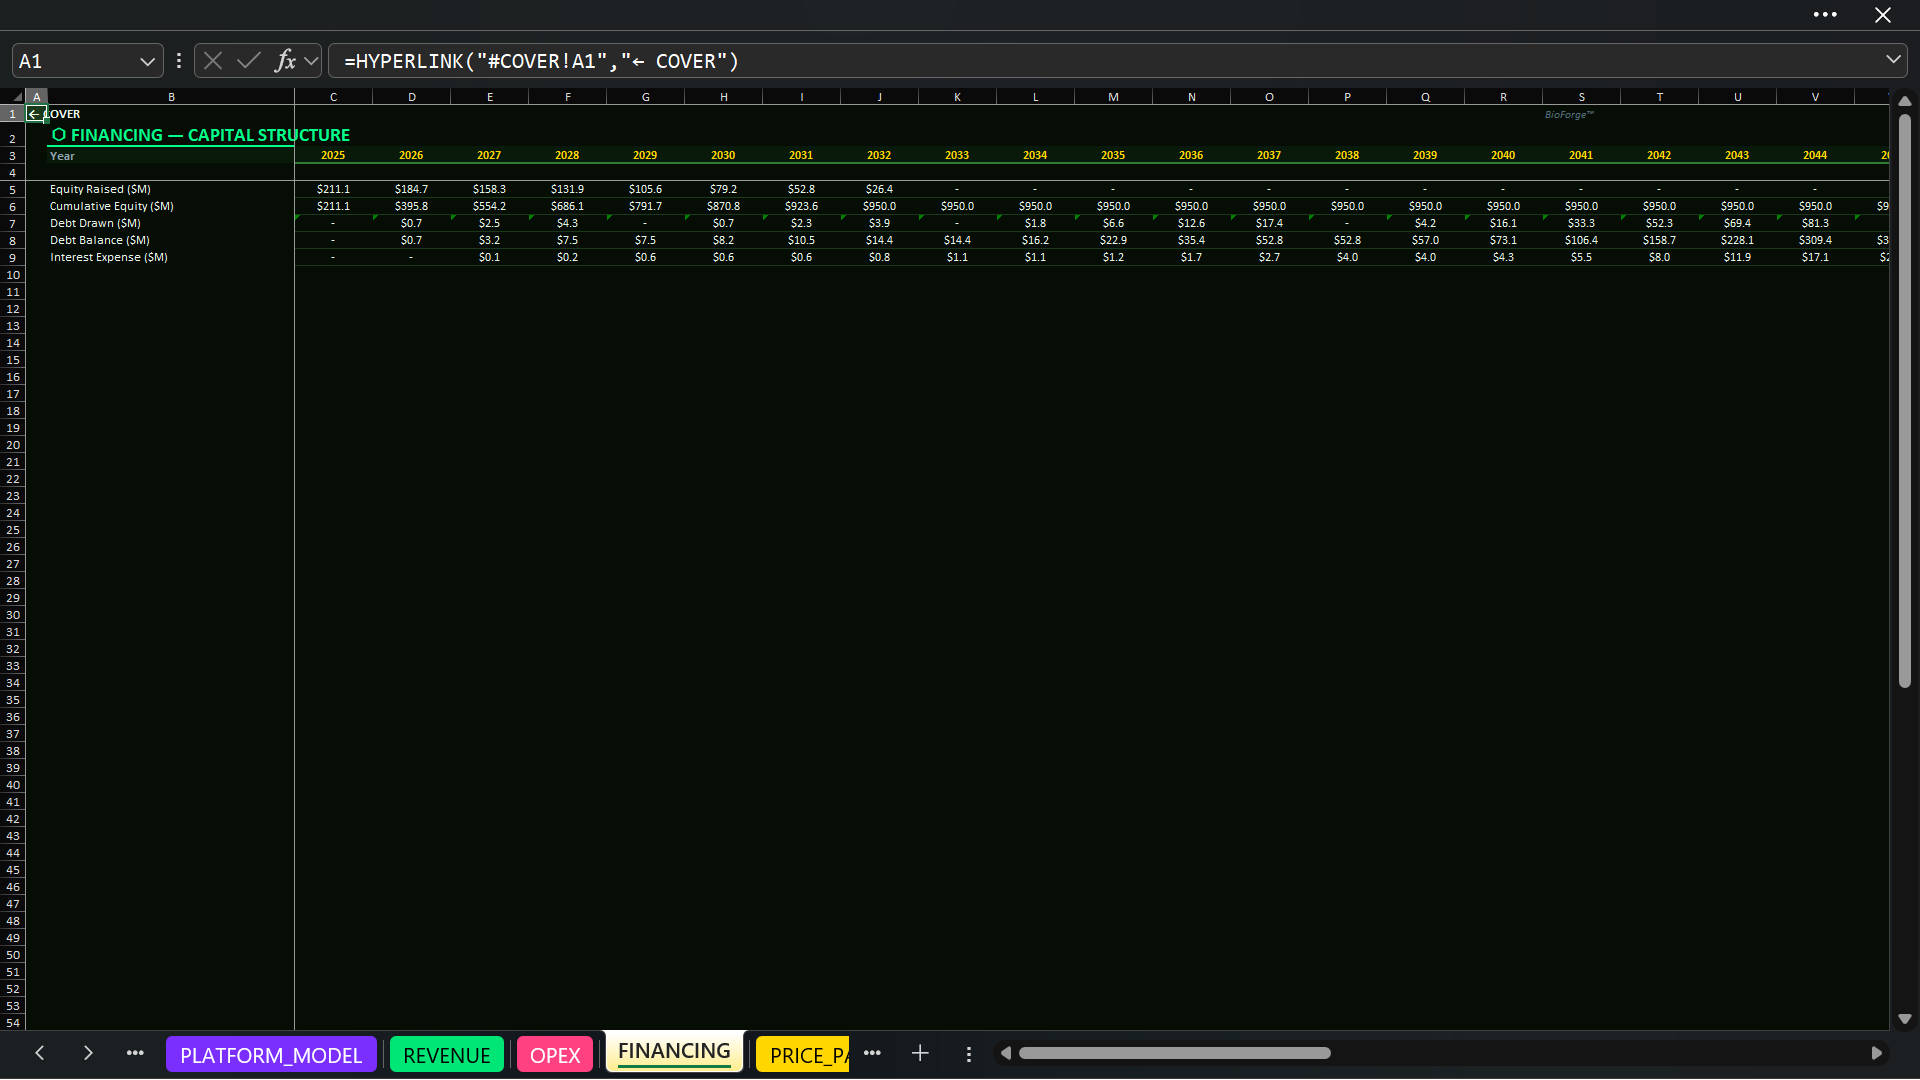
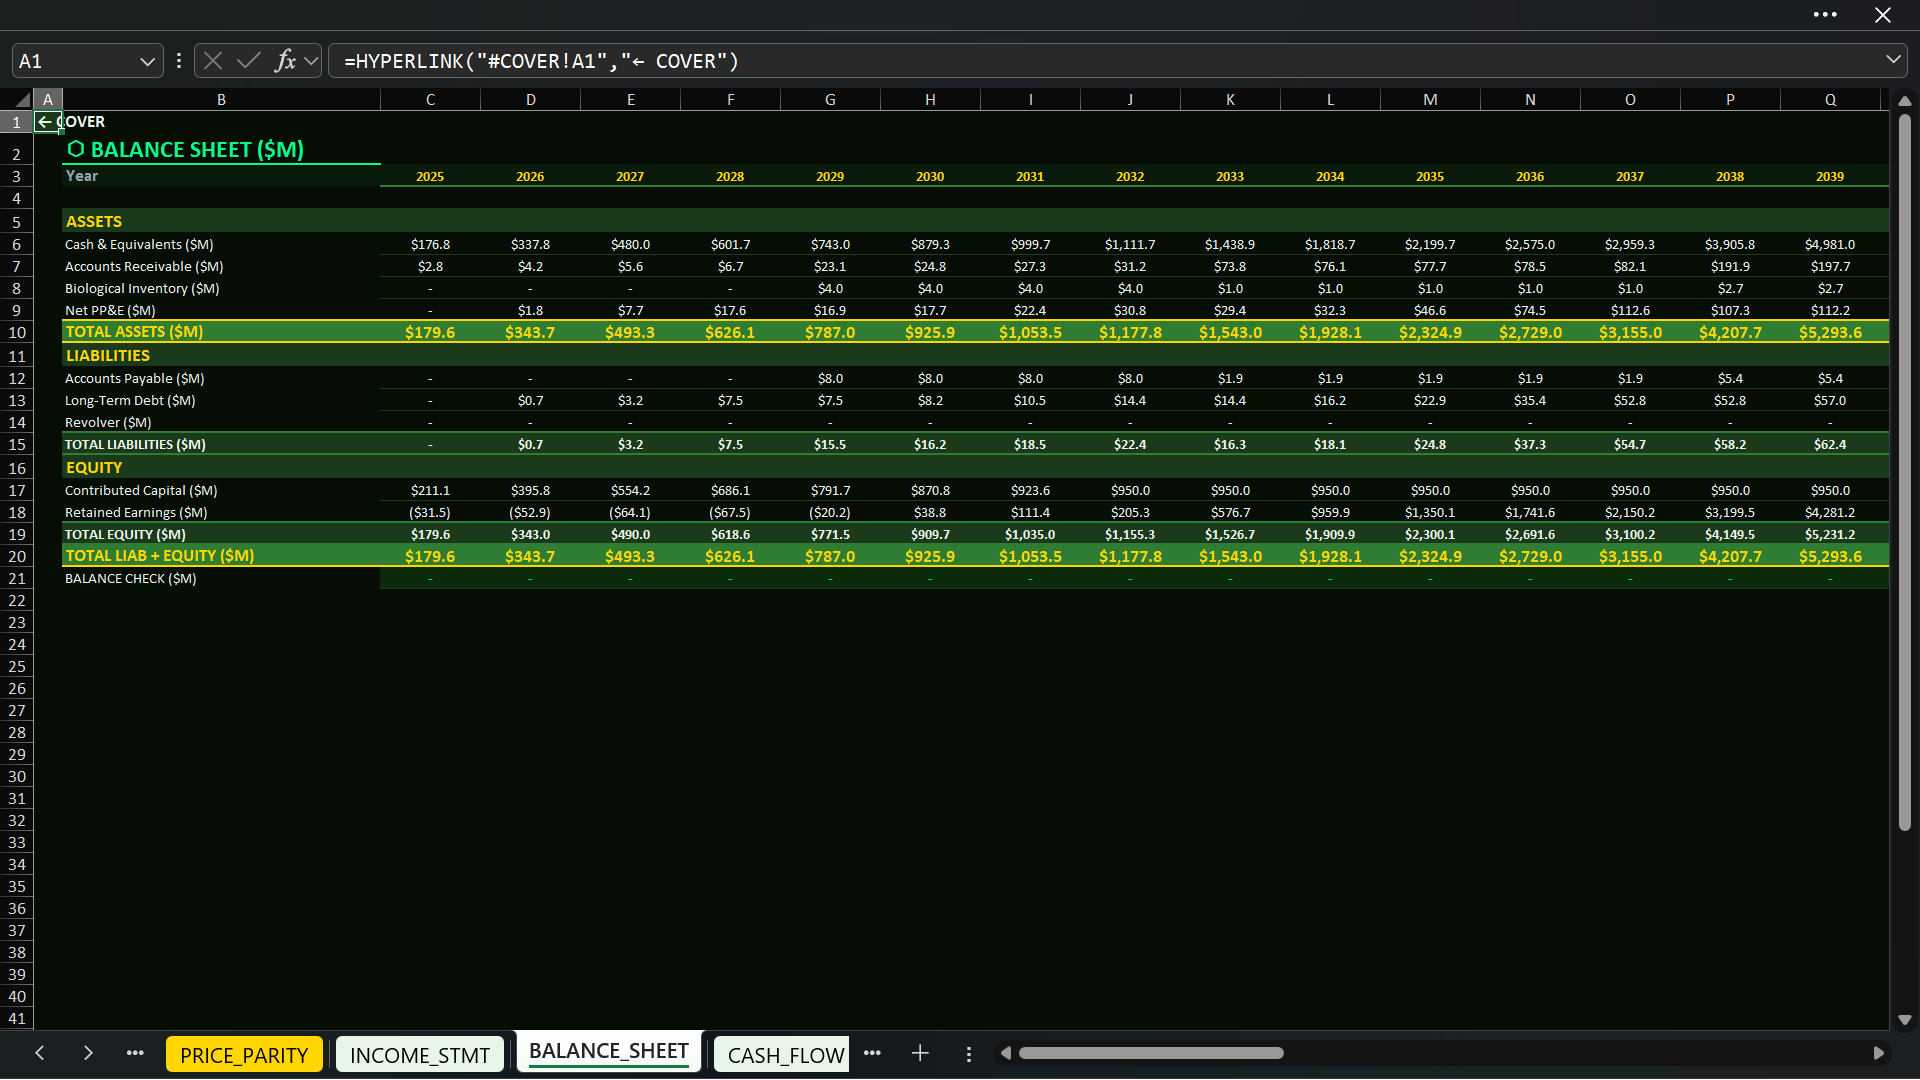
FINANCING calculates annual equity raises, cumulative equity, debt draws, debt balances, and interest. Debt capacity is linked to net PP&E. Working-capital assumptions cover receivable days, payable days, biological-inventory days, and minimum cash.
These mechanics feed the Balance Sheet and Cash Flow Statement, showing capital timing, debt development, and liquidity.
📊 LINKED THREE FINANCIAL STATEMENTS
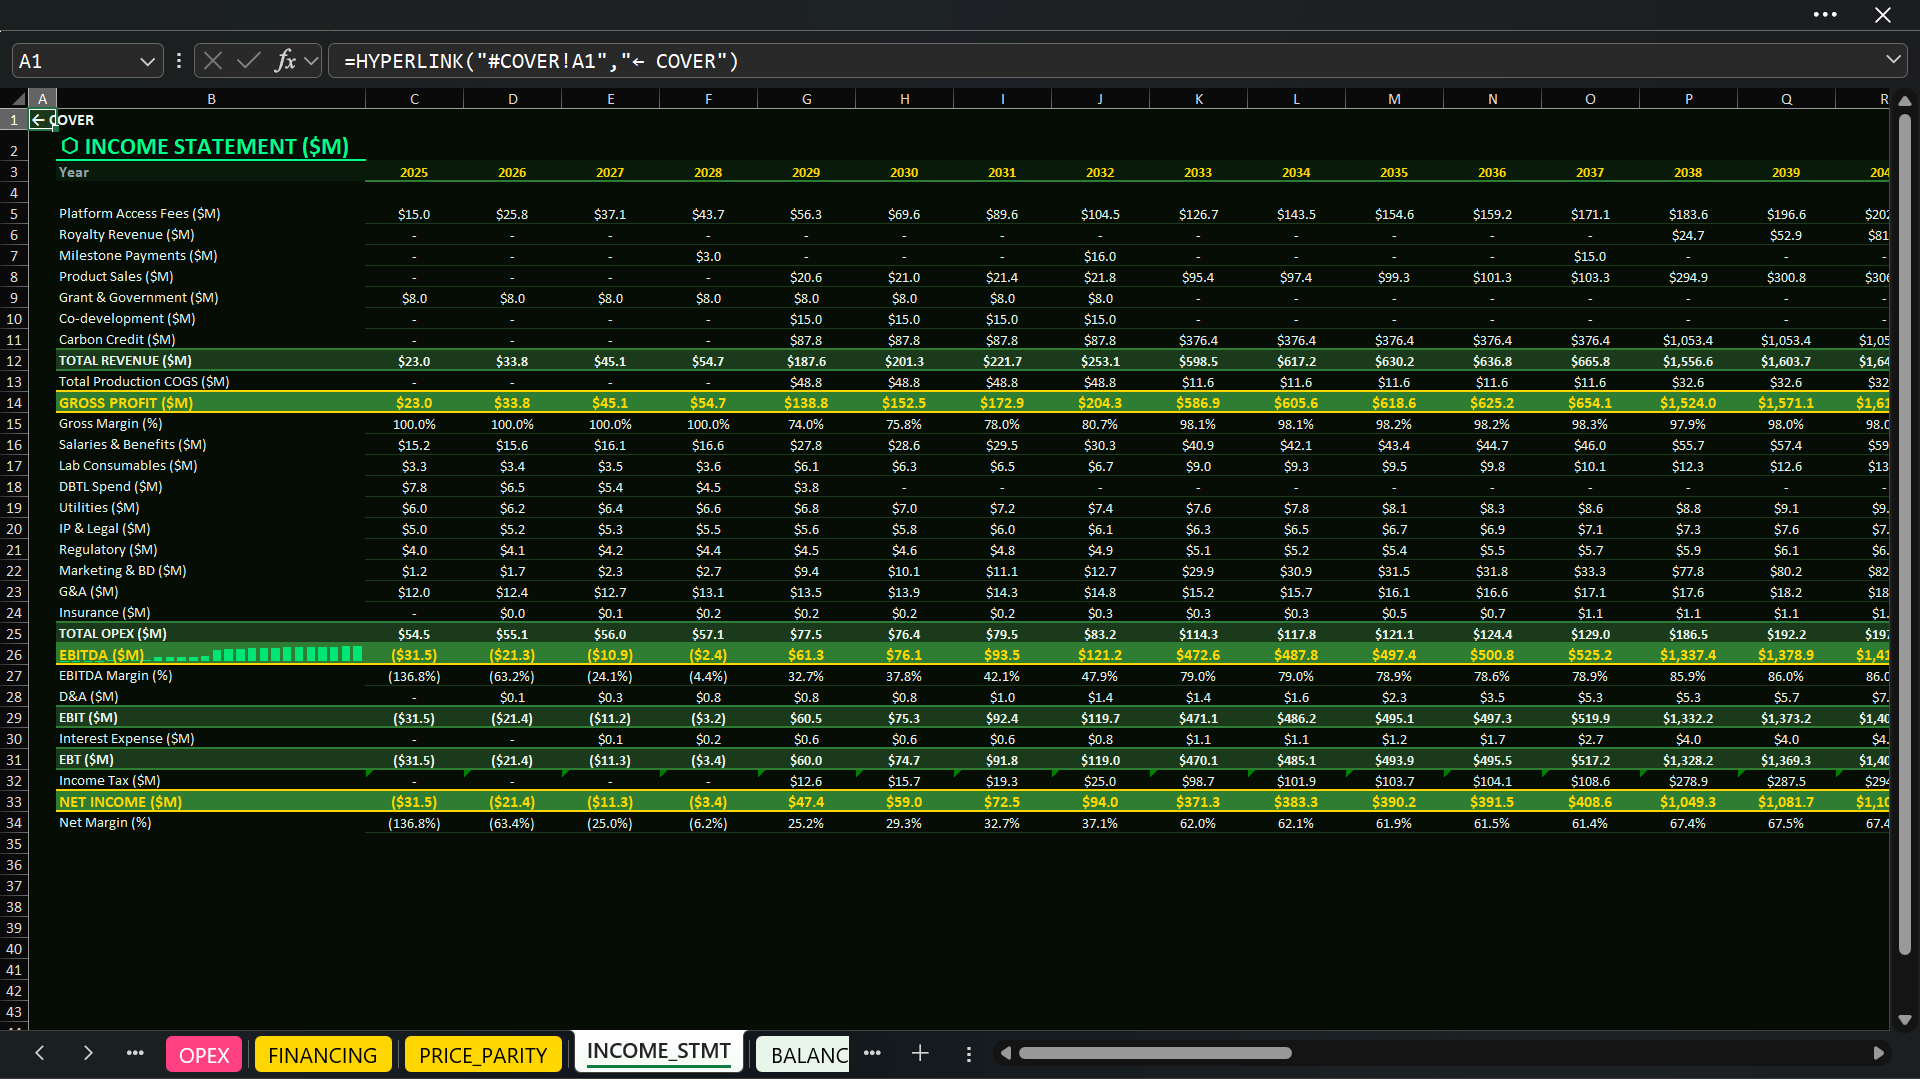
The workbook includes linked Income Statement, Balance Sheet, and Cash Flow modules through 2050.
• Income Statement — revenue streams, COGS, gross profit, OPEX, EBITDA, EBIT, interest, taxes, net income, and margins.
• Balance Sheet — cash, receivables, biological inventory, net PP&E, payables, debt, contributed capital, retained earnings, and balance check.
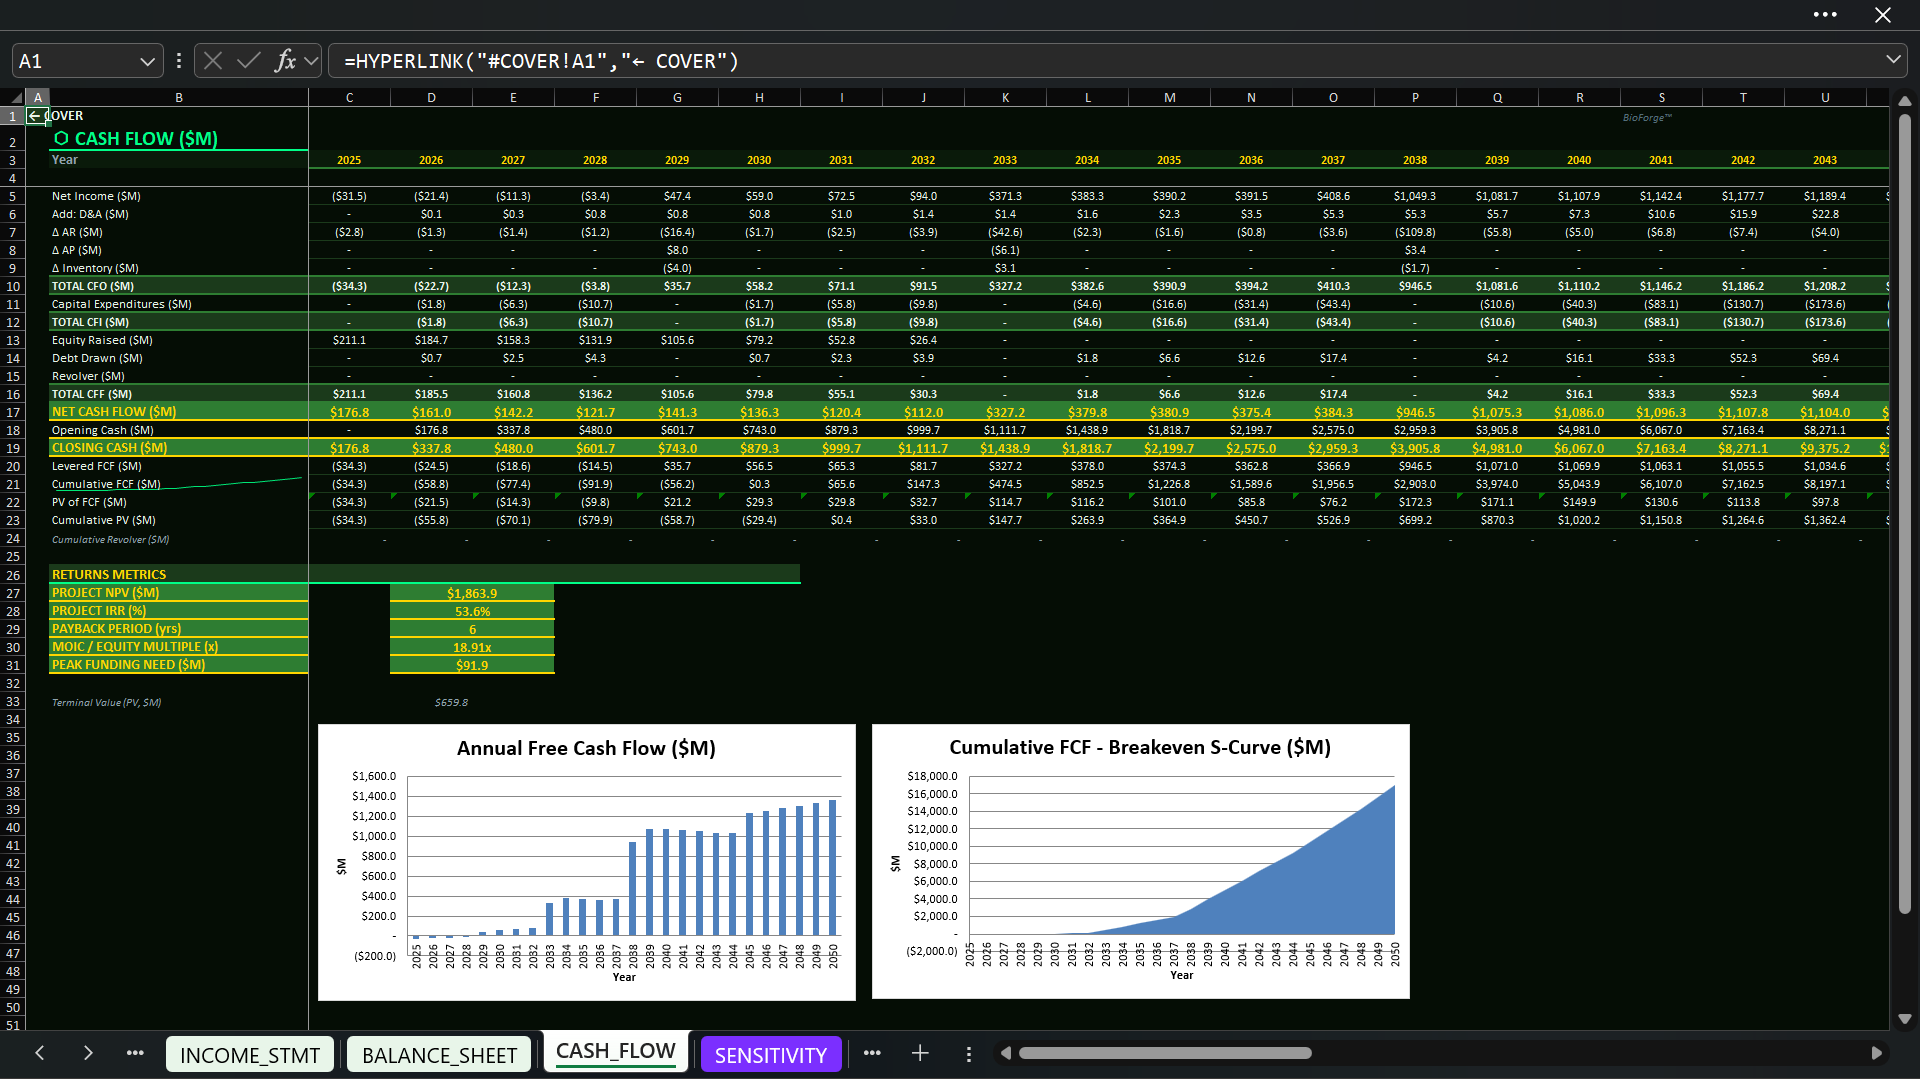
• Cash Flow — CFO, CFI, CFF, annual and cumulative free cash flow, opening and closing cash, PV of cash flow, and cumulative discounted performance.
Because the statements are linked, changes in technical and commercial assumptions flow through profitability, assets, liabilities, funding, liquidity, and returns.
📈 VALUATION AND INVESTMENT RETURNS
The model calculates project NPV, IRR, MOIC/equity multiple, payback status, peak funding need, PV of free cash flow, and terminal value. These outputs support investment screening, business planning, fundraising, and comparison of commercialization strategies.
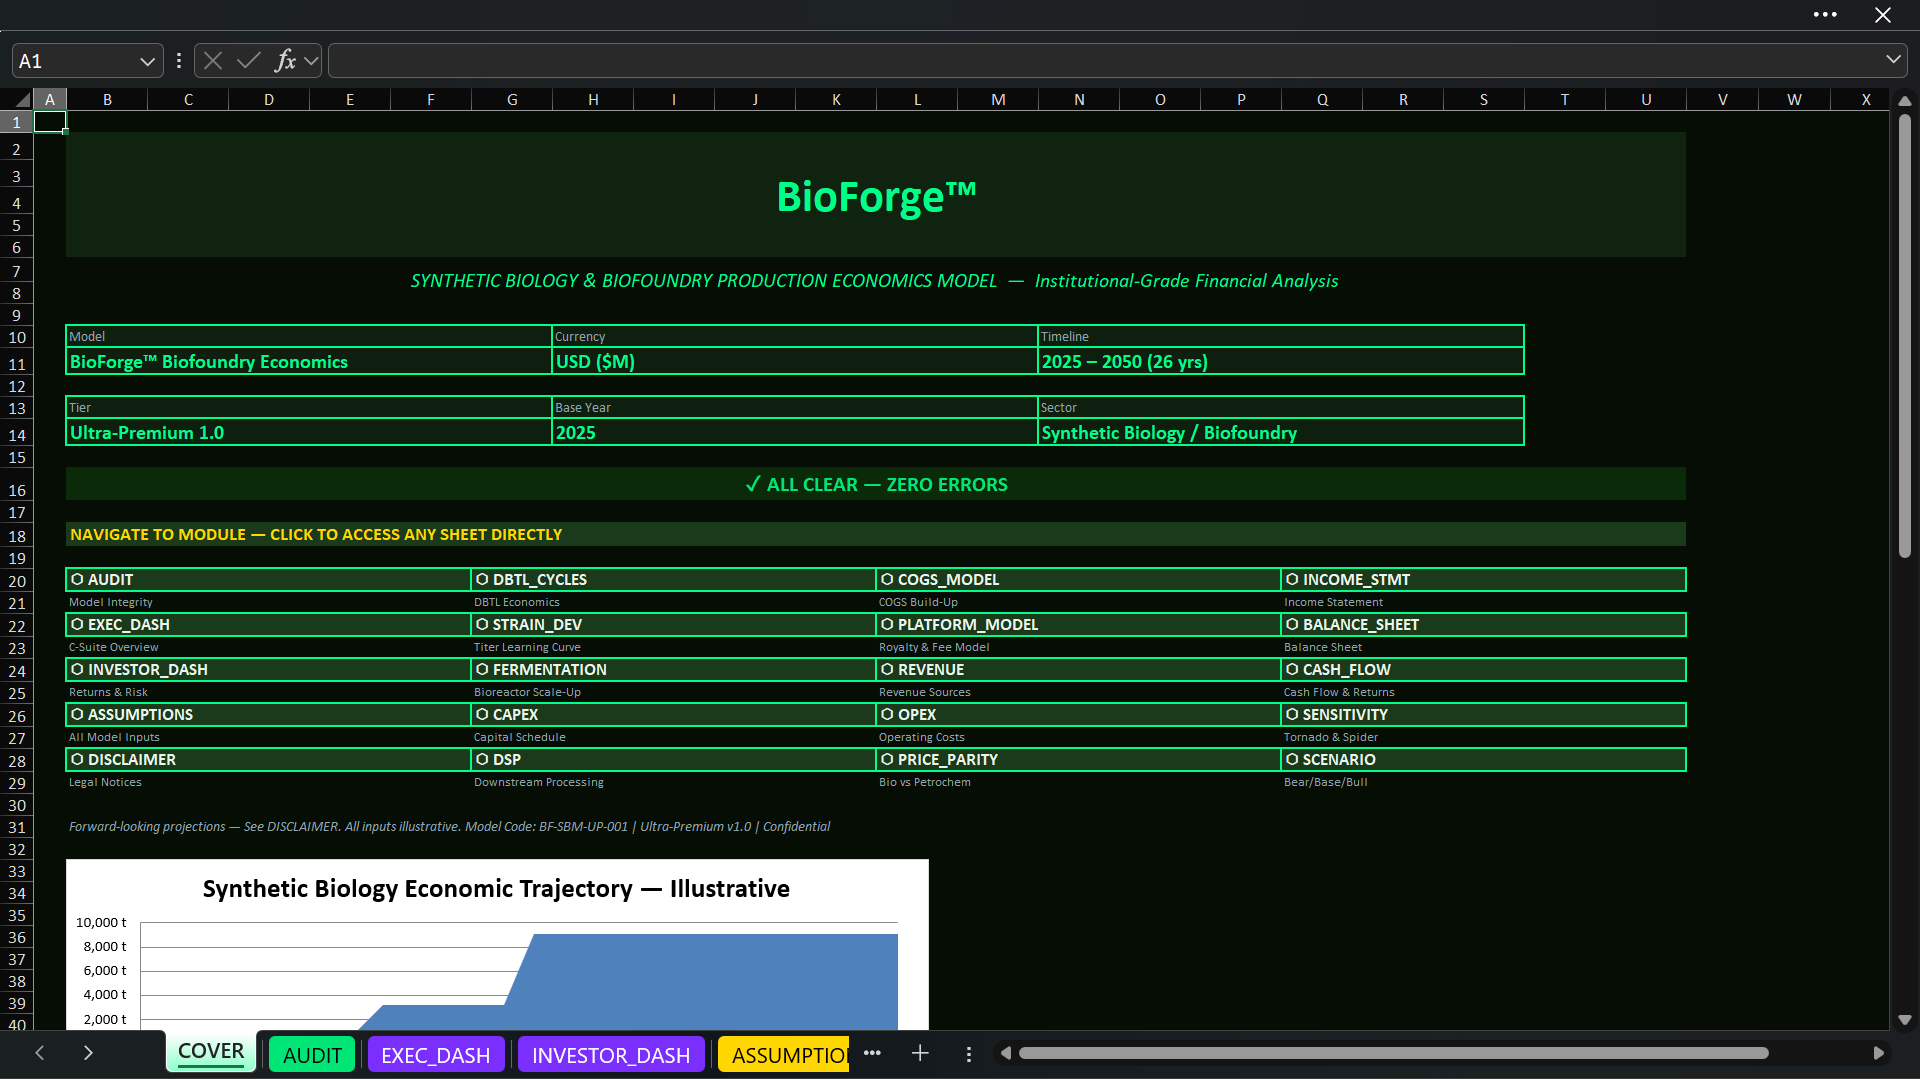
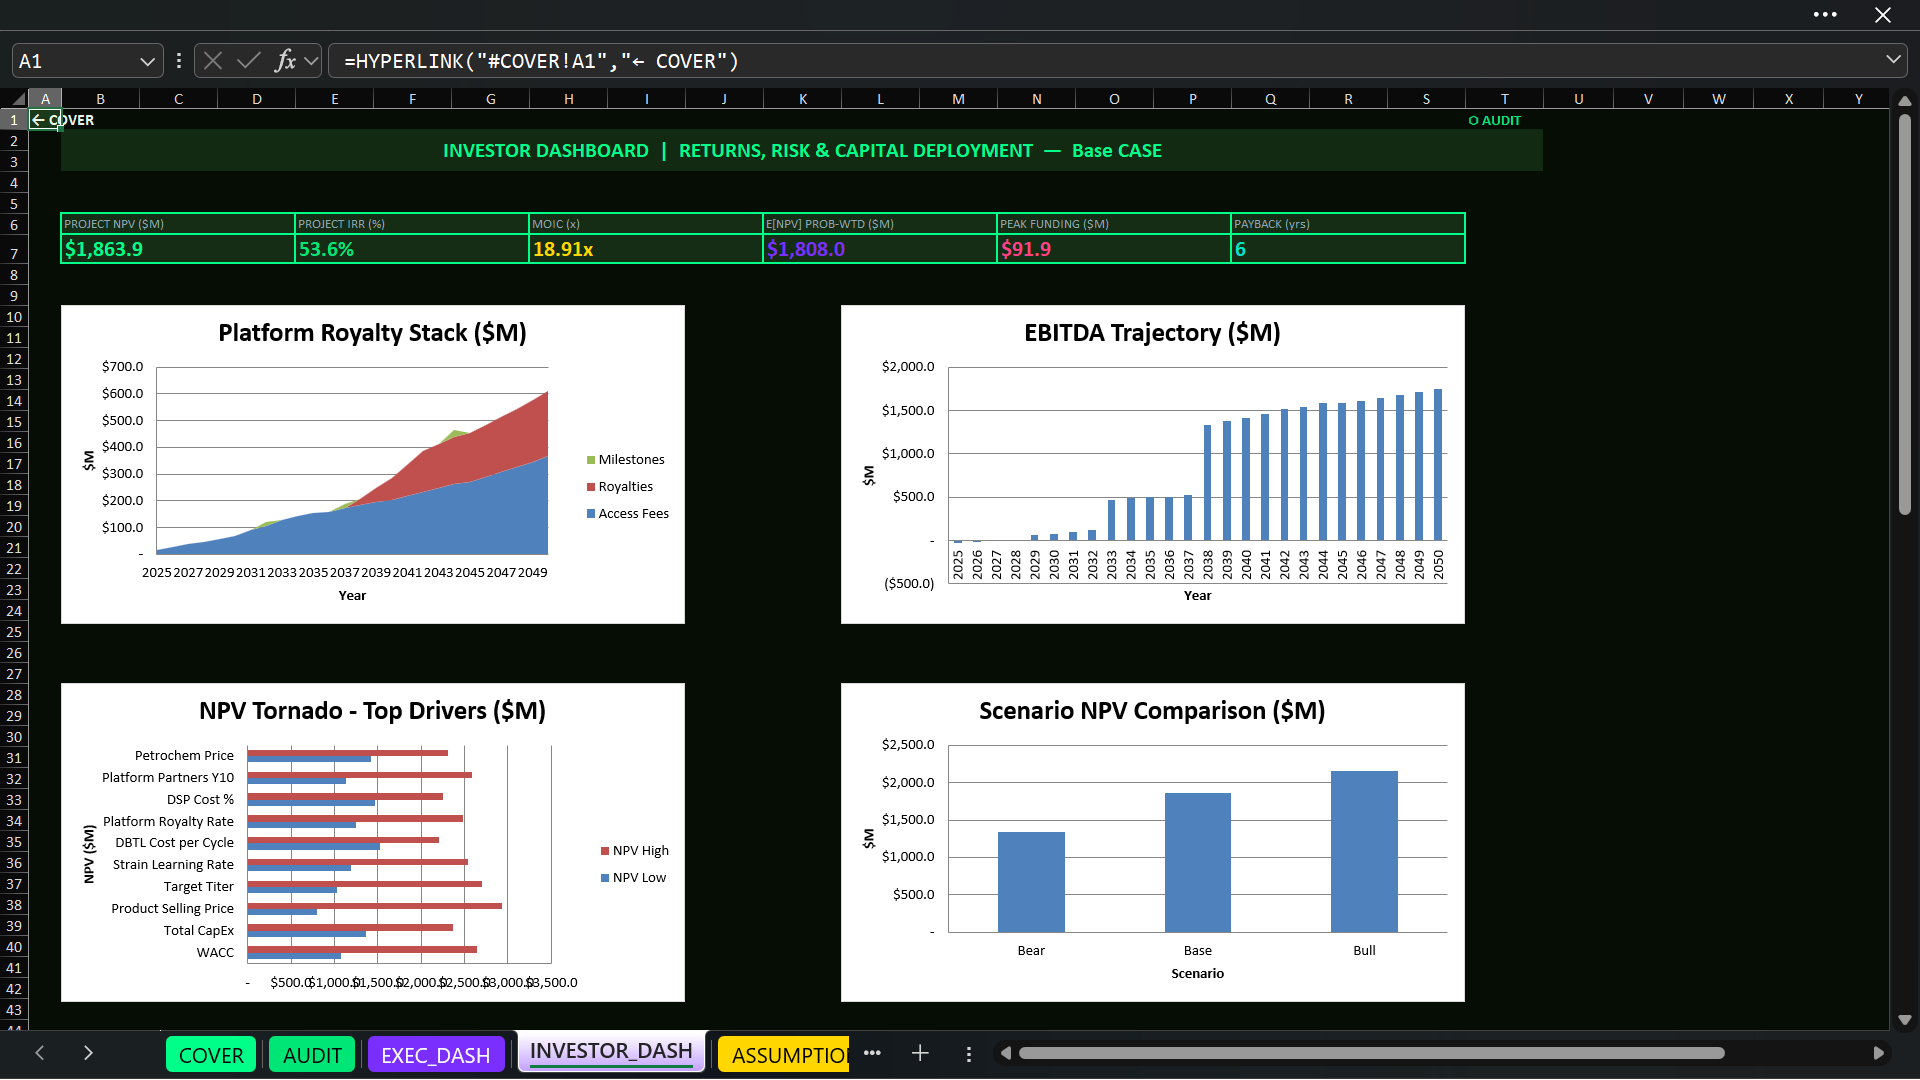
Executive and Investor Dashboards summarize key technical, operating, financial, and return outputs. The workbook includes 38 native Excel charts, allowing users to present cost, capacity, revenue, funding, and risk without rebuilding visuals.
📉 BEAR, BASE, AND BULL SCENARIOS
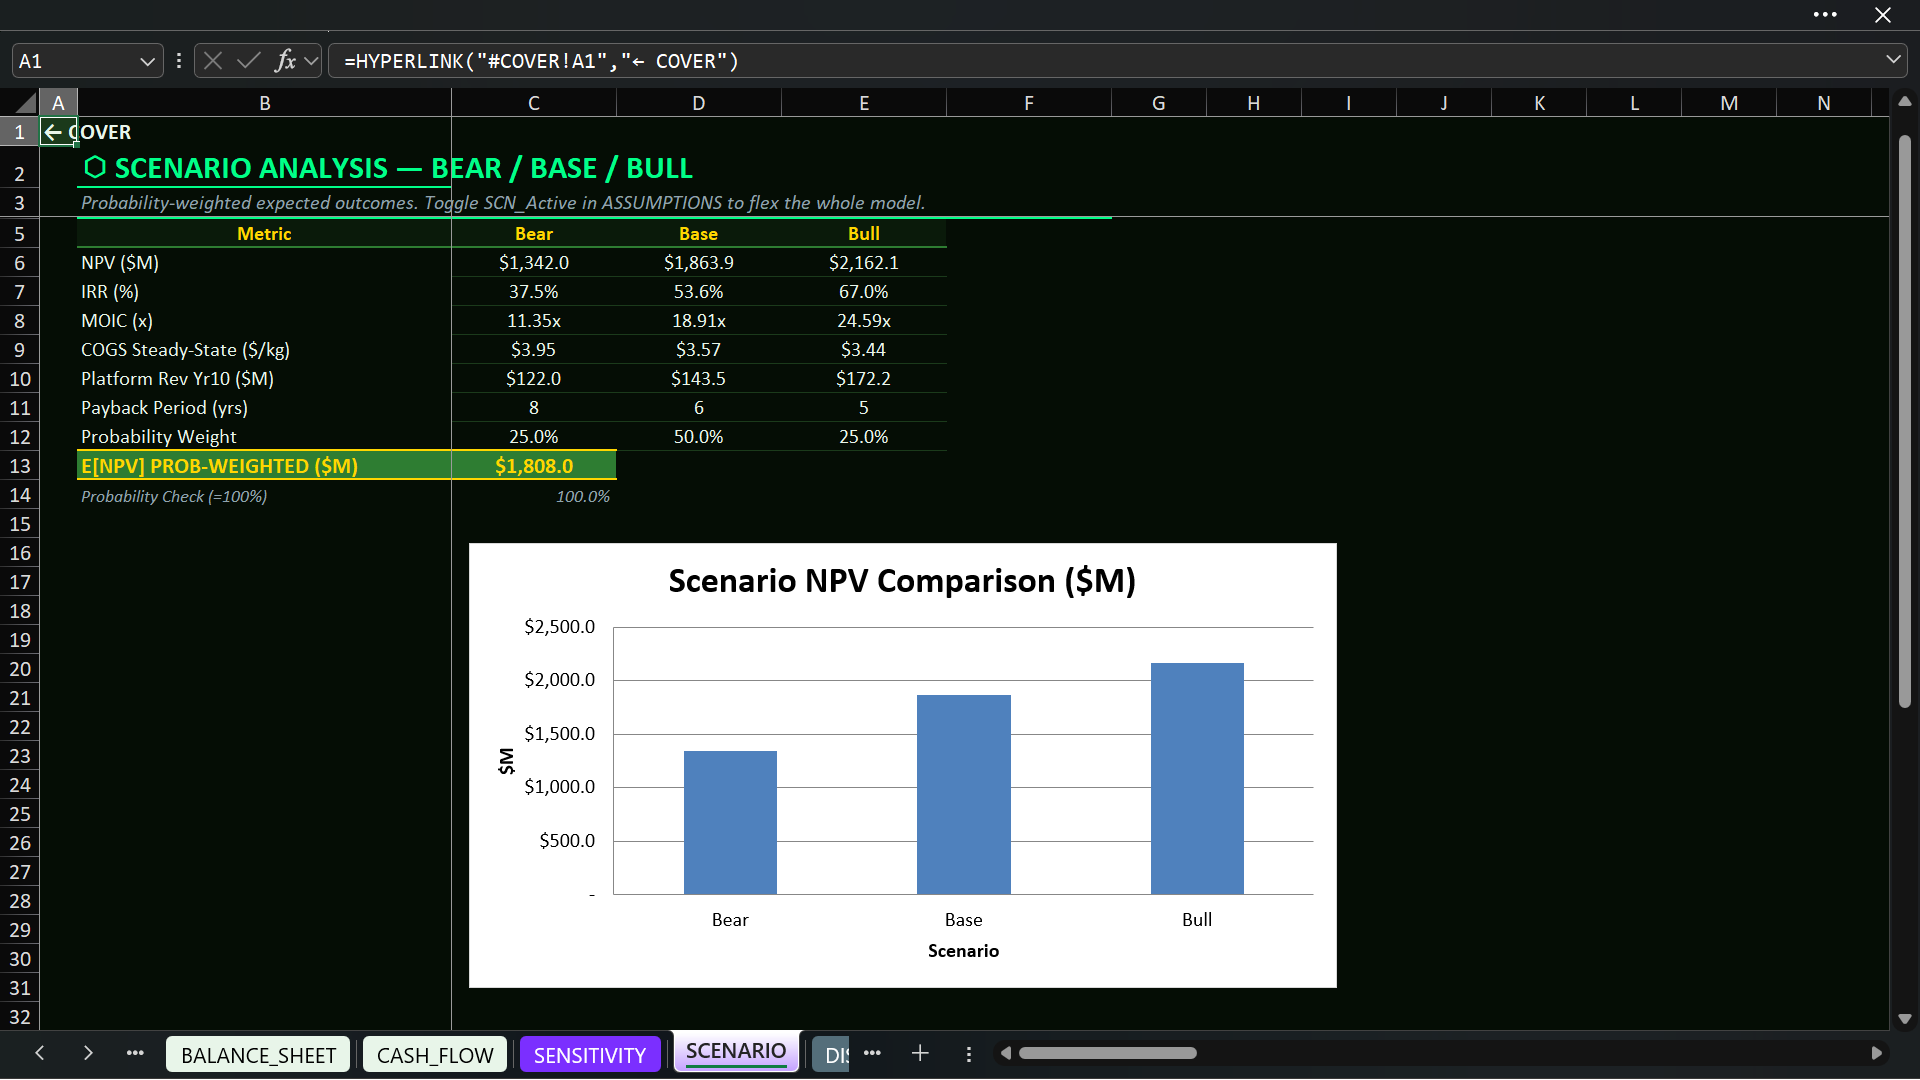
Scenario controls adjust technical timing, CapEx, and pricing. SCENARIO compares NPV, IRR, MOIC, steady-state COGS, platform revenue, and payback across Bear, Base, and Bull cases. Users can assign probabilities, and the workbook calculates a probability-weighted expected NPV.
🌪️ SENSITIVITY AND KEY-RISK ANALYSIS
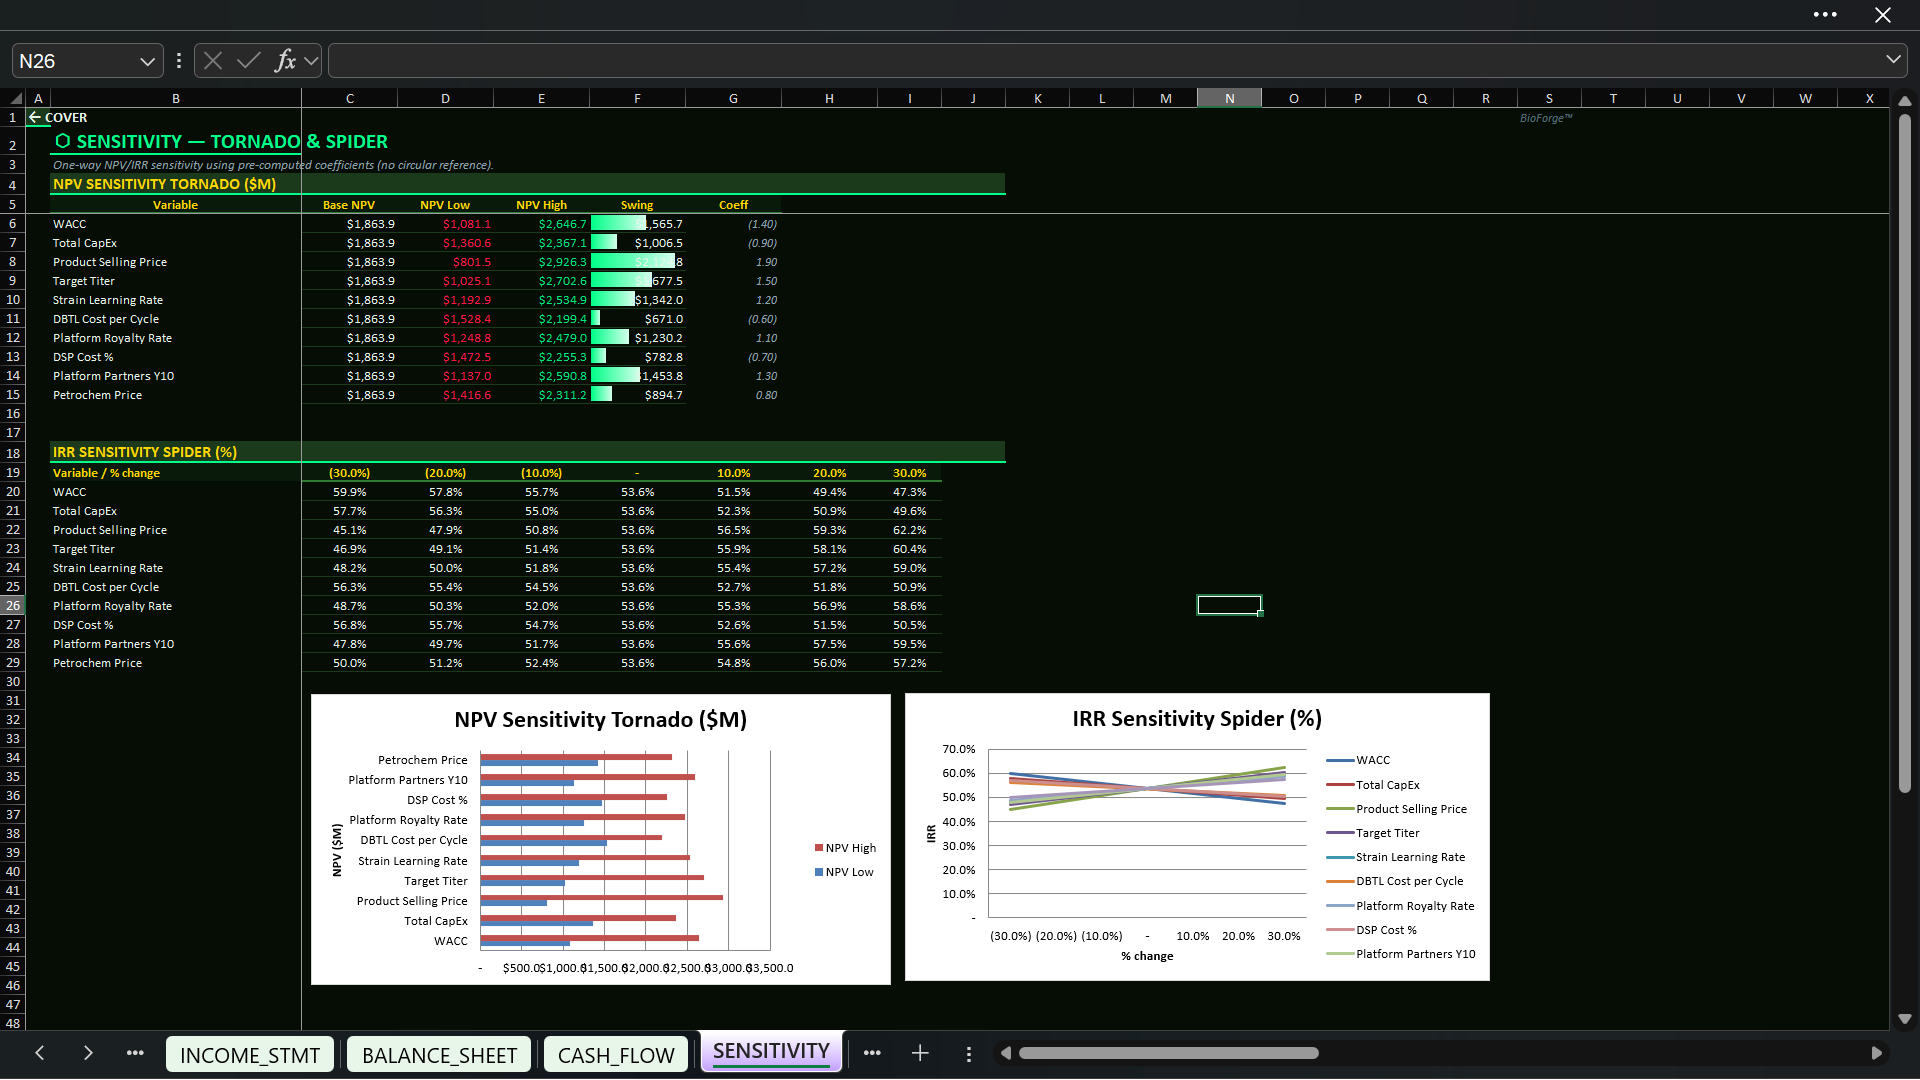
SENSITIVITY provides one-way coefficient-based NPV and IRR views for WACC, total CapEx, selling price, target titer, strain learning, DBTL cost, royalty rate, DSP cost, platform partners, and petrochemical price.
Tornado and spider charts identify the assumptions with the greatest modeled effect on returns, helping teams focus diligence on the inputs that matter most.
⚖️ BIO-BASED VS PETROCHEMICAL PRICE PARITY
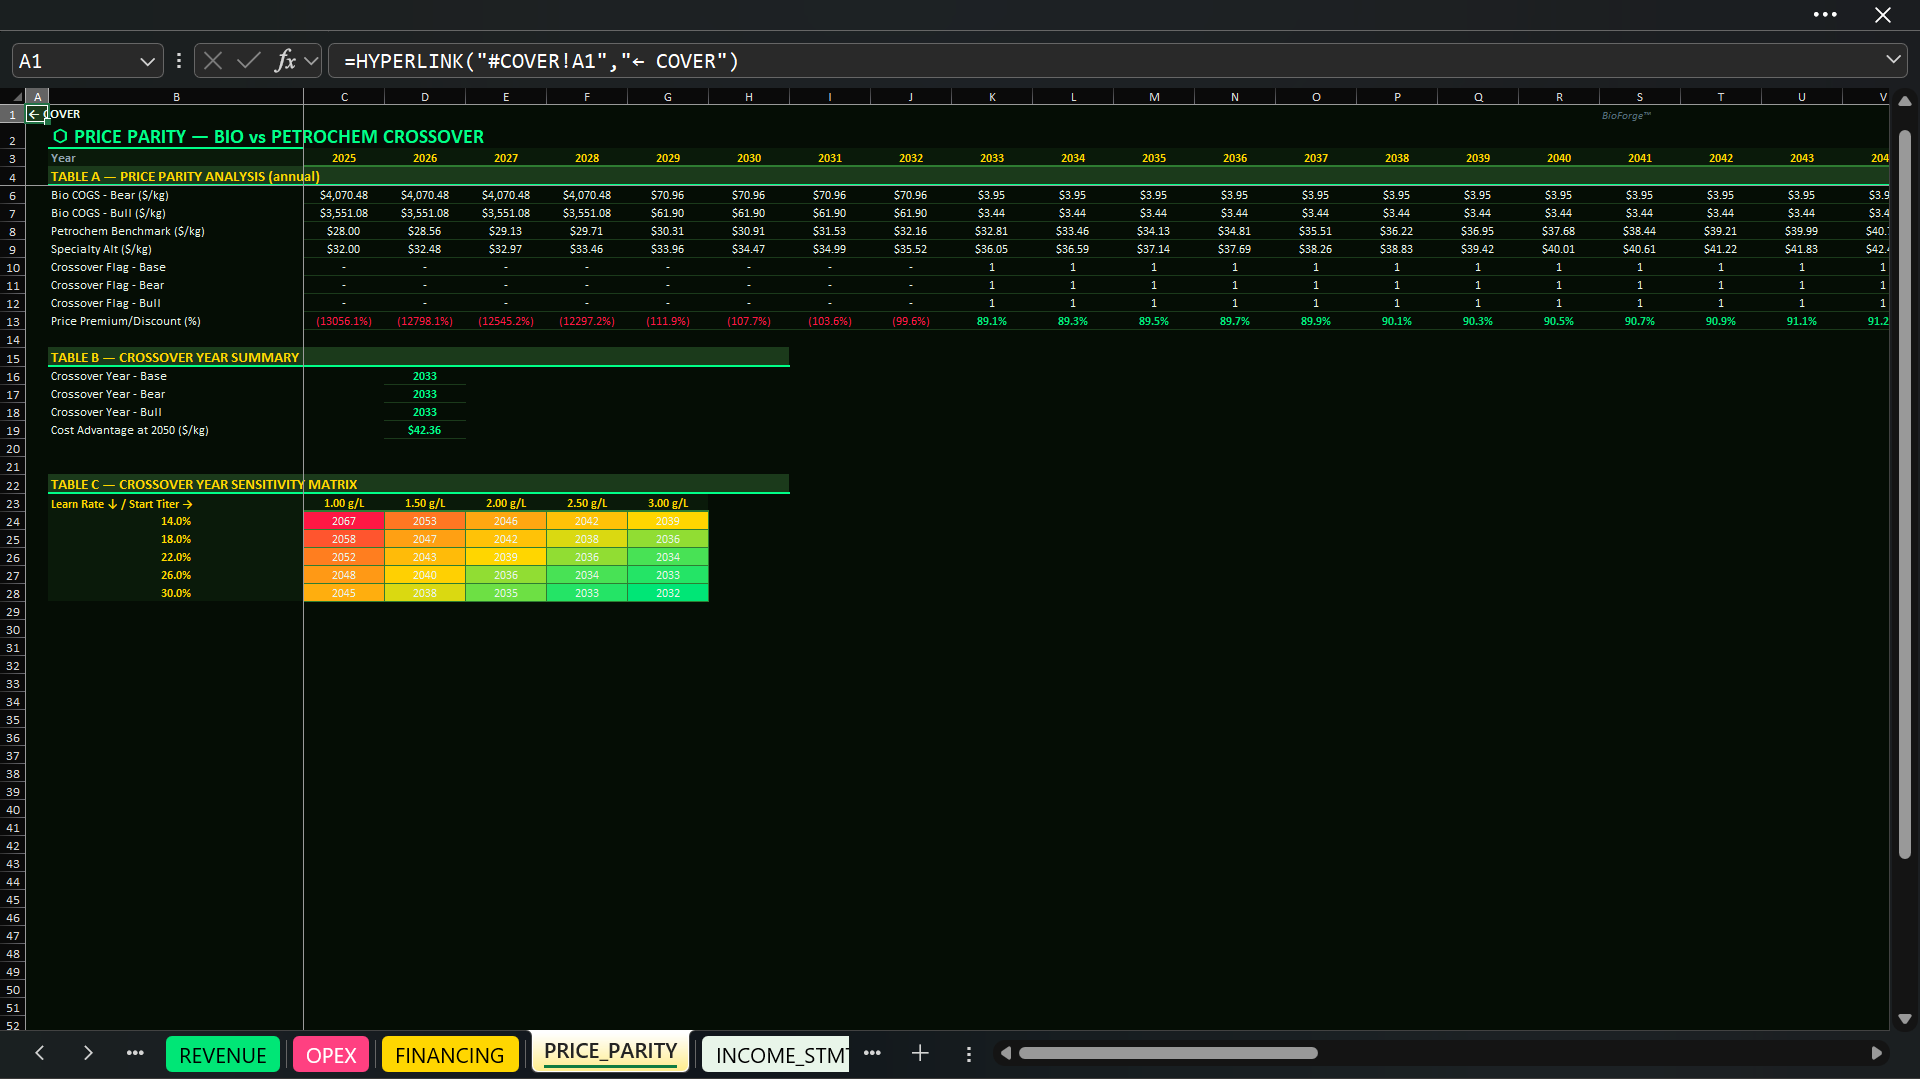
PRICE_PARITY compares Base, Bear, and Bull bio-based COGS with petrochemical and specialty-chemical benchmarks. It includes annual crossover flags, crossover-year summaries, cost-advantage analysis, and a starting-titer/learning-rate matrix.
Users can assess how quickly—if at all—the modeled process could become cost competitive. The crossover output is illustrative and is not a guaranteed commercial date.
✅ BUILT FOR REVIEW, TRACEABILITY, AND PRESENTATION
• 22 purpose-built worksheets with logical navigation.
• 26 annual periods from 2025 through 2050.
• Centralized editable assumptions and 148 workbook-level defined names.
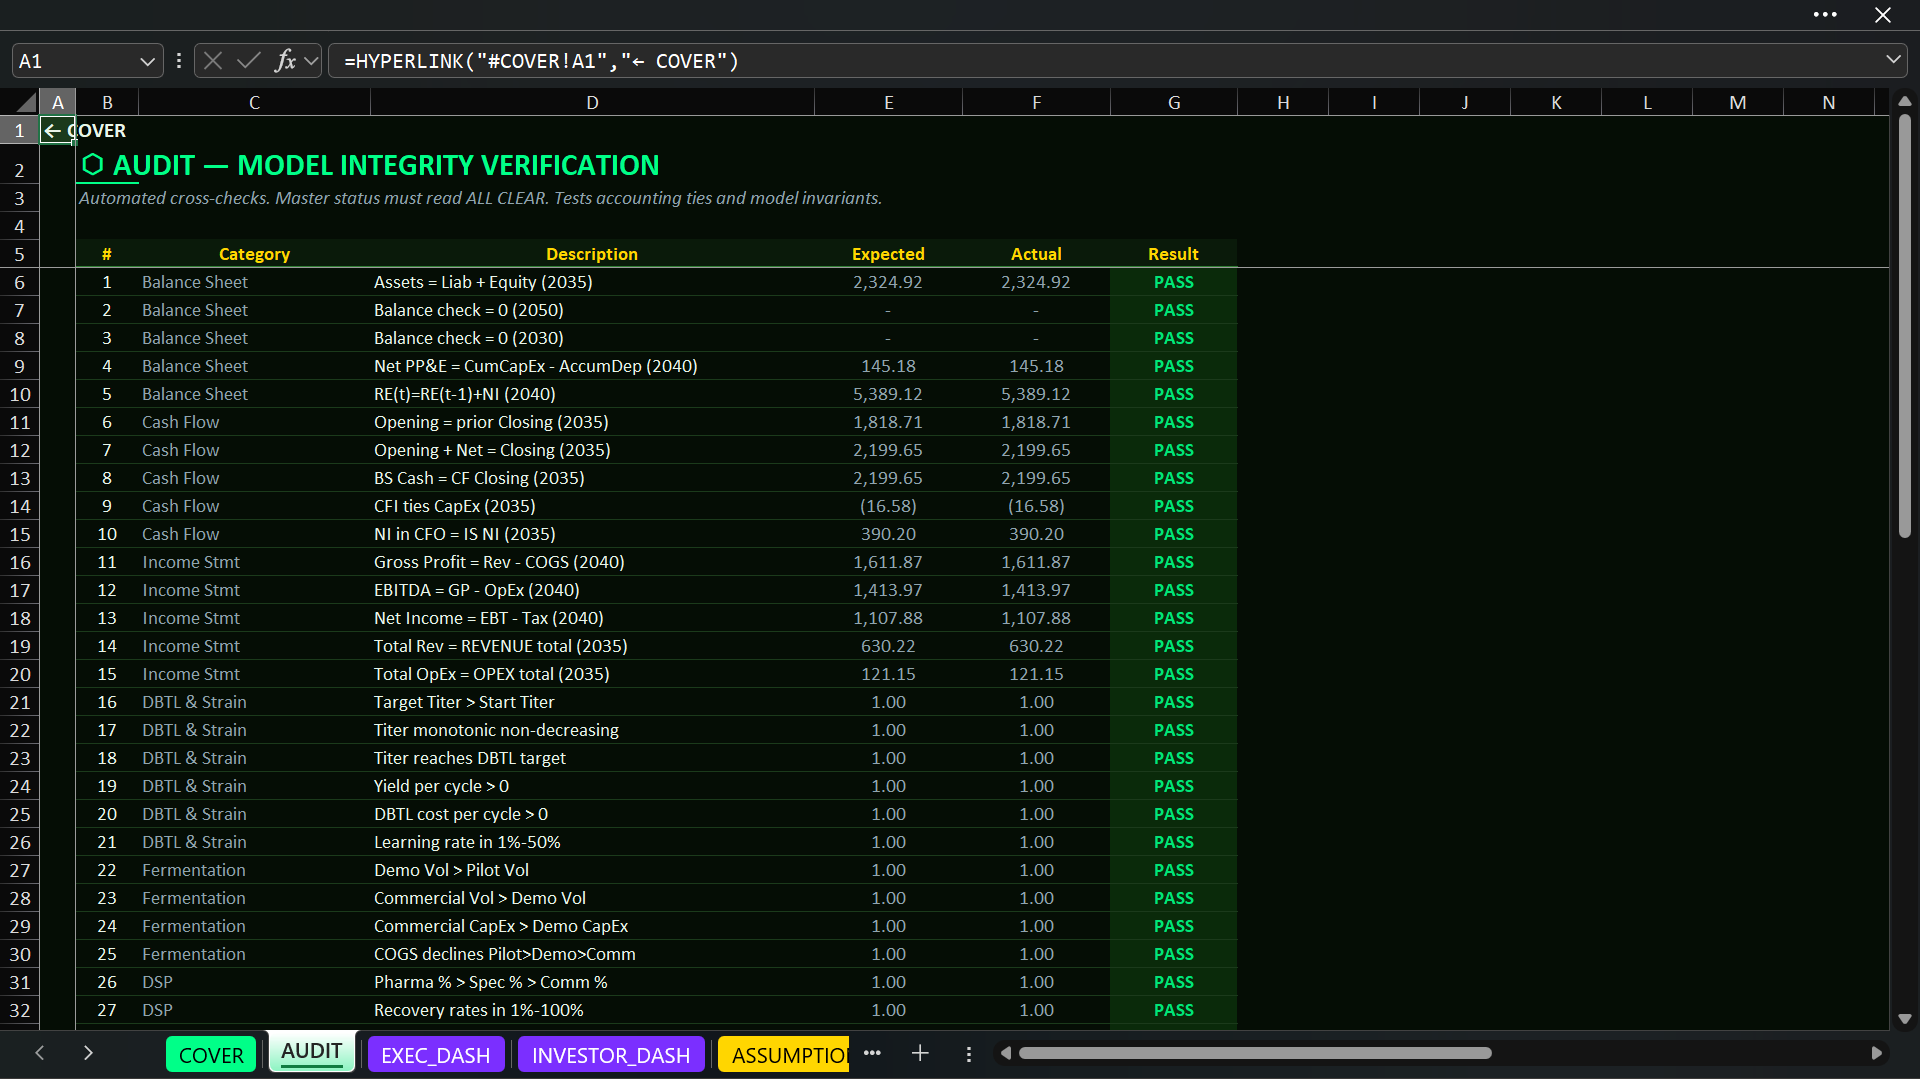
• 38 integrity checks covering accounting ties, roll-forwards, input bounds, technical relationships, scenario probabilities, and returns.
• 38 native Excel charts for dashboards, trends, scale-up analysis, sensitivities, and comparisons.
• Executive and Investor Dashboards for different audiences.
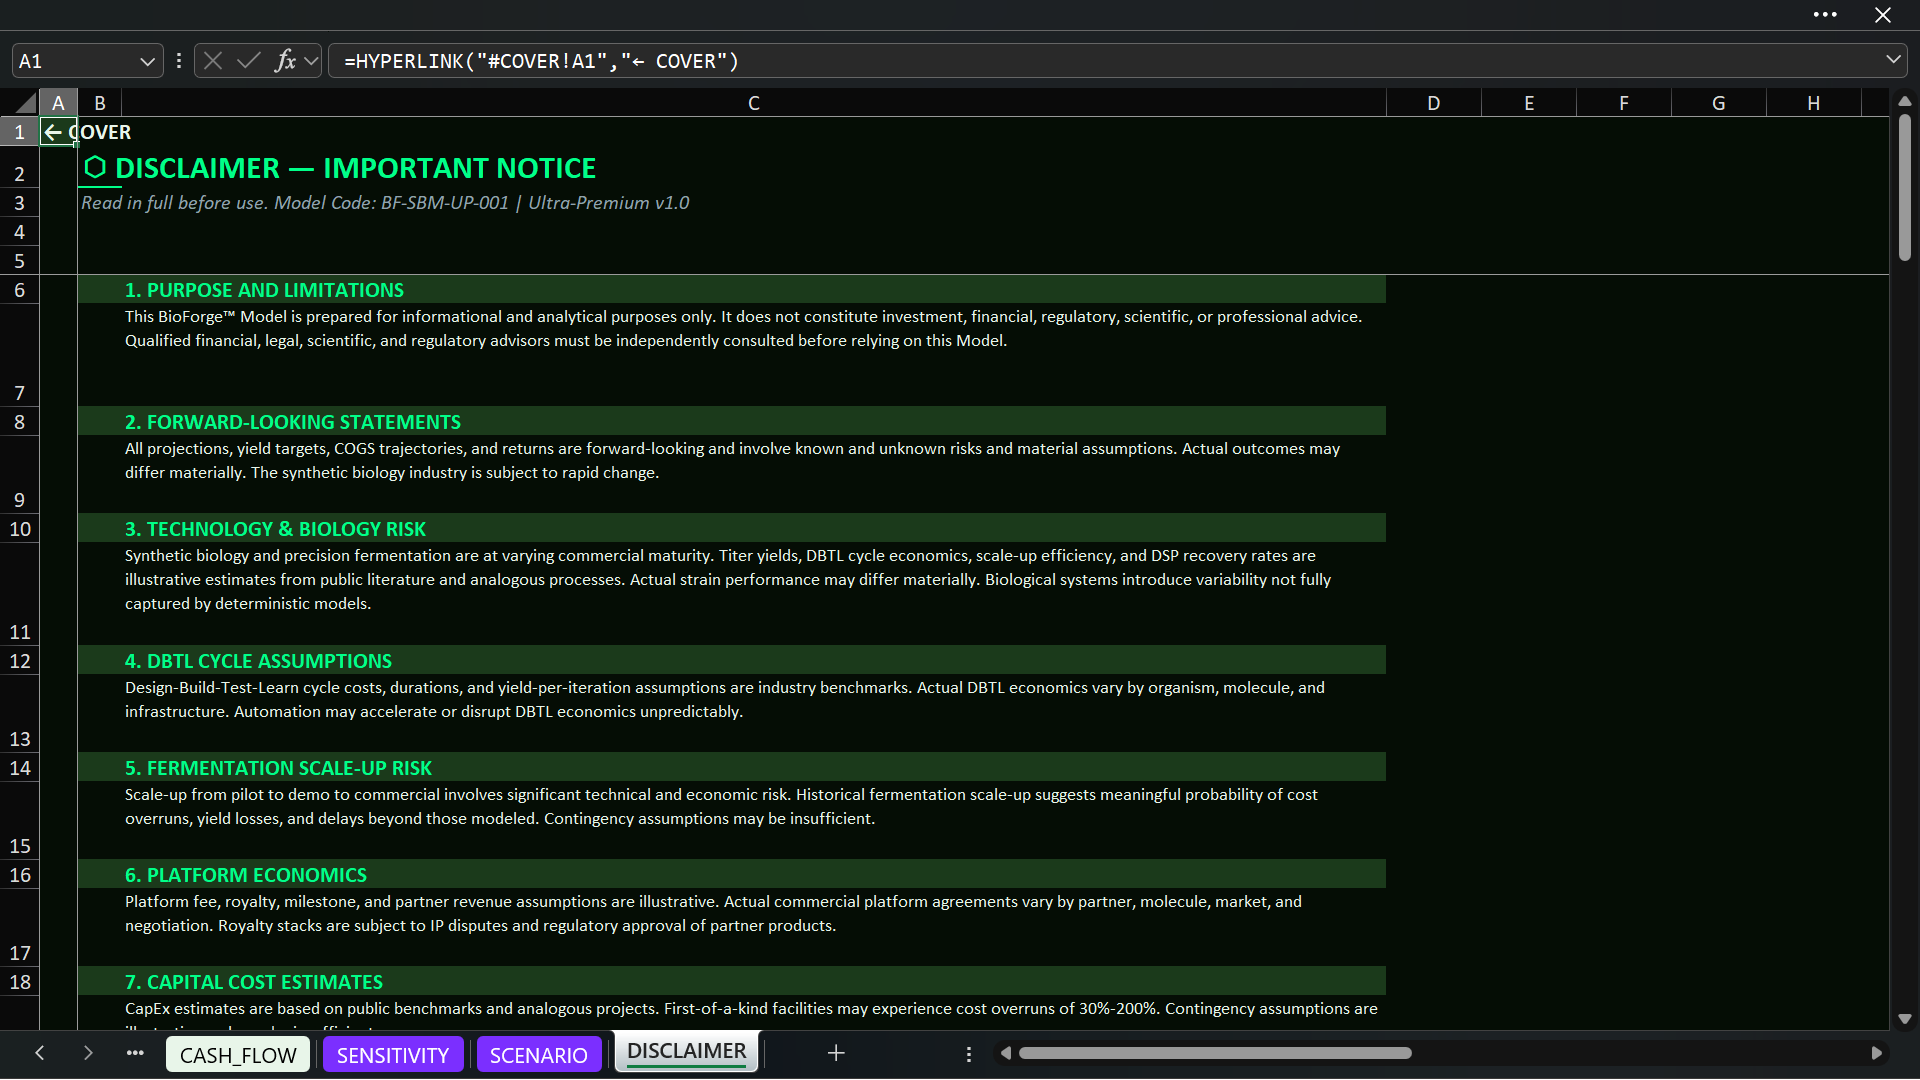
• Dedicated DISCLAIMER section explaining model purpose, limitations, and key risks.
• No macros and no external-workbook links identified, supporting easier review and distribution.
🚀 HOW TO USE THE MODEL
- Save an untouched copy of the workbook.
- Open ASSUMPTIONS and update only the designated input cells.
- Select Platform, Vertical, or Hybrid; choose the product, purity profile, and active scenario.
- Replace every illustrative technical, commercial, operating, carbon-credit, financing, and working-capital assumption with verified project evidence.
- Review DBTL_CYCLES and STRAIN_DEV to confirm development timing and titer progression.
- Review FERMENTATION, DSP, COGS_MODEL, and CAPEX to validate scale-up, recovery, capacity, unit costs, and facility assumptions.
- Review REVENUE, OPEX, FINANCING, and the three statements to confirm commercial and funding logic.
- Examine dashboards, valuation, scenarios, sensitivities, and price parity to understand potential returns and risks.
- Confirm AUDIT reports all checks clear before using outputs in a board, investor, lender, management, or transaction discussion.
• Synthetic-biology and precision-fermentation founders, CFOs, and strategy teams.
• Biofoundry, industrial-biotechnology, and bio-based manufacturing operators.
• Venture capital, growth equity, corporate venture, and project-finance investors.
• Consultants, transaction advisers, feasibility professionals, and financial modelers.
• Licensing, business-development, and strategic-partnership teams.
• Technical leaders translating laboratory and scale-up assumptions into financial consequences.
• Management teams comparing internal manufacturing, partnerships, or a Hybrid strategy.
This Best Practice includes
1 Fully Editable Premium Excel Model
Further information
Translate DBTL, strain-development, and scale-up assumptions into financial outcomes.
Quantify pilot, demonstration, and commercial fermentation capacity and cost per kilogram.
Build and phase laboratory, pilot, demo, DSP, utility, and commercial CapEx requirements.
Compare platform, vertical, and hybrid revenue strategies within one integrated model.
Forecast three financial statements, cash flow, funding needs, and investment returns through 2050.
Test risk through Bear/Base/Bull scenarios, probability weighting, sensitivities, and price-parity analysis.
Planning a synthetic-biology, biofoundry, precision-fermentation, or bio-based manufacturing venture.
Preparing an investor, board, lender, or management business case that must connect technical progress to financial results.
Comparing platform licensing economics with owned production or a hybrid strategy.
Evaluating pilot-to-commercial scale-up, DSP, COGS, FOAK CapEx, and funding requirements.
Running structured scenario, sensitivity, price-parity, valuation, and return analysis with project-specific assumptions.
A laboratory protocol, molecular design tool, metabolic simulation, or detailed engineering package is required.
The user needs molecule-specific clinical-development probabilities, regulatory submissions, or therapeutic trial modeling without further customization.
The user expects reliable outputs without replacing and validating the illustrative assumptions.
The project requires monthly or weekly operating forecasts rather than the model’s annual 2025–2050 timeline.
The user requires a guaranteed valuation, commercial outcome, carbon-credit entitlement, or investment recommendation.
