Restaurant Excel Weekly + Monthly Cash Flow with Graphs
Originally published: 24/04/2026 12:01
Publication number: ELQ-66982-1
View all versions & Certificate
certified

Restaurant Excel Weekly + Monthly Cash Flow with Graphs

Monthly & Weekly Cash Flow Tracker with Graphs for Cafés & Restaurants

Description

For café and restaurant owners who want deeper insight into their financial performance, this Excel template combines structured cash flow tracking with automatic data visualization.

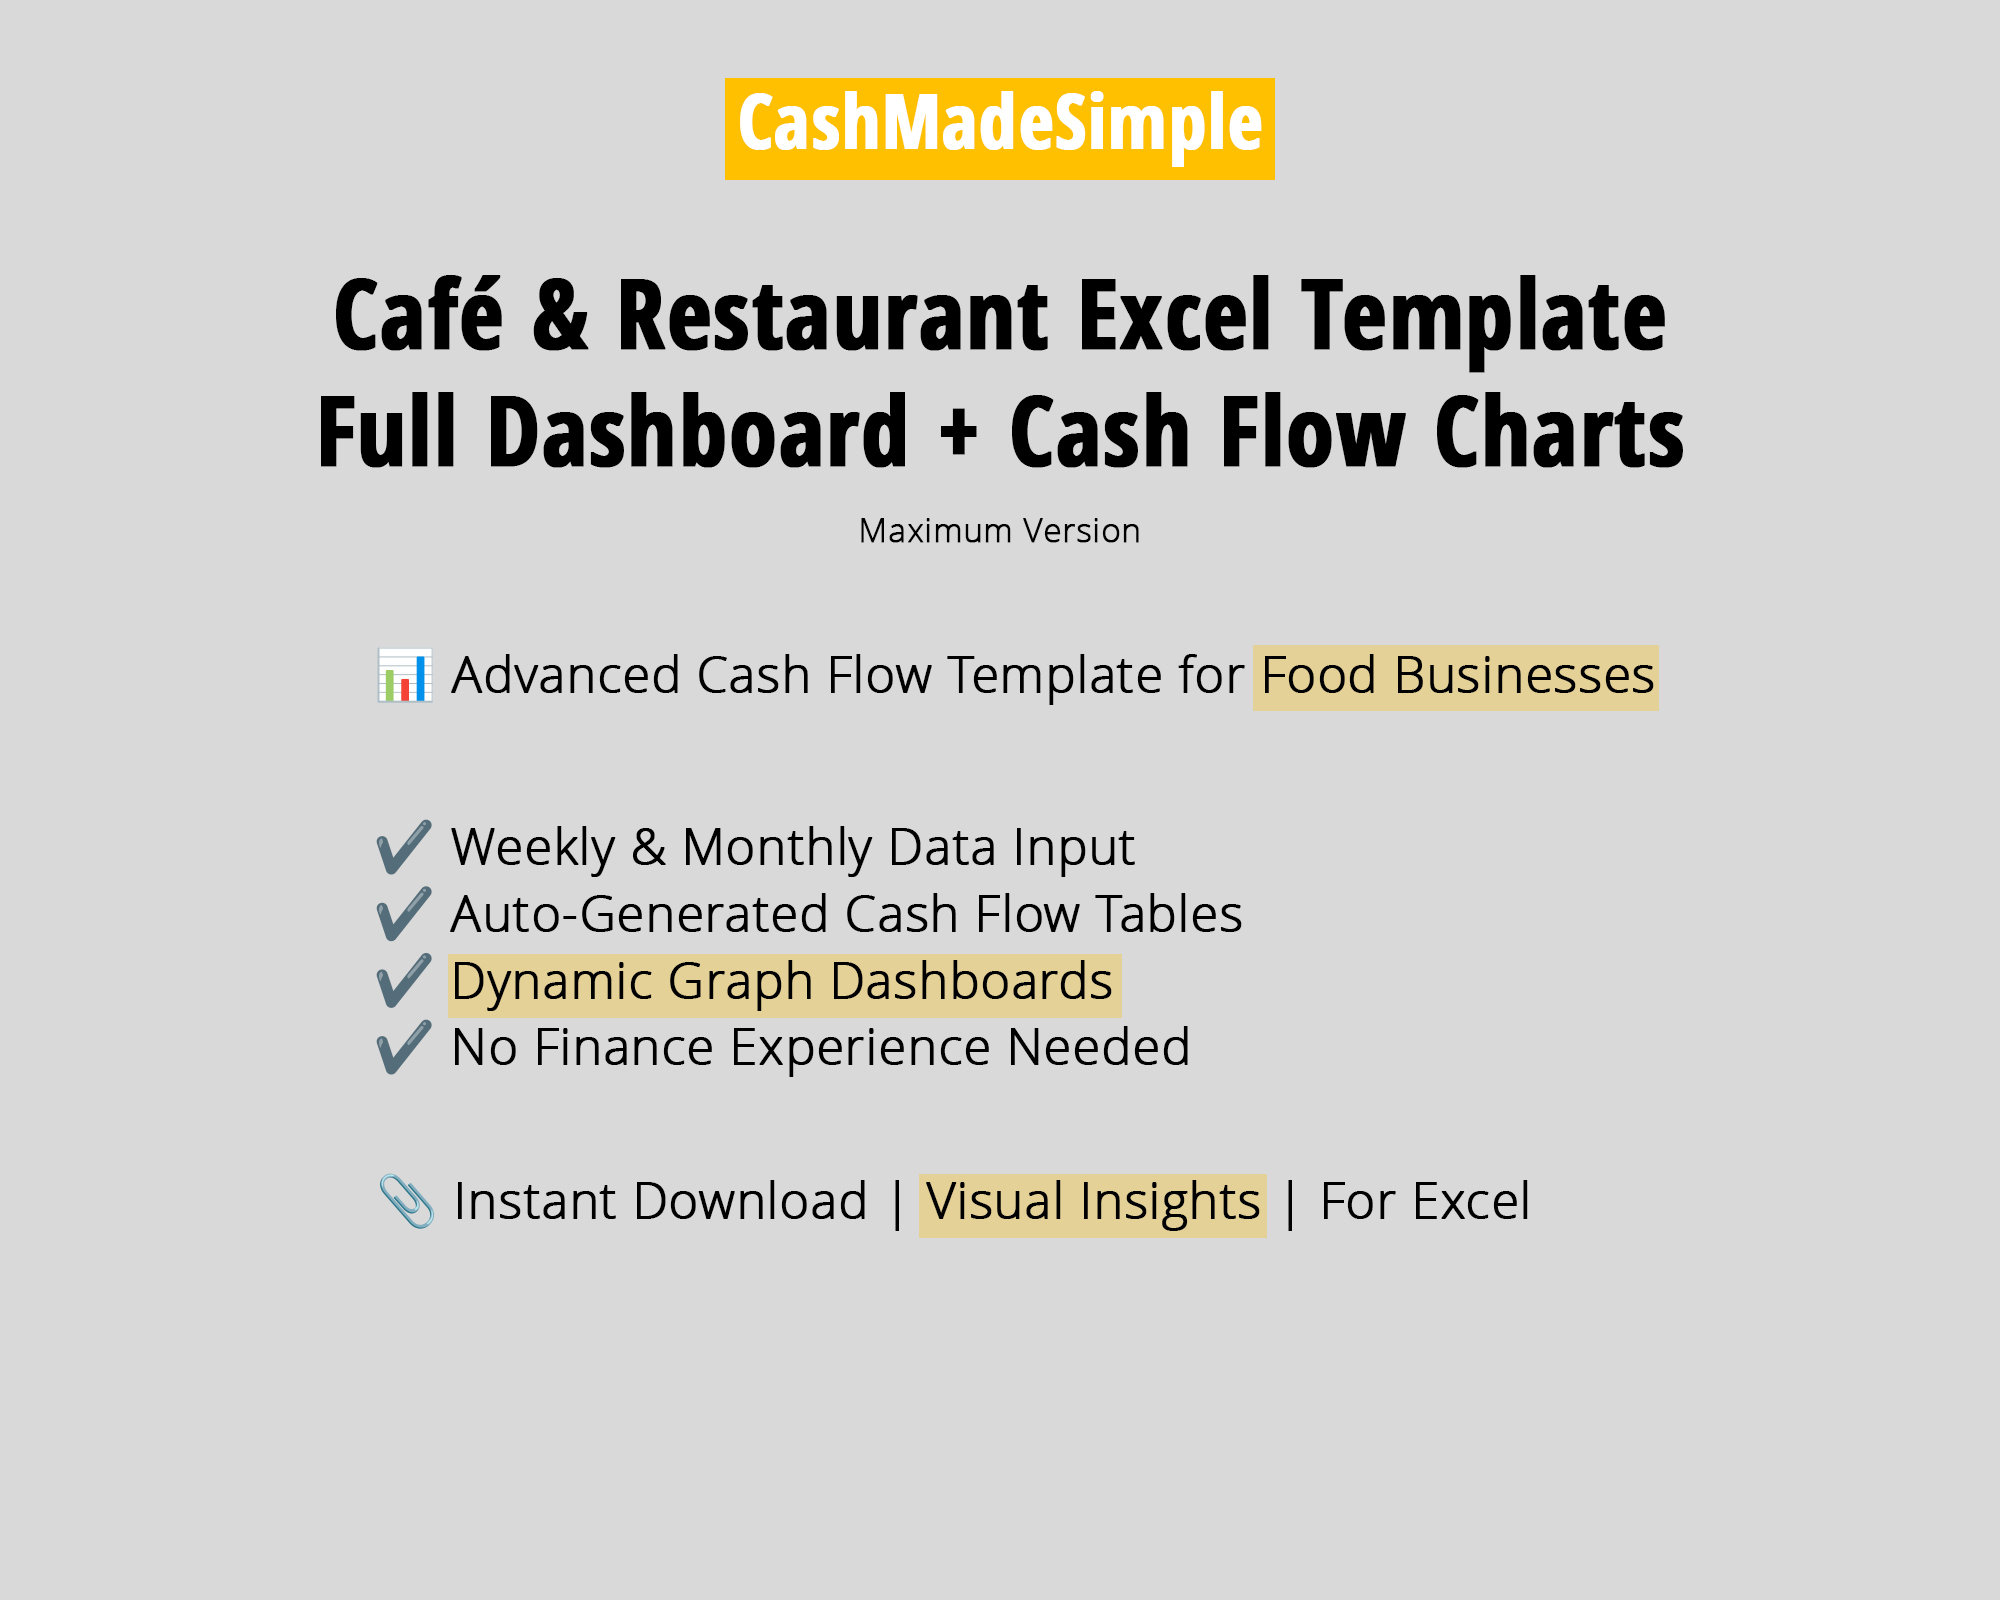
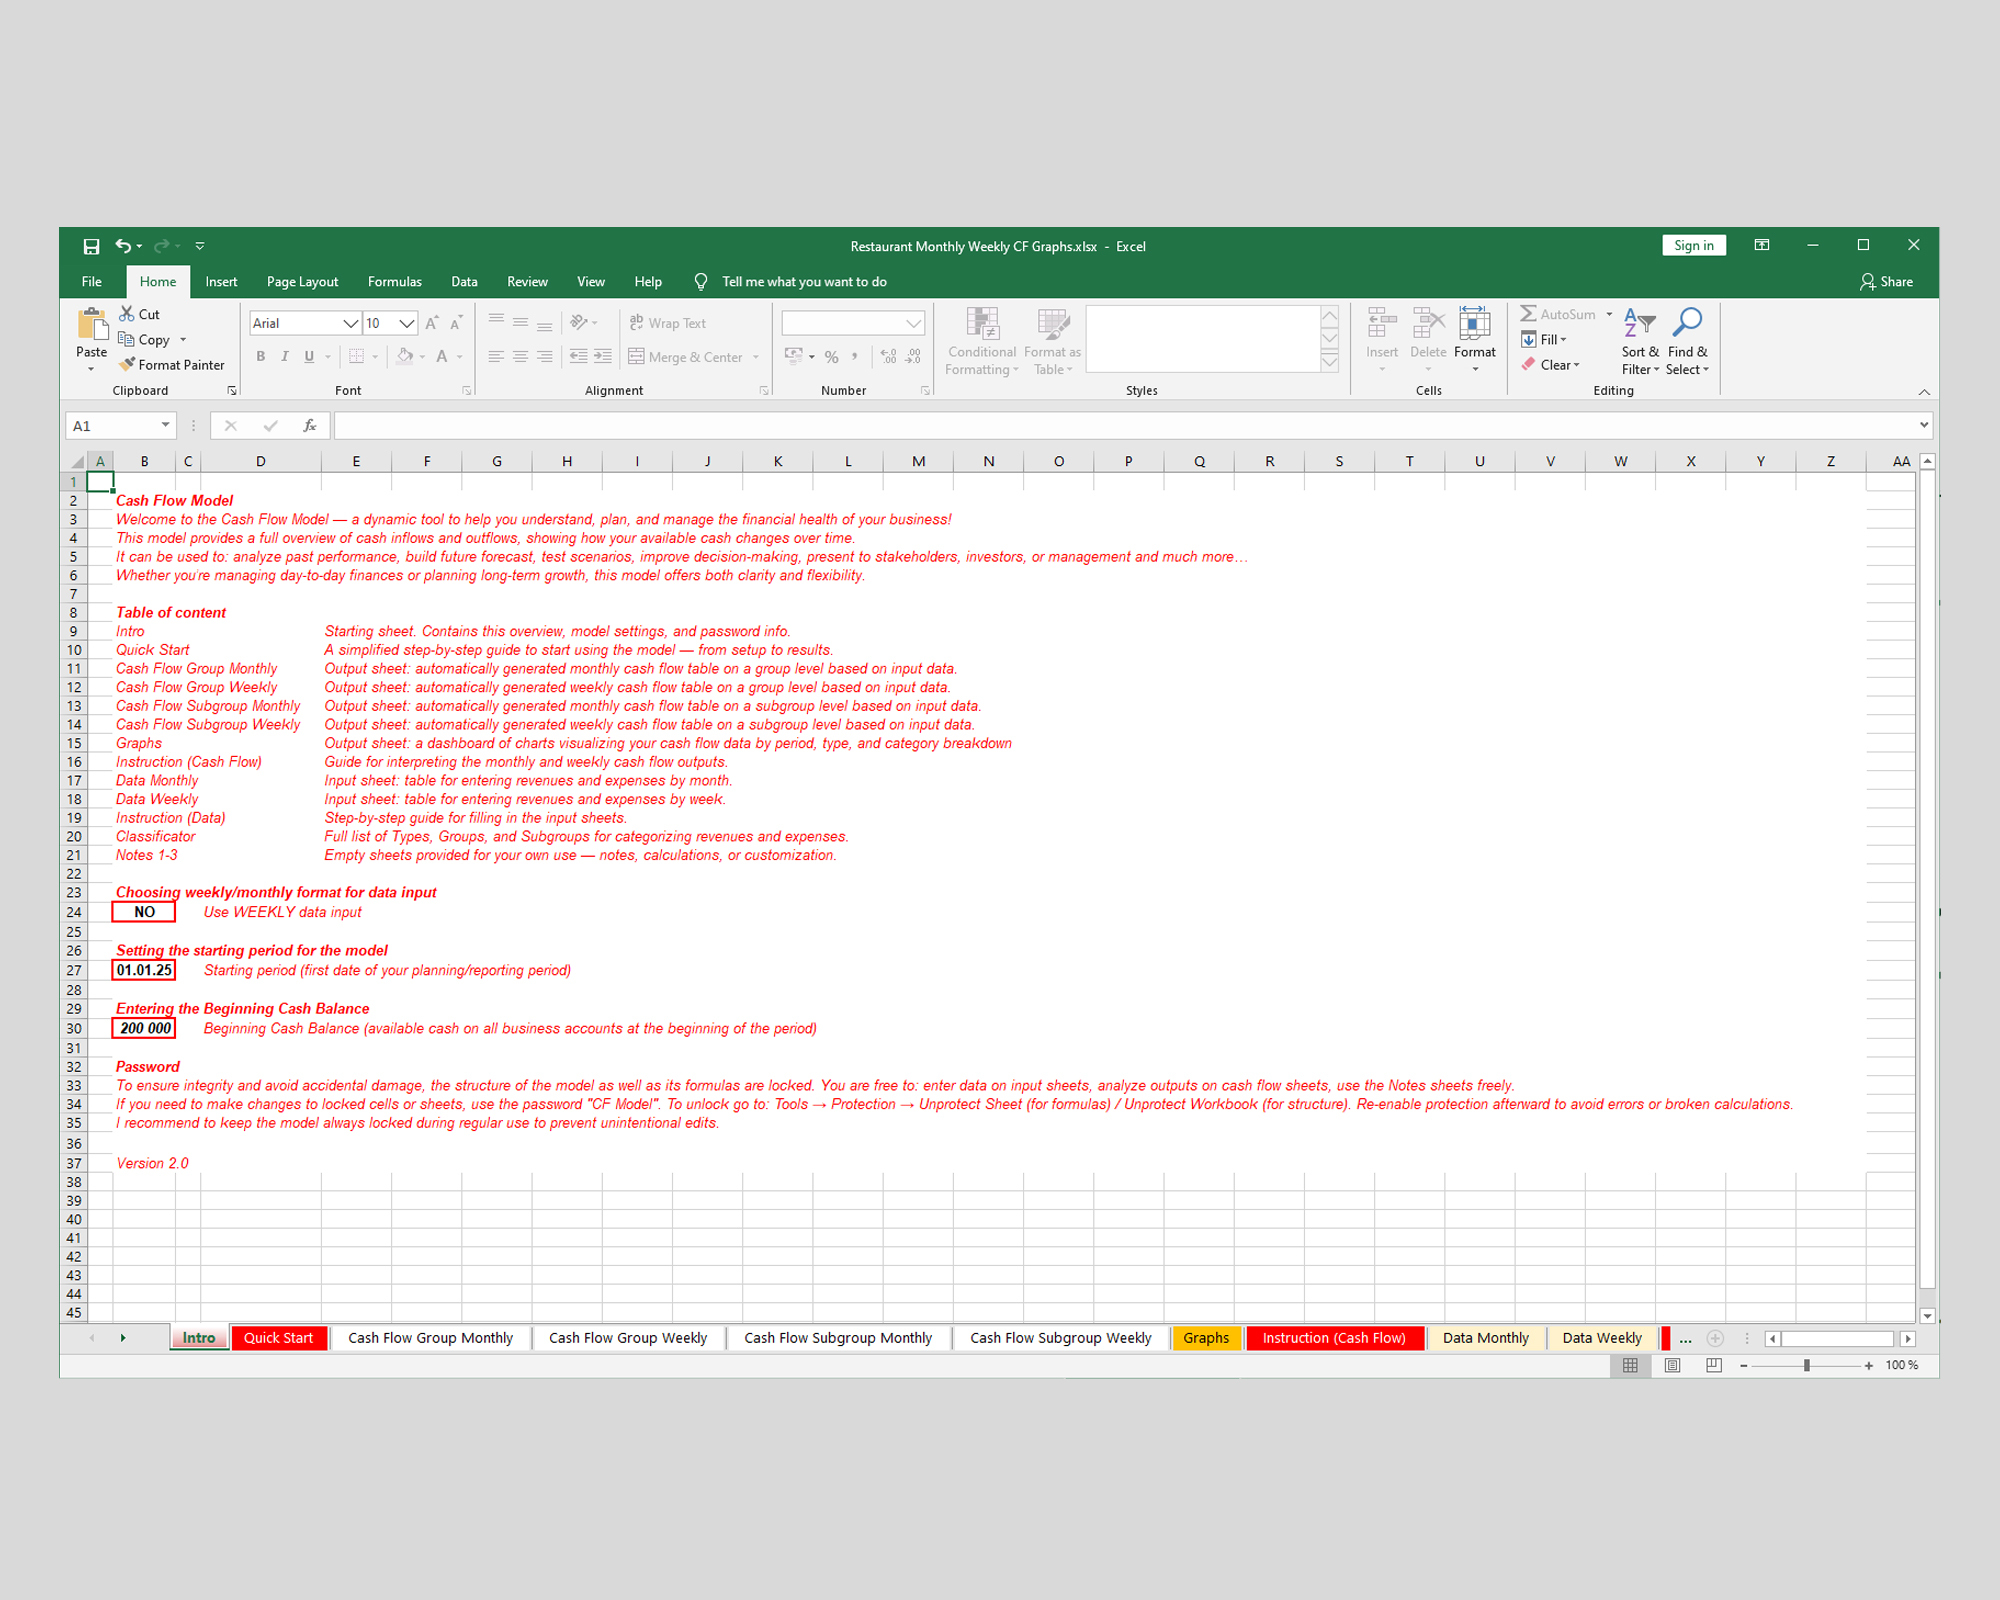
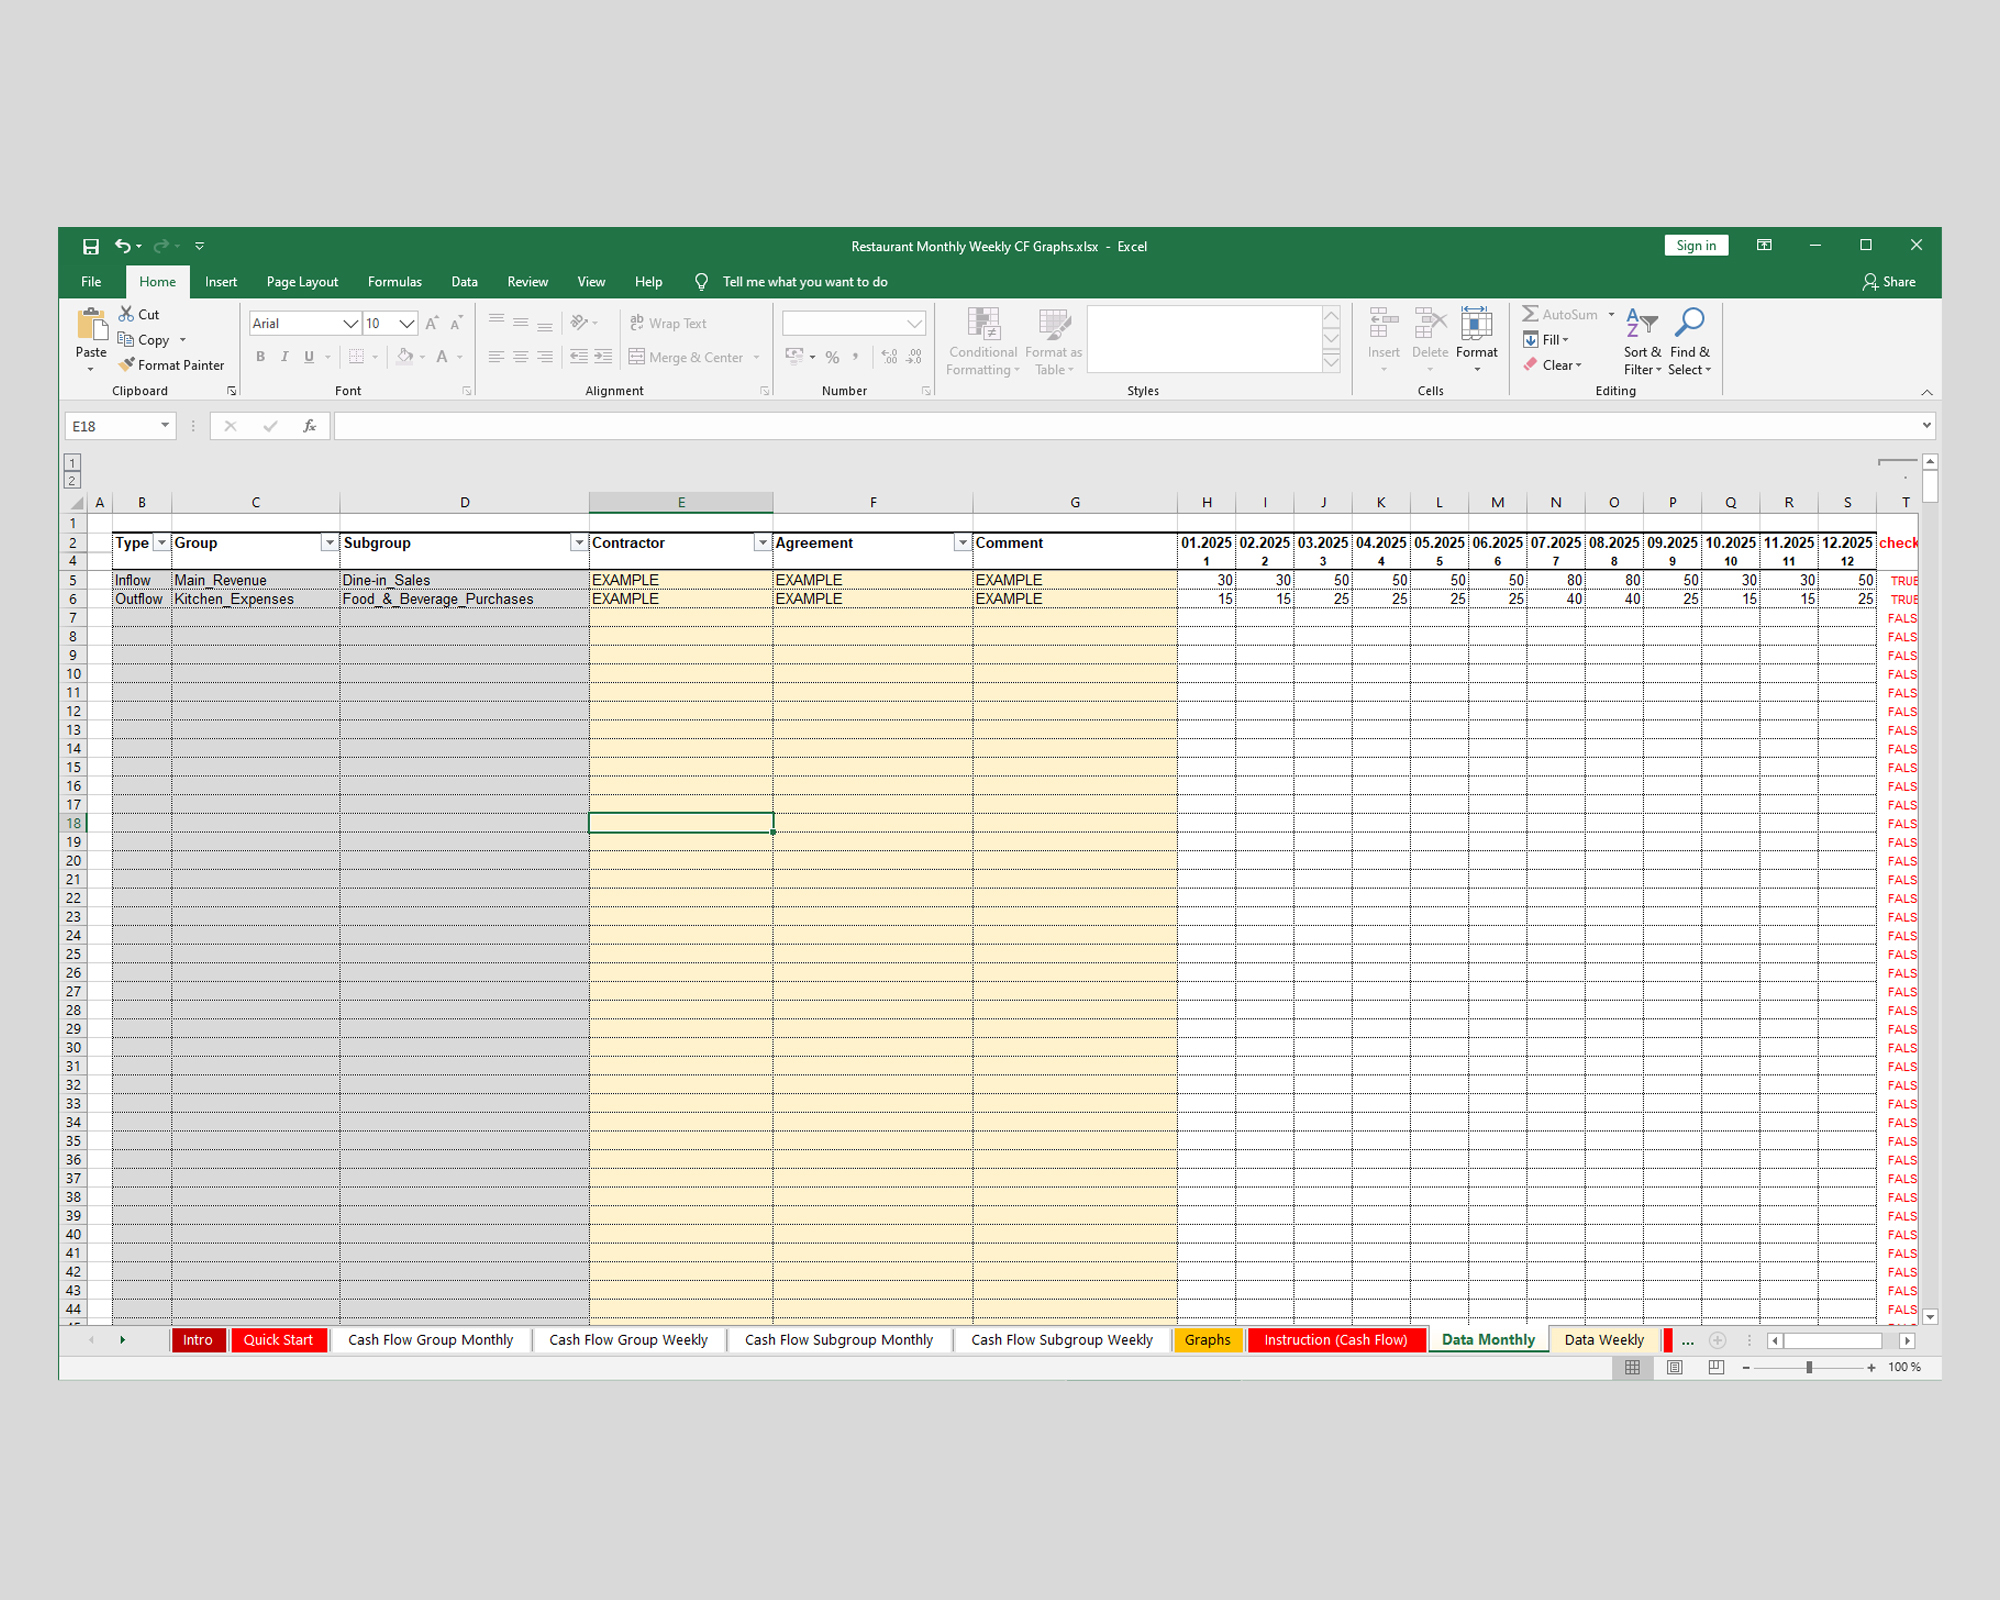
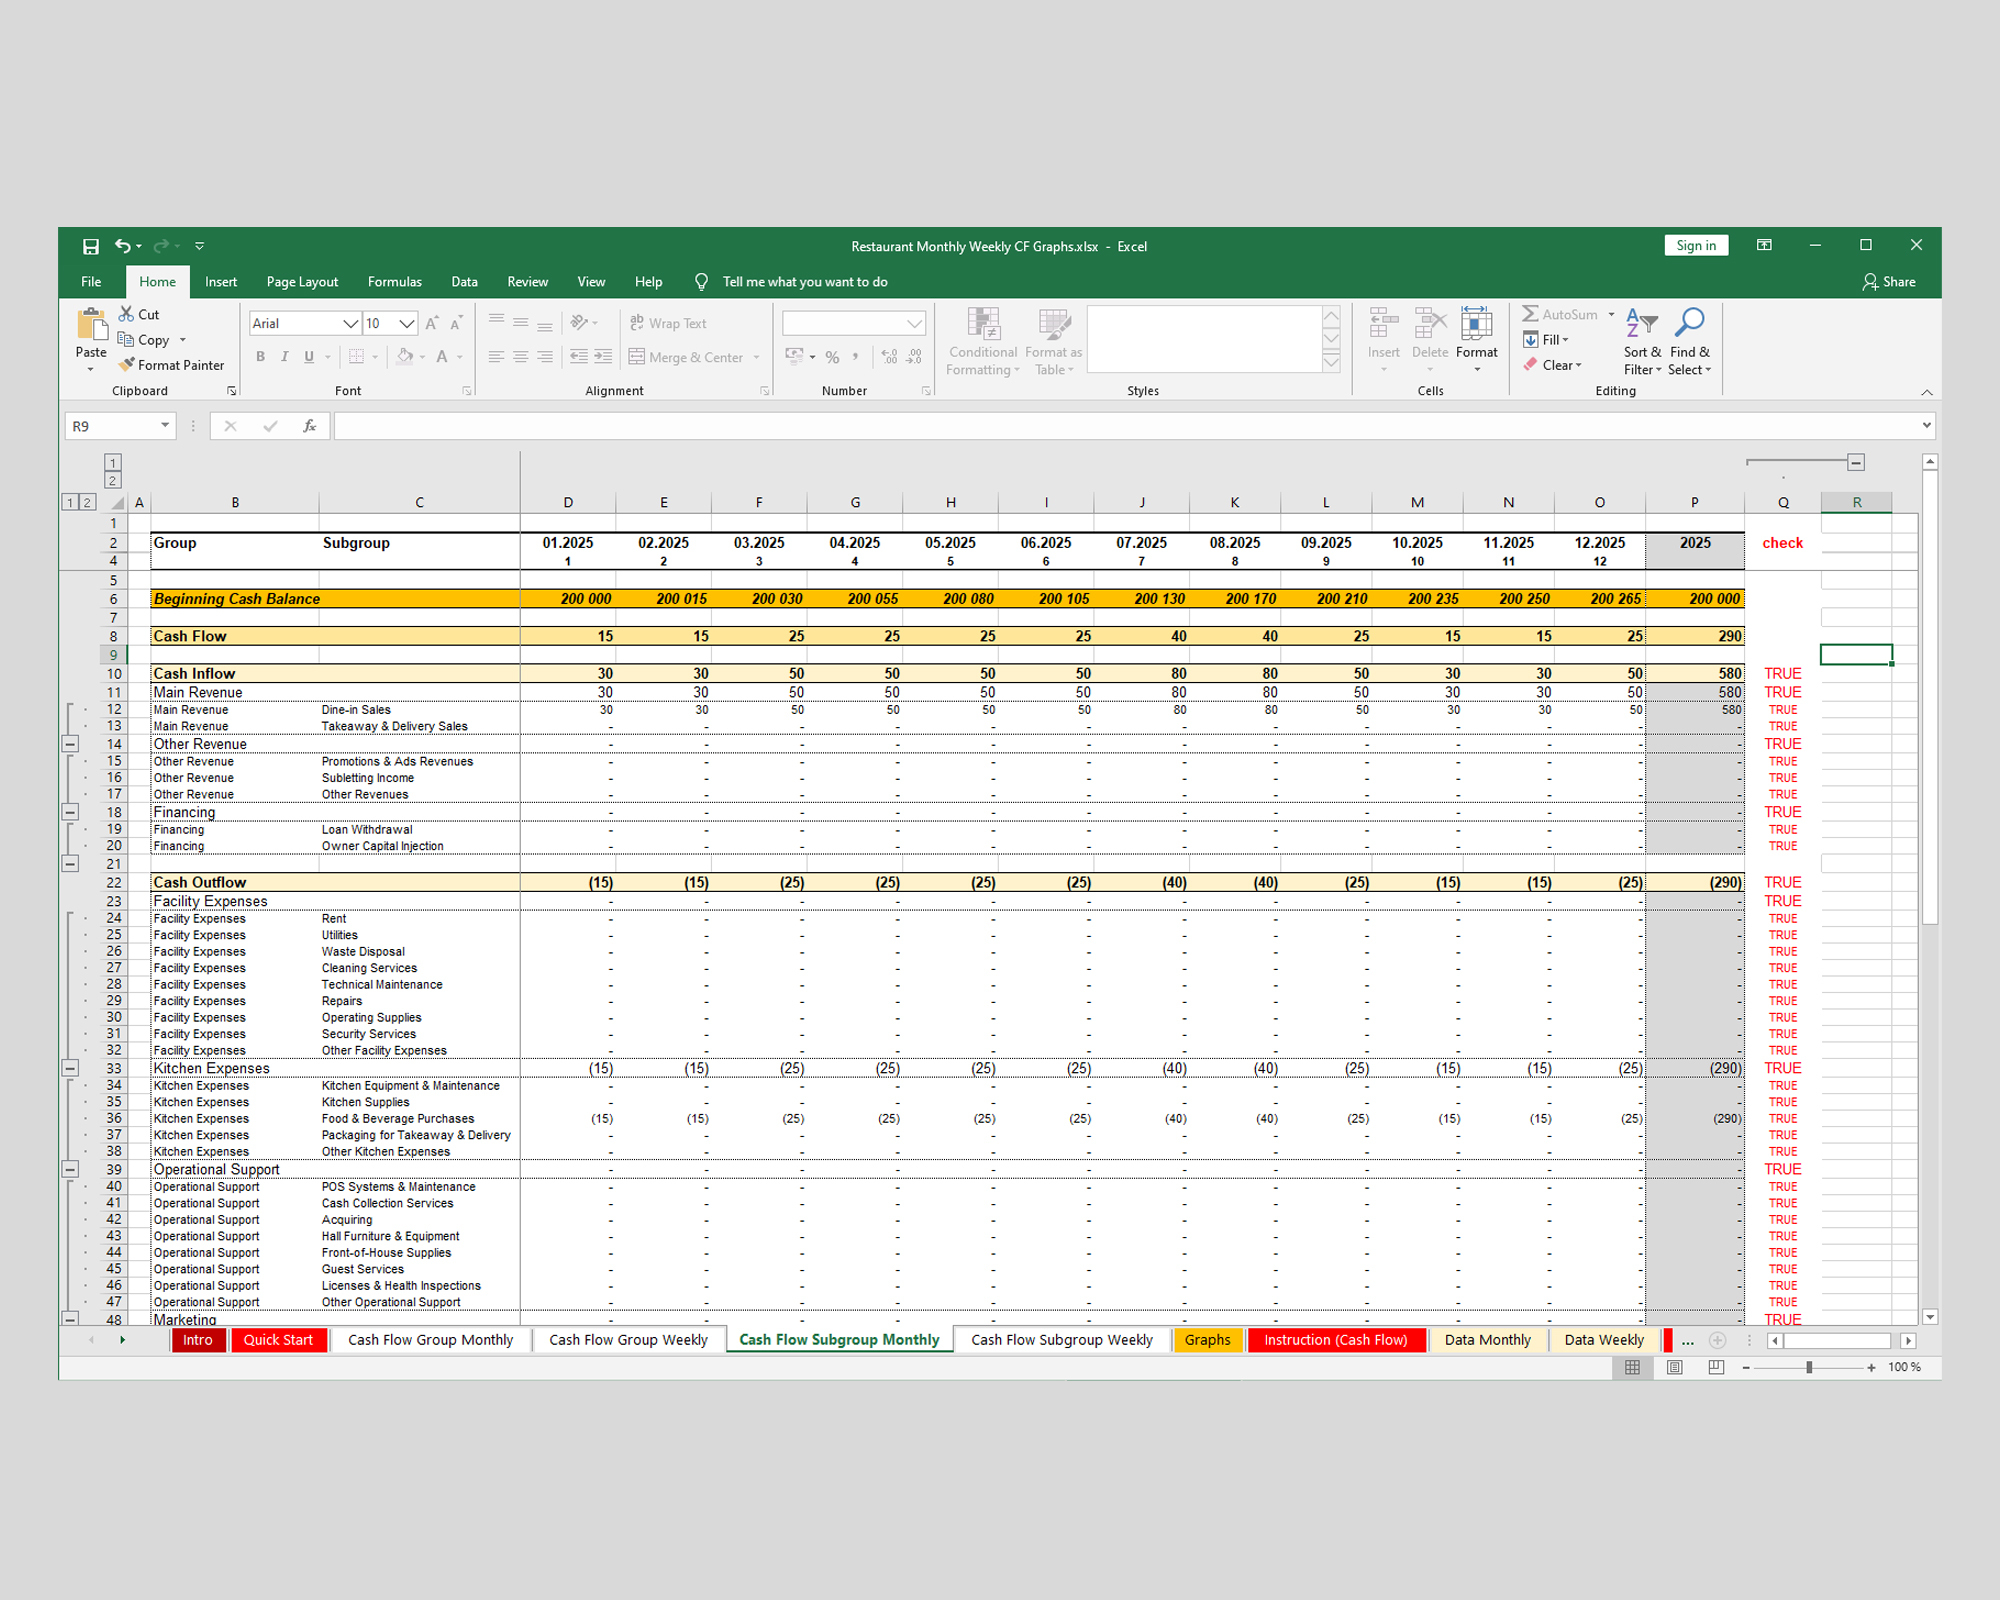
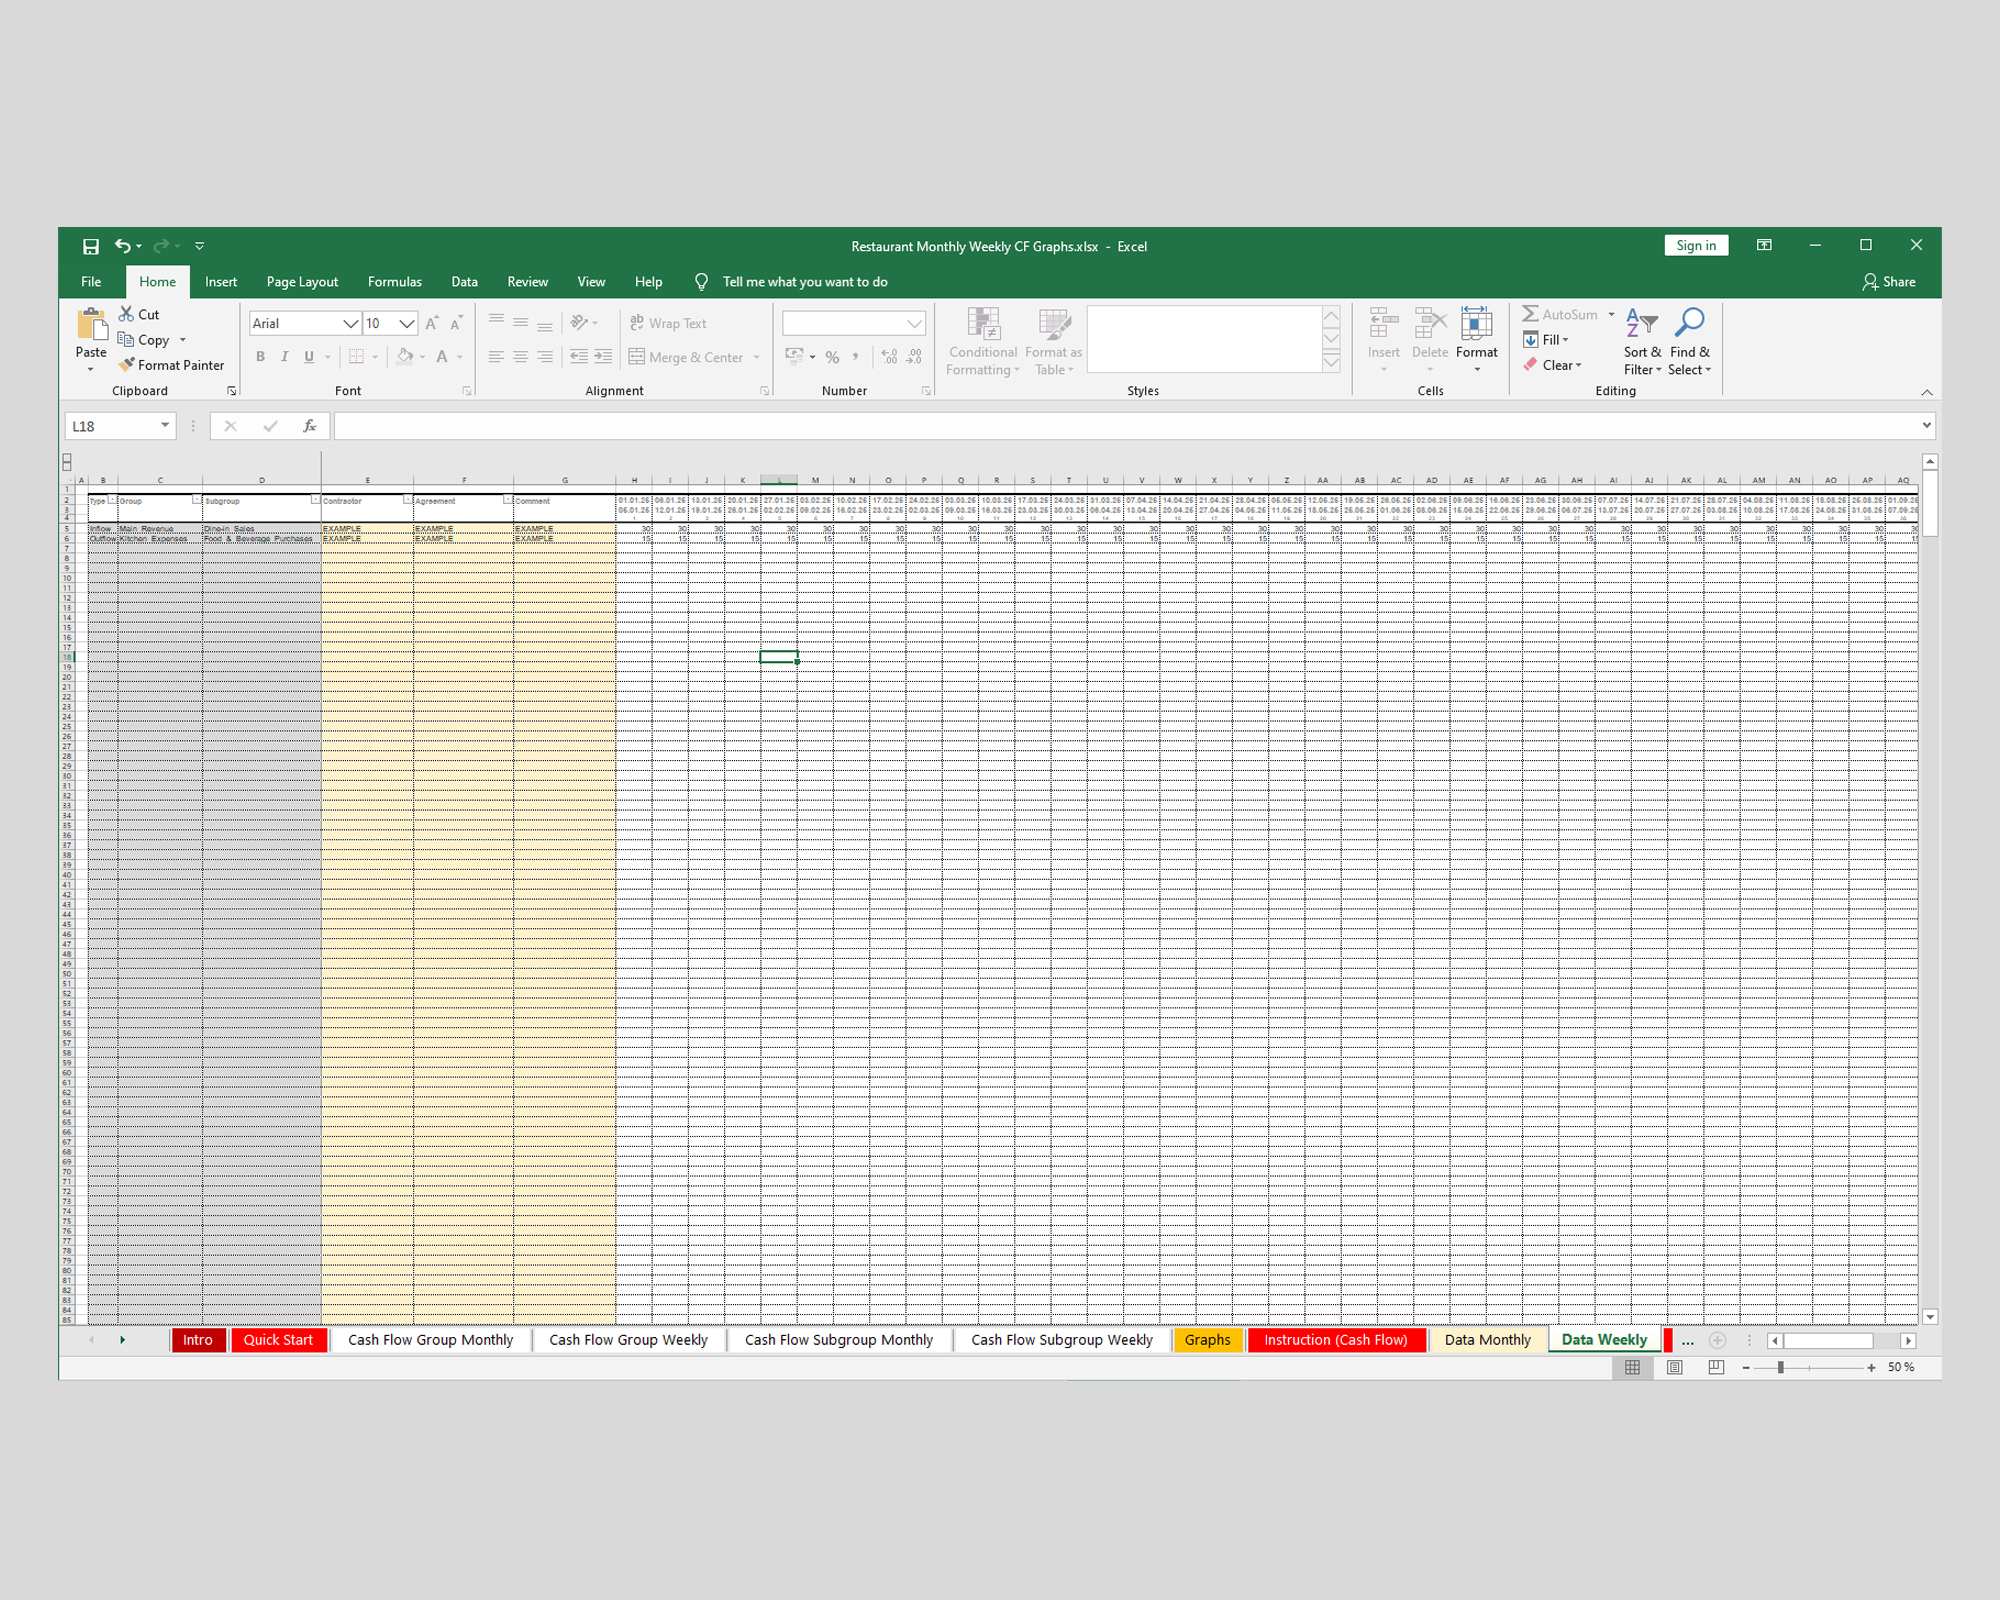
The template allows you to manage cash flow on both monthly and weekly levels. A built-in switching mechanism lets you choose your preferred input format, while the model automatically generates both weekly and monthly cash flow summaries.

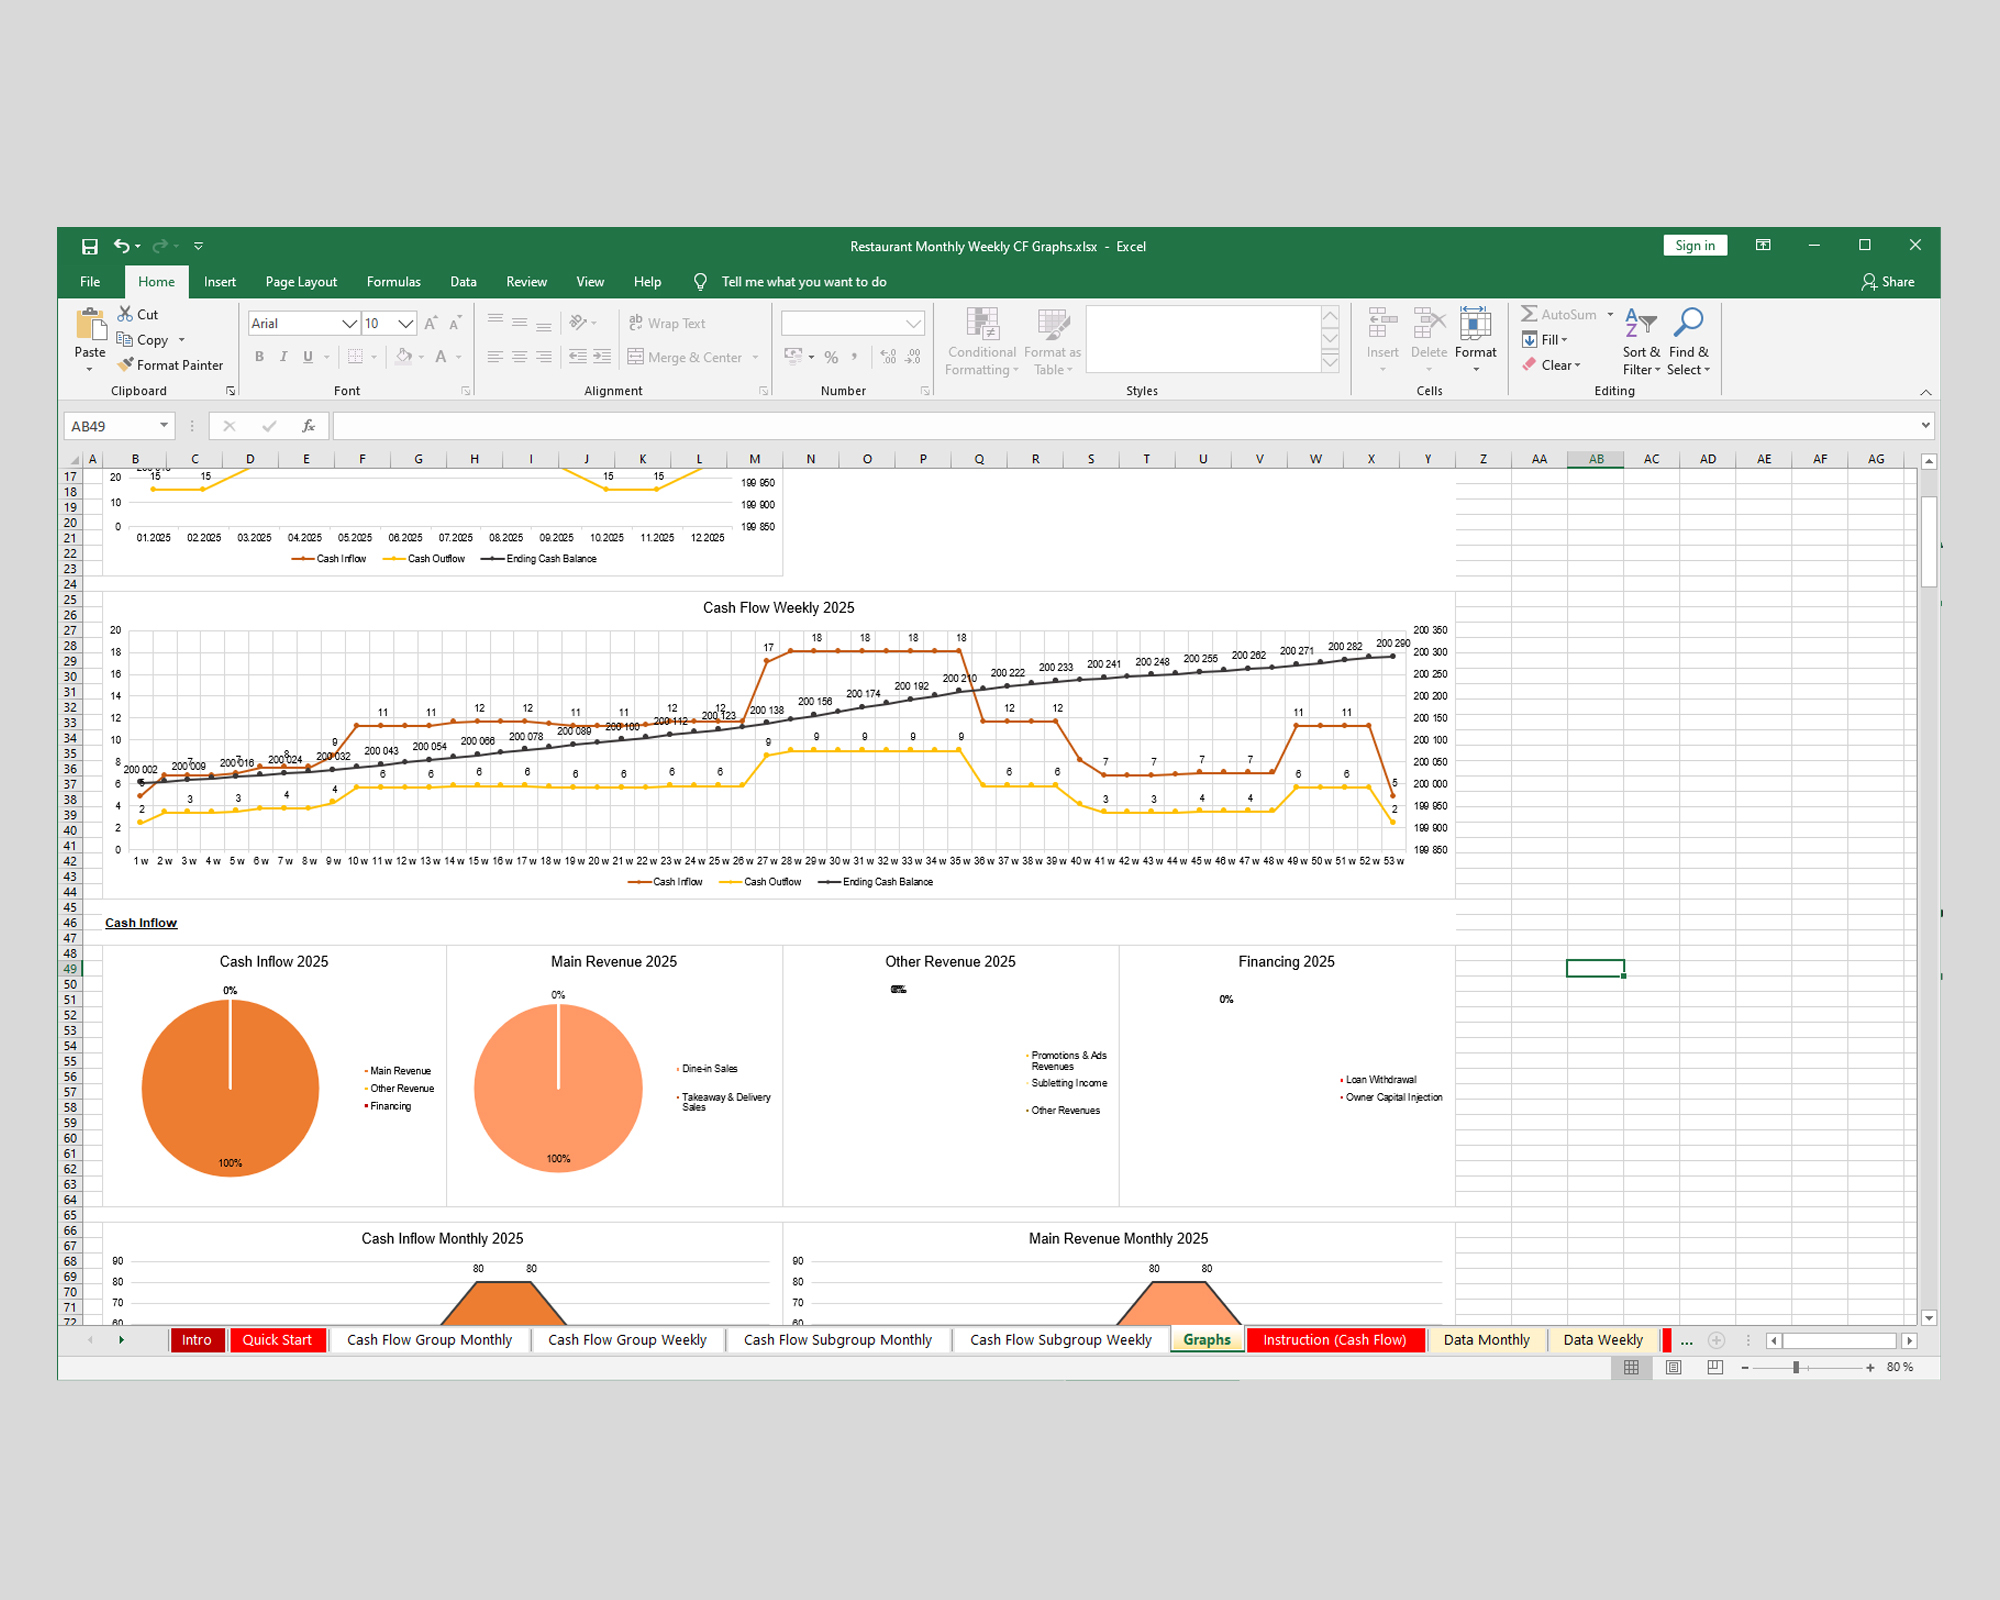
In addition to core tracking, this version includes a dedicated dashboard with automatically generated graphs. These visuals help transform raw financial data into clear insights, making it easier to understand how your business is performing over time.

This is especially valuable in the restaurant industry, where fluctuations in sales, seasonal trends, and cost changes (such as ingredients or utilities) can significantly impact profitability.

The dashboards help you:

  • Identify trends in revenue and expenses
  • Spot seasonal patterns
  • Monitor cash balance changes
  • Present financial data clearly to partners or stakeholders

The template remains easy to use, with revenues and expenses organized using a structured hierarchy (Type → Group → Subgroup).

The workbook includes setup, input tables, automated cash flow summaries, and a full dashboard with graphs.

This version is ideal for business owners who want both structured financial tracking and visual insights in one tool.

This Best Practice includes
1 Excel spreadsheet tool

Acquire business license for $39.00

Add to cart

Add to bookmarks

Discuss

Further information

Help cafés and restaurants track and analyze cash flow weekly and monthly
Provide automated financial summaries for better visibility
Visualize performance through charts and dashboards
Help identify trends in revenue, expenses, and cash balance

This template works best for small cafés and restaurants that want both structured tracking and visual insights, such as:

Busy cafés with fluctuating sales
Restaurants managing multiple cost categories
Owners who prefer visual dashboards

It is especially useful for presenting financial performance or quickly understanding trends.

This template may not be ideal for:
Multi-location restaurant groups needing consolidated reporting
Businesses requiring highly customized financial models
Companies already using accounting or ERP systems
Large organizations with complex financial operations


0.0 / 5 (0 votes)

please wait...